Running a beauty salon requires much more than excellent styling skills and premium products. Today, salon owners must track revenue, control costs, manage staff productivity, monitor customer retention, and analyze service performance regularly. However, when salon data stays scattered across notebooks or unstructured Excel sheets, decision-making becomes slow and inaccurate.
That is exactly where a Beauty Salons KPI Dashboard in Excel becomes a powerful business solution.
In this detailed guide, you will learn what a Beauty Salons KPI Dashboard in Excel is, how it works, its sheet-wise structure, advantages, best practices, and frequently asked questions. Moreover, this article explains everything in clear language, active voice, and practical terms, so even non-technical users can apply it confidently.
Click to Purchases Beauty Salons KPI Dashboard in Excel
What Is a Beauty Salons KPI Dashboard in Excel?
A Beauty Salons KPI Dashboard in Excel is a ready-to-use, interactive performance tracking tool designed specifically for beauty salons, spas, and personal care businesses.
Instead of reviewing multiple spreadsheets or manual reports, this dashboard consolidates all key performance indicators (KPIs) into one centralized Excel file. As a result, salon owners and managers can instantly track Month-to-Date (MTD) and Year-to-Date (YTD) performance.
This dashboard helps you monitor:
-
Revenue and service performance
-
Customer visits and retention
-
Staff productivity
-
Target achievement
-
Growth compared to the previous year
Because it runs entirely in Excel, you do not need any advanced technical skills or expensive software.
Why Do Beauty Salons Need a KPI Dashboard in Excel?
Beauty salons operate in a competitive and fast-moving environment. Therefore, owners must track performance regularly and react quickly to changes.
Without a KPI dashboard:
-
You rely on guesswork instead of data
-
You miss revenue opportunities
-
You fail to identify underperforming services
-
You struggle to track targets
However, with a Beauty Salons KPI Dashboard in Excel, you gain clear visibility, faster decisions, and better control over your business.
How Does a Beauty Salons KPI Dashboard in Excel Work?
The dashboard works by connecting actual data, target data, and previous year data into a structured Excel model.
Here is how it functions step by step:
-
You enter monthly actual numbers
-
You define monthly and yearly targets
-
You input previous year performance
-
Excel formulas calculate MTD and YTD results
-
The dashboard updates automatically using slicers and drop-downs
As a result, you always see real-time insights without manual calculations.
Click to Purchases Beauty Salons KPI Dashboard in Excel
What Worksheets Are Included in the Beauty Salons KPI Dashboard in Excel?
This ready-to-use dashboard contains 7 structured worksheets, each designed for a specific purpose.
1. What Is the Home Sheet in the Beauty Salons KPI Dashboard?
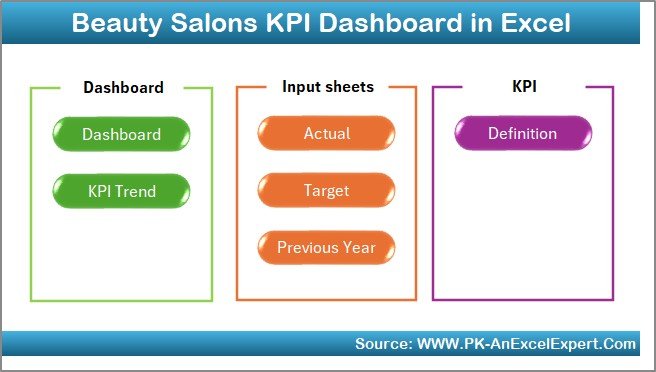
The Home Sheet acts as an index and navigation page.
Key Features of the Home Sheet:
-
Clean and simple layout
-
6 navigation buttons
-
One-click access to all major sheets
Because of this design, users can move between sheets quickly without searching manually.
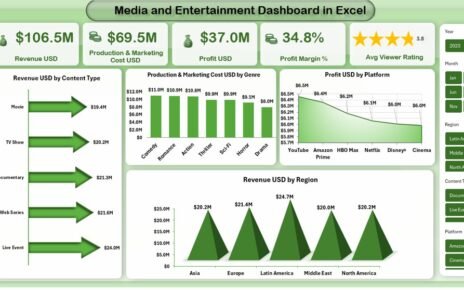
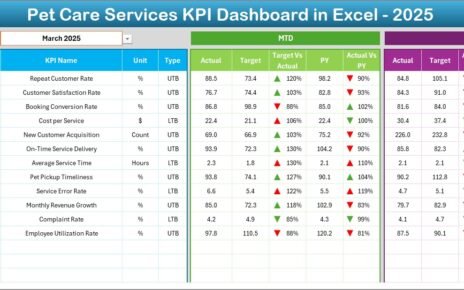
2. What Does the Dashboard Sheet Show?
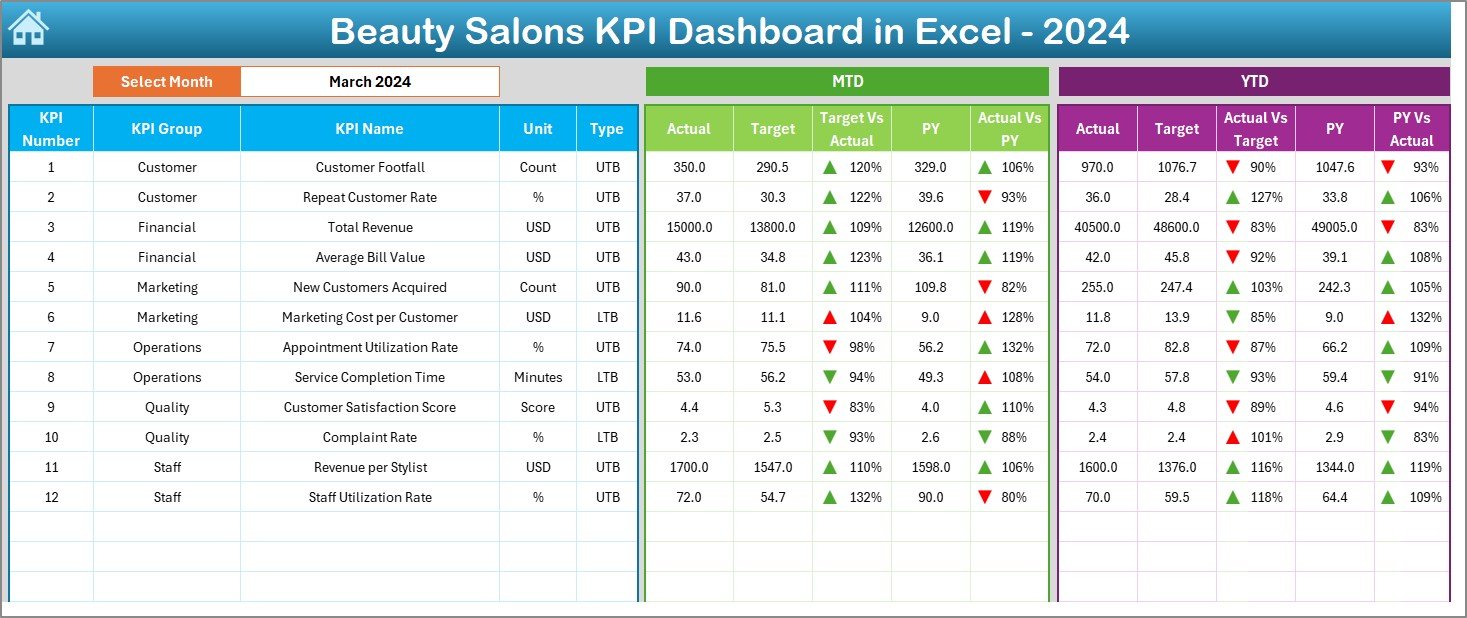
The Dashboard Sheet is the main analytical page of the Beauty Salons KPI Dashboard in Excel.
Key Highlights:
-
Month selection drop-down at cell D3
-
Automatic refresh of all KPIs
-
Visual performance indicators
KPIs Displayed on the Dashboard:
-
MTD Actual vs Target
-
MTD Actual vs Previous Year
-
YTD Actual vs Target
-
YTD Actual vs Previous Year
Additionally, the dashboard uses conditional formatting arrows:
-
🔼 Green arrows for positive performance
-
🔽 Red arrows for negative performance
Because of this, users can instantly identify performance gaps.
Click to Purchases Beauty Salons KPI Dashboard in Excel
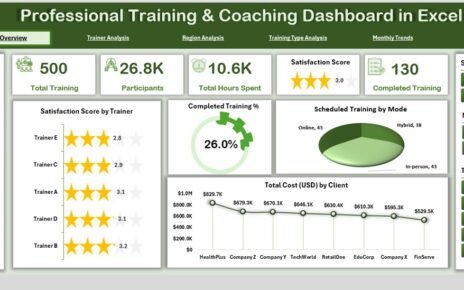
3. What Is the KPI Trend Sheet and Why Is It Important?
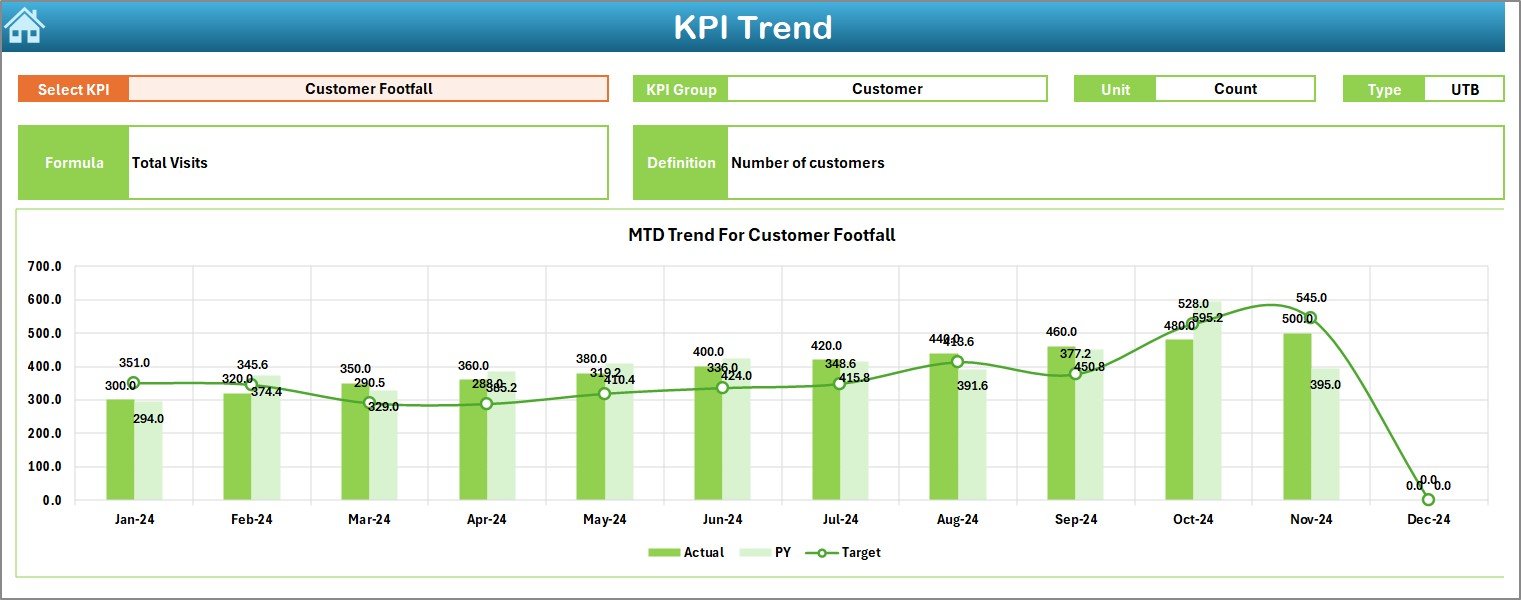
The KPI Trend Sheet helps you analyze performance trends over time.
How This Sheet Works:
-
Select the KPI name from the drop-down at cell C3
-
View detailed KPI information:
-
KPI Group
-
Unit of measurement
-
KPI Type (LTB or UTB)
-
Formula
-
Definition
-
Visual Insights:
-
MTD trend chart (Actual, Target, PY)
-
YTD trend chart (Actual, Target, PY)
As a result, you understand whether performance improves, declines, or stays stable.
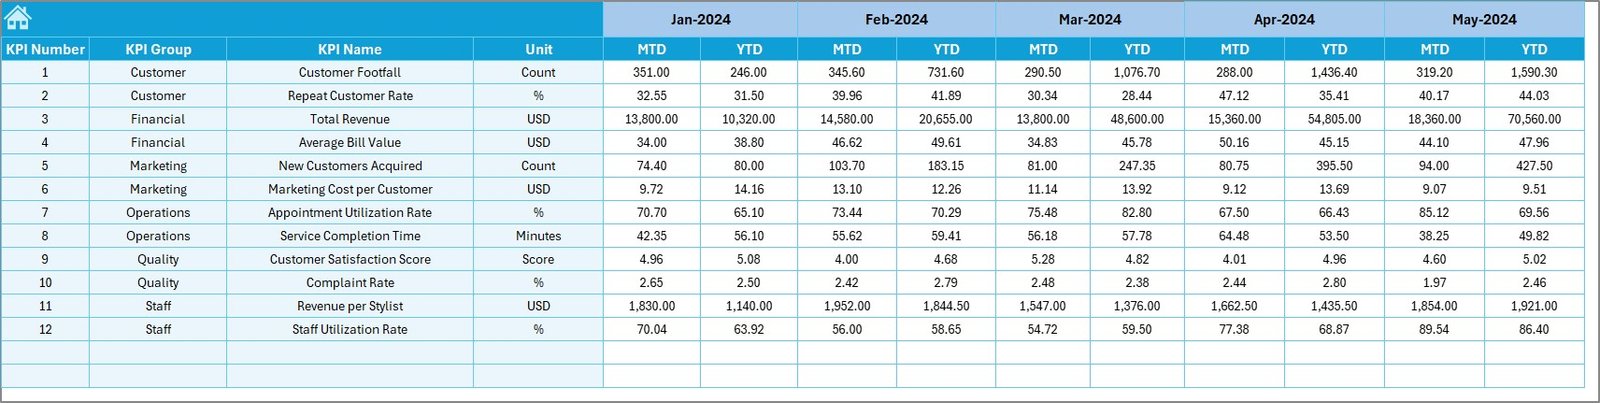
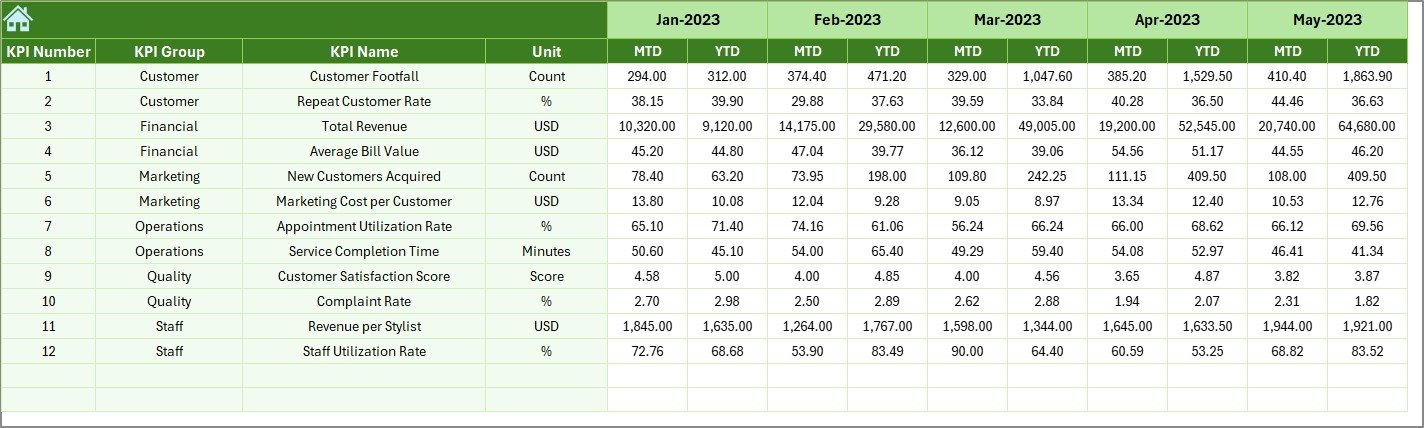
4. How Do You Use the Actual Numbers Input Sheet?
The Actual Numbers Input Sheet is where you enter real business data.
How to Use This Sheet:
-
Select the first month of the year in cell E1
-
Enter MTD and YTD actual values for each KPI
-
Update data monthly without changing formulas
Because the dashboard links directly to this sheet, all visuals update instantly.
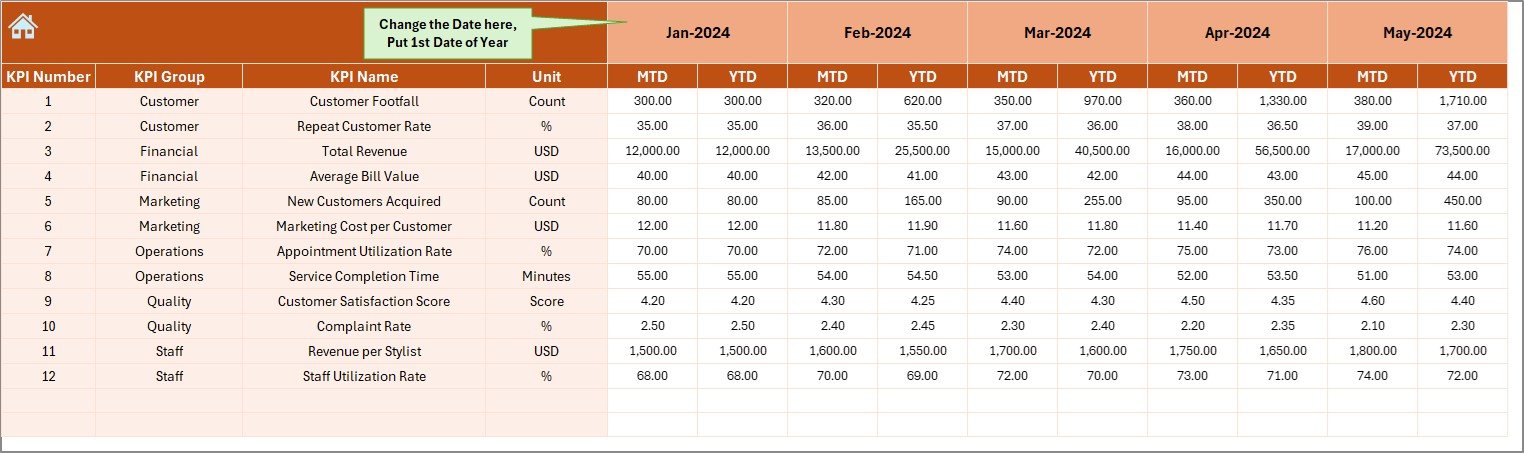
5. What Is the Purpose of the Target Sheet?
The Target Sheet stores planned performance goals.
What You Enter Here:
-
Monthly MTD targets
-
Yearly YTD targets
-
KPI-wise target values
As a result, the dashboard calculates Target vs Actual variance automatically.
6. Why Is the Previous Year Number Sheet Important?
The Previous Year Number Sheet helps you track growth and historical performance.
Benefits of This Sheet:
-
Enables Year-over-Year (YoY) analysis
-
Highlights growth trends
-
Identifies seasonal patterns
You enter data exactly like the current year, which keeps comparisons accurate.
Click to Purchases Beauty Salons KPI Dashboard in Excel
7. What Is the KPI Definition Sheet?
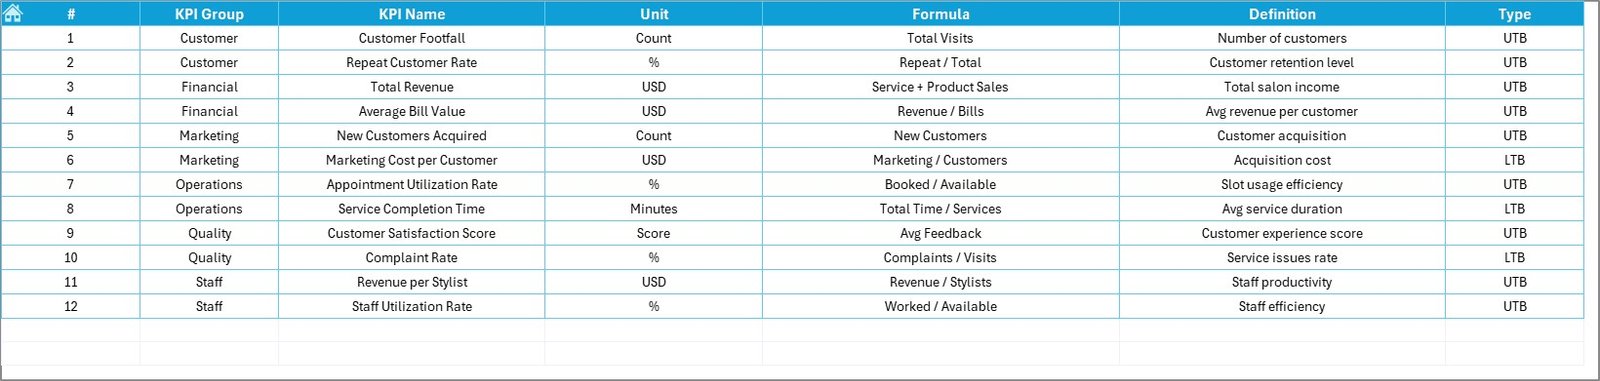
The KPI Definition Sheet acts as a master reference.
Information Stored:
-
KPI Name
-
KPI Group
-
Unit
-
Formula
-
KPI Definition
-
KPI Type (LTB / UTB)
Because of this sheet, everyone in your team understands KPI meaning clearly.
What KPIs Can a Beauty Salon Track Using This Dashboard?
A Beauty Salons KPI Dashboard in Excel can track multiple performance indicators, such as:
-
Total Revenue
-
Average Revenue per Customer
-
Customer Footfall
-
Repeat Customer Rate
-
Service Utilization Rate
-
Staff Productivity
-
Product Sales Ratio
-
Appointment Conversion Rate
You can customize KPIs easily based on your salon size and services.
Click to Purchases Beauty Salons KPI Dashboard in Excel
Advantages of Beauty Salons KPI Dashboard in Excel
1. Centralized Performance Monitoring
You track all salon KPIs from one Excel file instead of multiple reports.
2. Time-Saving Automation
Excel formulas calculate MTD, YTD, and variances automatically.
3. Easy to Use
You do not need coding, Power BI, or advanced Excel knowledge.
4. Clear Visual Indicators
Conditional arrows highlight performance instantly.
5. Better Decision-Making
You identify issues early and act quickly.
6. Cost-Effective Solution
You avoid expensive BI tools and subscriptions.
Who Should Use a Beauty Salons KPI Dashboard in Excel?
This dashboard suits:
-
Salon owners
-
Spa managers
-
Franchise operators
-
Operations managers
-
Finance teams
-
Business consultants
Because Excel is widely used, anyone can adopt it easily.
Best Practices for the Beauty Salons KPI Dashboard in Excel
1. Update Data Monthly
Always enter actual numbers at the end of each month.
2. Define Clear KPIs
Avoid tracking too many KPIs. Focus on what matters.
3. Set Realistic Targets
Use historical data to set achievable goals.
4. Review Trends Regularly
Check KPI Trend Sheet before making decisions.
5. Train Your Team
Explain KPI definitions so everyone stays aligned.
6. Keep Data Clean
Avoid manual overwriting of formulas and formats.
Click to Purchases Beauty Salons KPI Dashboard in Excel
How Does This Dashboard Improve Salon Profitability?
This dashboard improves profitability by:
-
Identifying low-performing services
-
Highlighting revenue gaps
-
Tracking staff efficiency
-
Improving customer retention
As a result, you increase revenue while controlling costs.
Can You Customize the Beauty Salons KPI Dashboard in Excel?
Yes, you can easily customize:
-
KPIs
-
Target values
-
Reporting months
-
KPI groups
Because the dashboard uses standard Excel logic, customization remains simple.
Click to Purchases Beauty Salons KPI Dashboard in Excel
Conclusion: Why You Should Use a Beauty Salons KPI Dashboard in Excel
A Beauty Salons KPI Dashboard in Excel transforms raw salon data into clear, actionable insights. Instead of guessing performance, you rely on numbers, trends, and comparisons.
This dashboard helps you:
-
Save time
-
Improve decision-making
-
Increase profitability
-
Maintain full control over your salon operations
If you want a simple yet powerful performance tracking system, this Excel dashboard becomes the perfect choice.
Frequently Asked Questions (FAQs)
1. What is a Beauty Salons KPI Dashboard in Excel?
It is an Excel-based tool that tracks salon performance using KPIs, charts, and automated calculations.
2. Do I need advanced Excel skills to use this dashboard?
No, basic Excel knowledge is enough.
3. Can I add new KPIs to the dashboard?
Yes, you can add or modify KPIs easily.
4. Does the dashboard support MTD and YTD analysis?
Yes, it tracks both MTD and YTD automatically.
5. Can small salons use this dashboard?
Yes, it suits both small and large salons.
6. How often should I update the dashboard?
You should update it monthly for best results.
Click to Purchases Beauty Salons KPI Dashboard in Excel
Visit our YouTube channel to learn step-by-step video tutorials