Climate change organizations operate in one of the most critical and data-driven environments in the world. Every single day, climate change NGOs track emissions reduction programs, awareness campaigns, funding utilization, field activities, and measurable environmental impact. However, when this vital data stays scattered across Excel files and static reports, decision-making slows down and transparency suffers.
That is exactly where a Climate Change NGOs KPI Dashboard in Power BI becomes an essential solution.
This ready-to-use Power BI dashboard transforms raw climate and NGO performance data into clear, interactive, and actionable insights. As a result, NGOs can track performance, report impact to donors, and align teams around shared goals with confidence.
In this detailed guide, you will learn what a Climate Change NGOs KPI Dashboard in Power BI is, how it works, its page-wise structure, advantages, best practices, and frequently asked questions. Moreover, this article uses simple language, active voice, and real-world logic, so anyone can understand it without technical complexity.
Click to Purchases Climate Change NGOs KPI Dashboard in Power BI
What Is a Climate Change NGOs KPI Dashboard in Power BI?
A Climate Change NGOs KPI Dashboard in Power BI is an interactive performance monitoring and reporting tool designed specifically for organizations working on climate action, sustainability, and environmental protection.
Instead of manually compiling reports every month, this dashboard connects structured Excel data with Power BI visuals. As a result, NGO leaders and analysts can monitor Month-to-Date (MTD) and Year-to-Date (YTD) KPIs from one centralized platform.
This dashboard helps climate NGOs track:
-
Program performance
-
Fund utilization
-
Environmental impact metrics
-
Progress against targets
-
Year-over-year improvements
Because Power BI supports interactive visuals and drill-through features, the dashboard makes reporting transparent and donor-ready.
Why Do Climate Change NGOs Need a KPI Dashboard in Power BI?
Climate change NGOs manage complex programs across regions, timelines, and funding sources. Therefore, they must measure results accurately and communicate impact clearly.
Without a KPI dashboard:
-
Performance tracking becomes manual
-
Reporting consumes excessive time
-
Donor transparency weakens
-
Strategic decisions rely on assumptions
However, with a Climate Change NGOs KPI Dashboard in Power BI, organizations gain clarity, accountability, and confidence.
This dashboard enables NGOs to:
-
Track MTD and YTD performance
-
Compare actual results with targets
-
Measure progress against previous years
-
Identify underperforming KPIs early
As a result, leadership teams make faster, data-driven decisions.
Click to Purchases Climate Change NGOs KPI Dashboard in Power BI
How Does a Climate Change NGOs KPI Dashboard in Power BI Work?
The dashboard works by combining Excel-based data input with Power BI analytics and visualization.
Here is how the process works step by step:
-
NGOs enter actual KPI values in Excel
-
They define monthly and yearly targets
-
They input previous year performance data
-
Power BI calculates KPI comparisons
-
Interactive visuals update automatically
Because of this structure, NGOs avoid repetitive reporting work while maintaining accuracy.
What Pages Are Included in the Climate Change NGOs KPI Dashboard in Power BI?
This ready-to-use Power BI dashboard includes three professionally designed pages, each serving a clear analytical purpose.
What Does the Summary Page Show?
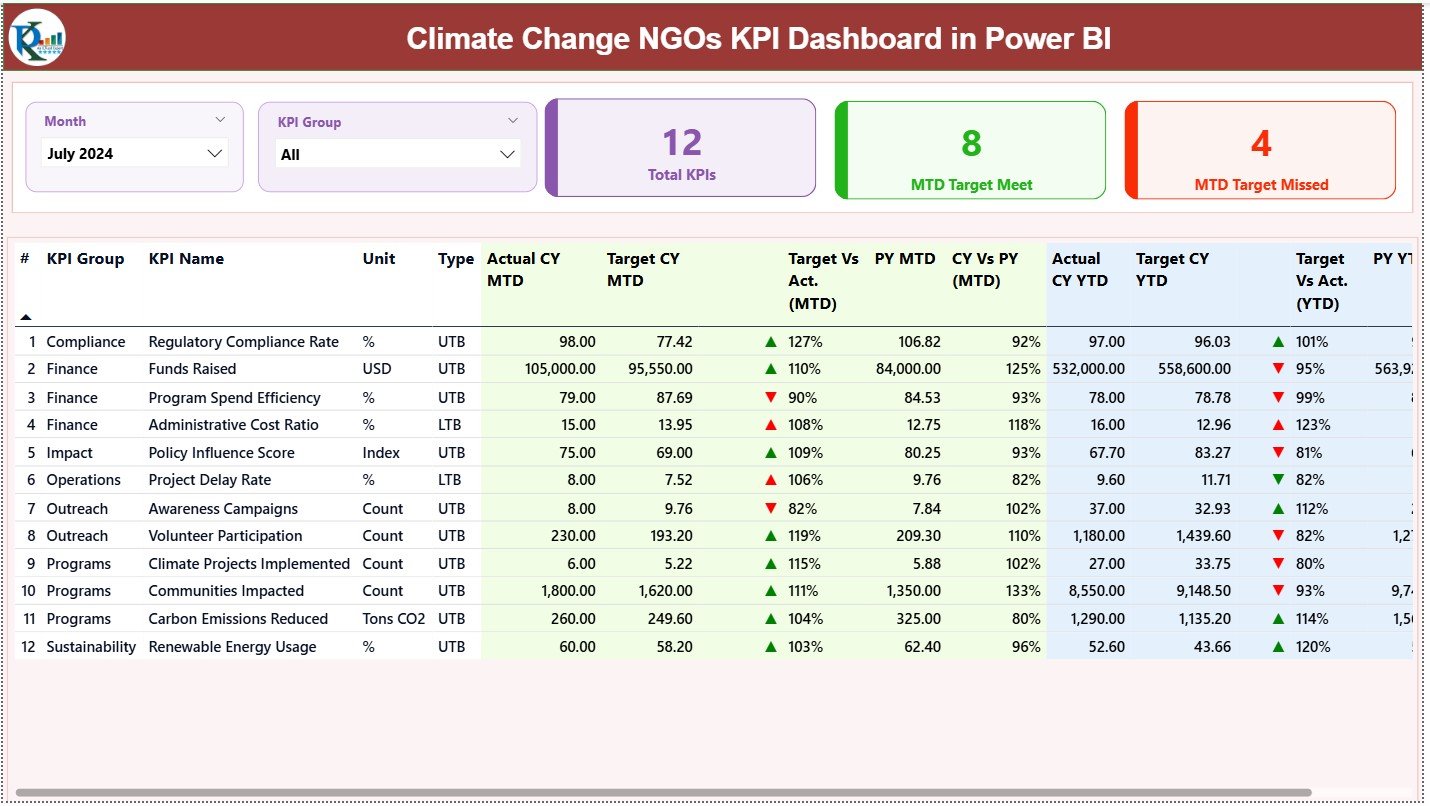
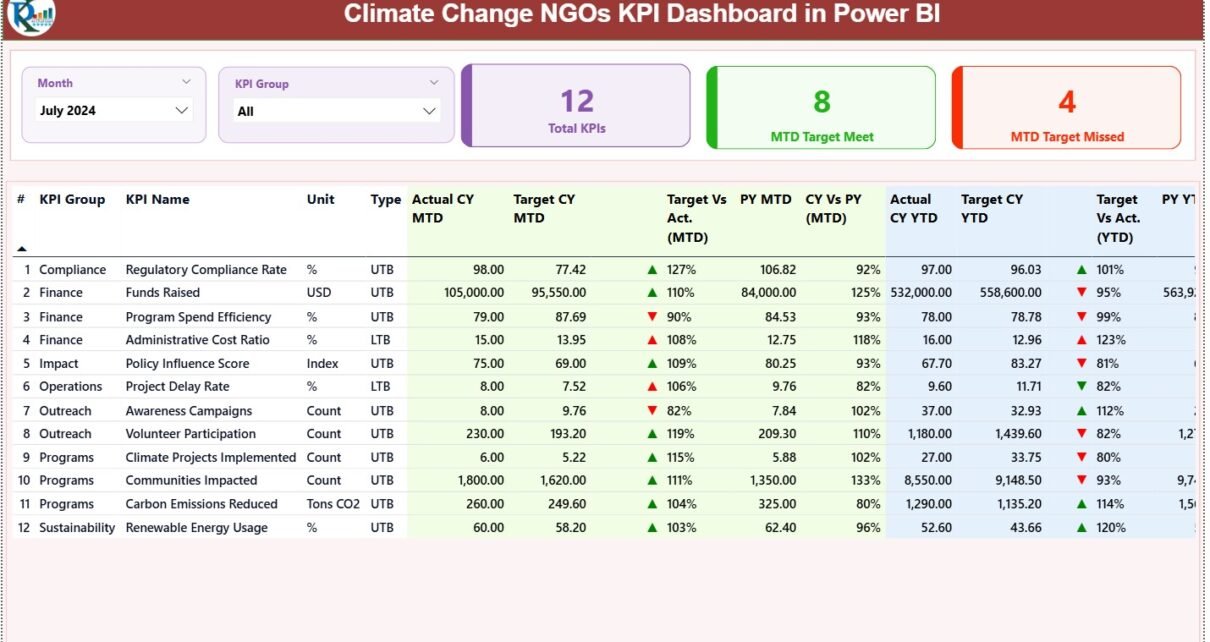
The Summary Page acts as the main overview page of the Climate Change NGOs KPI Dashboard in Power BI.
At the top of the page, you will find:
-
Month slicer for time-based analysis
-
KPI Group slicer for category-wise filtering
KPI Summary Cards
The dashboard displays three high-level KPI cards:
-
Total KPIs Count
-
MTD Target Met Count
-
MTD Target Missed Count
These cards instantly show overall performance status.
What Details Does the Summary Table Include?
Below the cards, the dashboard displays a detailed KPI table with the following columns:
-
KPI Number – Sequential identifier for each KPI
-
KPI Group – Category of the KPI (e.g., Impact, Funding, Outreach)
-
KPI Name – Name of the performance metric
-
Unit – Unit of measurement
-
Type – LTB (Lower the Better) or UTB (Upper the Better)
How Does MTD Performance Tracking Work?
For Month-to-Date analysis, the dashboard shows:
-
Actual CY MTD – Current year actual MTD value
-
Target CY MTD – Target MTD value
-
MTD Icon – ▲ or ▼ with green/red color
-
Target vs Actual (MTD) – Percentage comparison
-
PY MTD – Previous year MTD value
-
CY vs PY (MTD) – Growth comparison percentage
Because of conditional icons, users can instantly identify KPIs that meet or miss targets.
Click to Purchases Climate Change NGOs KPI Dashboard in Power BI
How Does YTD Performance Tracking Work?
For Year-to-Date analysis, the dashboard shows:
-
Actual CY YTD – Current year actual YTD value
-
Target CY YTD – Target YTD value
-
YTD Icon – ▲ or ▼ for performance status
-
Target vs Actual (YTD) – Percentage achievement
-
PY YTD – Previous year YTD value
-
CY vs PY (YTD) – Year-over-year comparison
As a result, NGOs can track long-term progress with confidence.
What Is the KPI Trend Page and Why Is It Important?
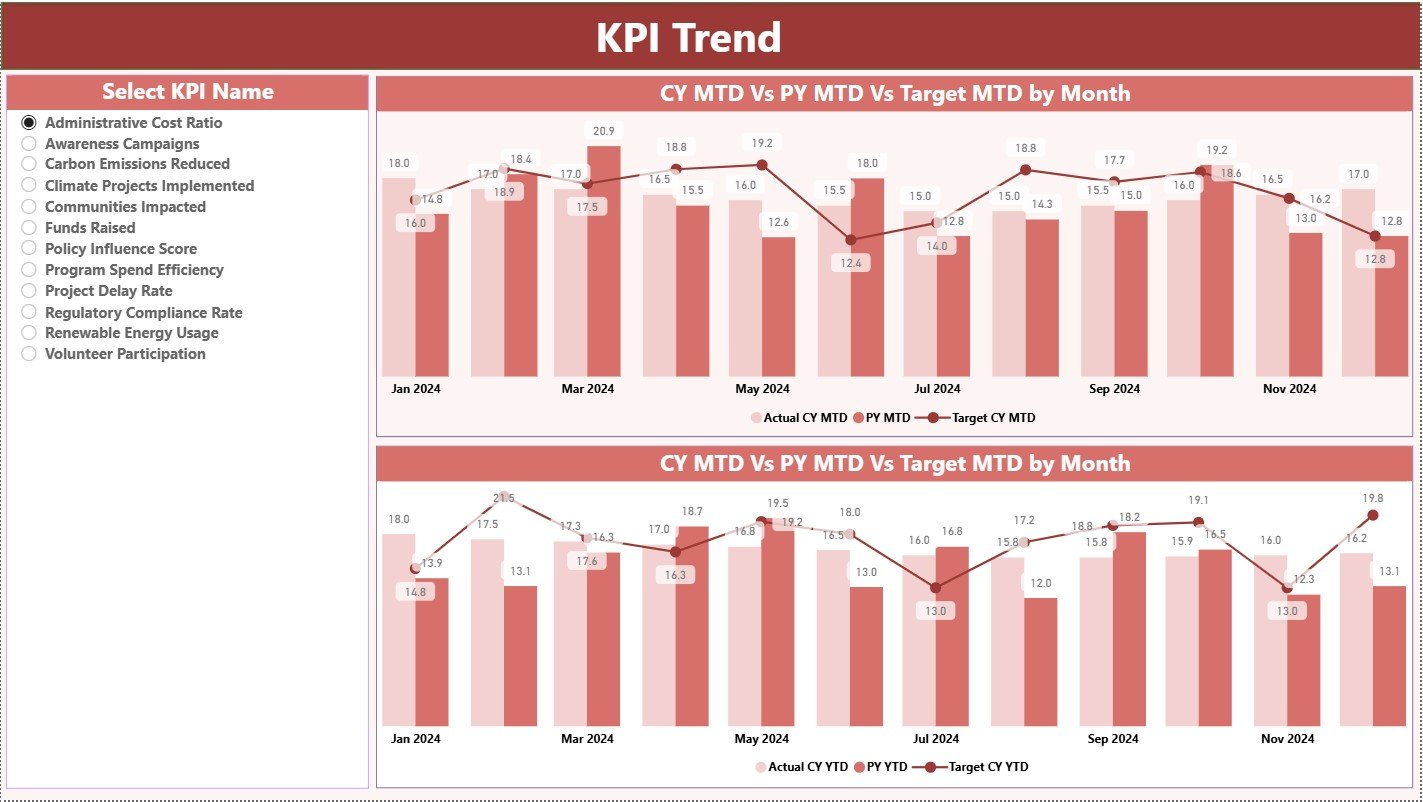
The KPI Trend Page helps NGOs analyze performance trends over time.
-
KPI Name slicer on the left
-
Two interactive combo charts
What Do the Charts Show?
The dashboard displays:
-
MTD trend chart – Actual, Target, and Previous Year
-
YTD trend chart – Actual, Target, and Previous Year
Because these charts show performance movement over time, NGOs can:
-
Identify improving KPIs
-
Detect declining trends early
-
Adjust strategies proactively
What Is the KPI Definition Page?
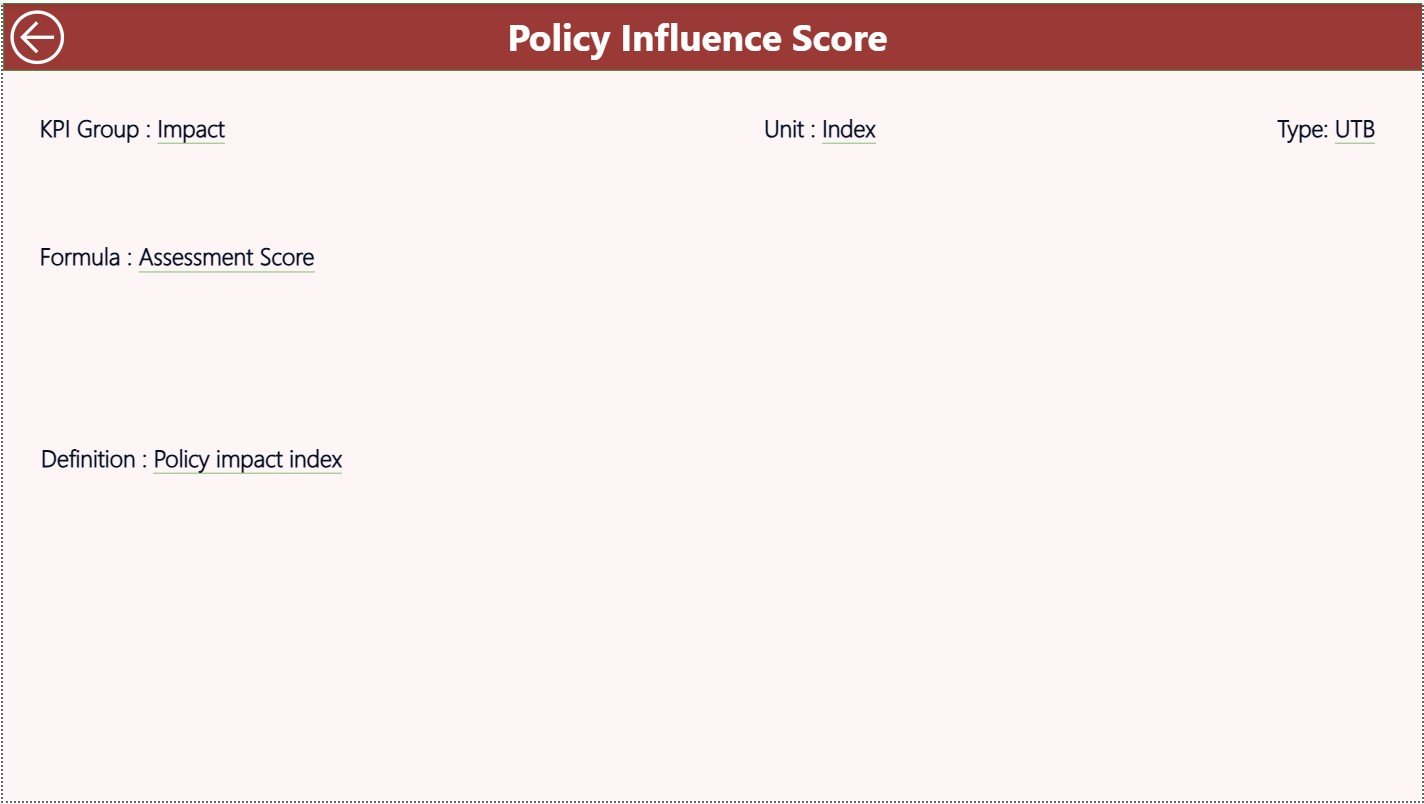
The KPI Definition Page is a hidden drill-through page.
Purpose of This Page
From the Summary Page, users can drill through to view:
-
KPI Formula
-
KPI Definition
-
KPI Logic
This page improves data transparency and audit readiness, especially for donor reporting.
To return to the main page, users simply click the Back button on the top-left corner.
What Excel Data Is Required for This Dashboard?
Click to Purchases Climate Change NGOs KPI Dashboard in Power BI
The data source for this Power BI dashboard is an Excel file with three structured worksheets.
How Does the Input_Actual Sheet Work?
In the Input_Actual sheet, users enter:
-
KPI Name
-
Month (first date of the month)
-
Actual MTD value
-
Actual YTD value
This sheet captures real performance data.
How Does the Input_Target Sheet Work?
In the Input_Target sheet, users enter:
-
KPI Name
-
Month
-
Target MTD value
-
Target YTD value
This sheet defines planned performance goals.
What Information Goes into the KPI Definition Sheet?
The KPI Definition sheet stores:
-
KPI Number
-
KPI Group
-
KPI Name
-
Unit
-
Formula
-
Definition
-
Type (LTB or UTB)
Because of this structure, Power BI understands KPI logic clearly.
What KPIs Can Climate Change NGOs Track Using This Dashboard?
Climate change NGOs can track KPIs such as:
-
CO₂ emissions reduced
-
Trees planted
-
Renewable energy projects completed
-
Awareness campaigns conducted
-
Funds utilized
-
Beneficiaries reached
-
Volunteer participation
-
Program completion rate
NGOs can customize KPIs based on their mission and programs.
Advantages of Climate Change NGOs KPI Dashboard in Power BI
1. Centralized Performance Monitoring
Track all KPIs in one interactive dashboard.
2. Strong Donor Transparency
Visual reports improve donor trust and reporting clarity.
3. Automated MTD and YTD Calculations
Power BI calculates everything automatically.
4. Easy Impact Communication
Visuals help explain impact to stakeholders clearly.
5. Scalable for Large NGOs
The dashboard supports multiple KPIs and programs.
6. Time-Saving Reporting
Reduce manual reporting effort significantly.
Click to Purchases Climate Change NGOs KPI Dashboard in Power BI
Who Should Use This Power BI Dashboard?
This dashboard suits:
-
Climate change NGOs
-
Environmental nonprofits
-
Sustainability foundations
-
Program managers
-
Monitoring & evaluation teams
-
Donor reporting teams
Best Practices for Climate Change NGOs KPI Dashboard in Power BI
1. Maintain Clean Excel Data
Ensure consistent formats and correct dates.
2. Define Clear KPI Ownership
Assign responsibility for each KPI.
3. Review Performance Monthly
Use MTD insights for quick actions.
4. Focus on Impact-Driven KPIs
Track outcomes, not just activities.
5. Use Trend Analysis Before Decisions
Review KPI Trend Page regularly.
6. Train Teams on KPI Definitions
Ensure everyone understands KPI logic.
Click to Purchases Climate Change NGOs KPI Dashboard in Power BI
How Does This Dashboard Improve Climate Impact Reporting?
This dashboard improves reporting by:
-
Showing measurable results
-
Highlighting progress gaps
-
Supporting evidence-based decisions
-
Strengthening accountability
As a result, NGOs communicate impact with confidence.
Can This Dashboard Be Customized?
Yes, NGOs can customize:
-
KPI groups
-
KPI definitions
-
Targets
-
Reporting periods
Because the dashboard uses Excel and Power BI best practices, customization remains simple.
Conclusion: Why Climate Change NGOs Should Use a KPI Dashboard in Power BI
A Climate Change NGOs KPI Dashboard in Power BI transforms raw data into meaningful insights. Instead of spending time on manual reports, NGOs focus on driving real climate impact.
This dashboard helps organizations:
-
Track performance accurately
-
Improve donor communication
-
Monitor progress against goals
-
Make faster, smarter decisions
For climate-focused organizations, this Power BI dashboard becomes an essential analytics tool.
Click to Purchases Climate Change NGOs KPI Dashboard in Power BI
Frequently Asked Questions (FAQs)
What is a Climate Change NGOs KPI Dashboard in Power BI?
It is an interactive dashboard that tracks NGO performance using Power BI visuals and Excel data.
Do NGOs need Power BI expertise to use this dashboard?
No, basic Power BI knowledge is enough.
Can NGOs add new KPIs?
Yes, KPIs can be added easily through Excel.
Does the dashboard support MTD and YTD analysis?
Yes, it supports both automatically.
Is this dashboard suitable for donor reporting?
Yes, it improves transparency and clarity.
How often should data be updated?
NGOs should update data monthly for best results.
Click to Purchases Climate Change NGOs KPI Dashboard in Power BI
Visit our YouTube channel to learn step-by-step video tutorials