Managing eco-tourism operations requires responsibility, transparency, and constant performance tracking. However, many eco-tourism operators still depend on scattered Excel sheets, manual reports, and delayed summaries. As a result, they struggle to track sustainability goals, financial health, visitor impact, and operational efficiency together.
That is exactly where an Eco-Tourism KPI Dashboard in Excel becomes a powerful and practical solution.
In this detailed guide, you will learn what an Eco-Tourism KPI Dashboard in Excel is, why it matters, how it works, its worksheet-wise structure, advantages, best practices, and common questions. Moreover, the language remains simple, actionable, and business-friendly so you can apply it easily.
Click to buy Eco-Tourism KPI Dashboard in Excel
What Is an Eco-Tourism KPI Dashboard in Excel?
An Eco-Tourism KPI Dashboard in Excel is a ready-to-use performance tracking and analytics tool designed to monitor key indicators related to sustainable tourism. Instead of reviewing multiple files, you can track environmental, financial, operational, and visitor-related KPIs from one centralized dashboard.
Moreover, this dashboard converts raw eco-tourism data into meaningful insights. Therefore, managers, sustainability officers, resort owners, and tourism boards can make informed decisions without technical complexity.
Why Does Eco-Tourism Need KPI Dashboards?
Eco-tourism focuses on sustainability, conservation, and community development. However, without proper tracking, even eco-friendly initiatives can lose direction. Therefore, KPI dashboards play a critical role.
Key Reasons Eco-Tourism Needs KPI Tracking
- You must track environmental impact alongside revenue
- You need to measure visitor trends without harming ecosystems
- You should monitor sustainability goals consistently
- You want transparency for stakeholders and regulators
As a result, an Eco-Tourism KPI Dashboard in Excel helps balance profitability and sustainability effectively.
How Does an Eco-Tourism KPI Dashboard in Excel Work?
This dashboard works on a simple and flexible Excel-based structure. You only enter data once, and the dashboard updates automatically.
Here is how it functions step by step:
- You enter actual performance data monthly
- You define targets for each KPI
- You add previous year values for comparison
- Excel formulas calculate MTD and YTD performance
- The dashboard visually compares Actual vs Target and Actual vs PY
Consequently, you gain complete control over eco-tourism performance with minimal effort.
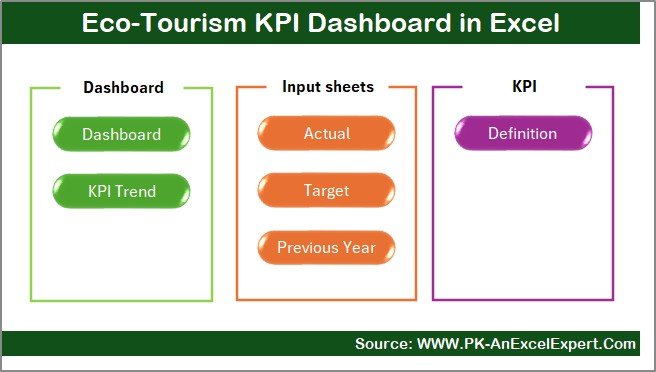
What Worksheets Are Included in the Eco-Tourism KPI Dashboard in Excel?
This Eco-Tourism KPI Dashboard contains 7 well-structured worksheets, each serving a specific purpose.
Summary Page
The Summary Page acts as an index and navigation hub.
Key Features of the Summary Page
- Acts as the landing page of the dashboard
- Includes 6 interactive buttons
- Allows one-click navigation to all major sheets
- Improves usability and saves time
Therefore, users can move across the dashboard smoothly without scrolling through multiple tabs.
Click to buy Eco-Tourism KPI Dashboard in Excel
Dashboard Sheet
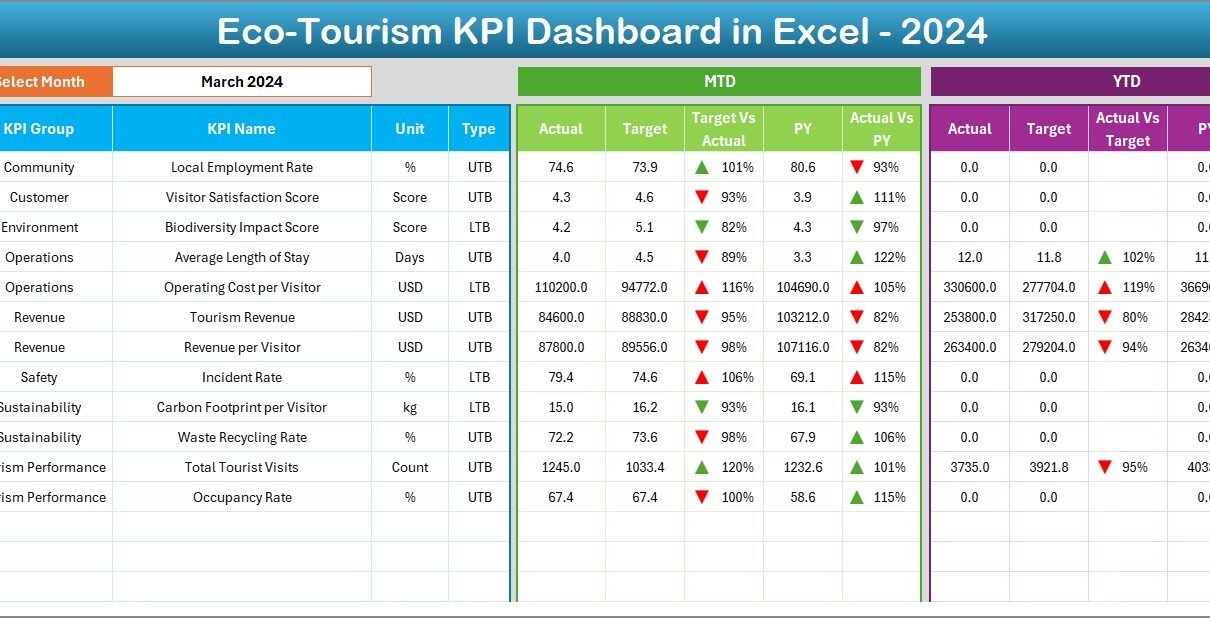
The Dashboard Sheet serves as the main performance view.
Key Highlights of the Dashboard Sheet
- Month selection drop-down at cell D3
- Automatic update of all KPIs based on selected month
- Clear display of MTD and YTD metrics
KPIs Displayed on This Sheet
- MTD Actual vs Target
- MTD Actual vs Previous Year
- YTD Actual vs Target
- YTD Actual vs Previous Year
Moreover, the dashboard uses conditional formatting arrows to show upward or downward trends. As a result, performance gaps become visible instantly.

Click to buy Eco-Tourism KPI Dashboard in Excel
Trend Sheet
The Trend Sheet focuses on individual KPI analysis.
What Can You Do on the Trend Sheet?
- Select KPI Name from drop-down at cell C3
- View KPI Group and KPI Unit
- Understand KPI Type (Upper the Better or Lower the Better)
- Read KPI Formula and Definition
Visual Insights Provided
- MTD trend chart for Actual, Target, and PY
- YTD trend chart for Actual, Target, and PY
Consequently, this sheet helps analyze long-term sustainability trends clearly.

Click to buy Eco-Tourism KPI Dashboard in Excel
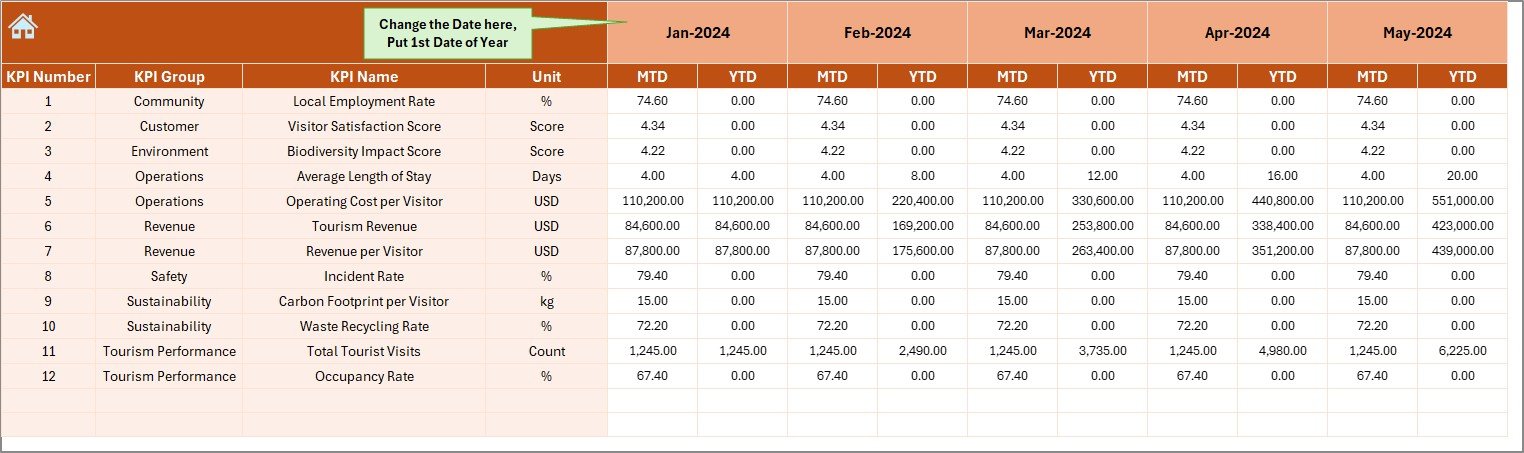
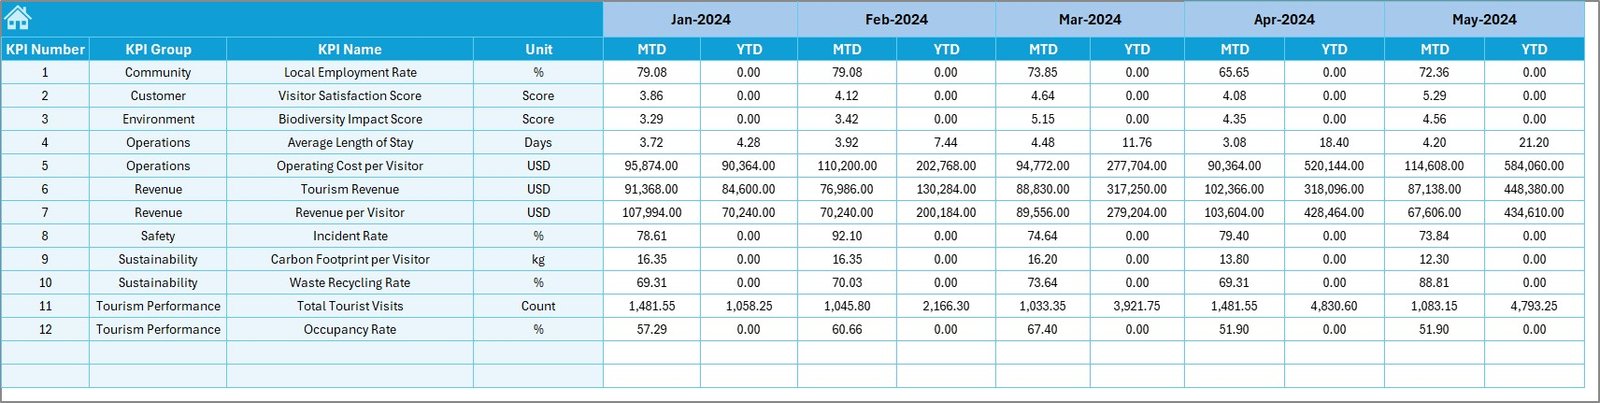
Actual Numbers Input Sheet
The Actual Numbers Input Sheet captures real performance data.
How This Sheet Works
- Enter actual MTD and YTD values
- Select the first month of the year in cell E1
- Change month dynamically without altering formulas
As a result, data entry remains structured, controlled, and error-free.
Click to buy Eco-Tourism KPI Dashboard in Excel
Target Sheet
The Target Sheet defines expected performance benchmarks.
Key Benefits of the Target Sheet
- Enter monthly MTD targets
- Enter cumulative YTD targets
- Set sustainability and business goals clearly
Therefore, you can compare actual eco-tourism performance against planned objectives effectively.
Click to buy Eco-Tourism KPI Dashboard in Excel
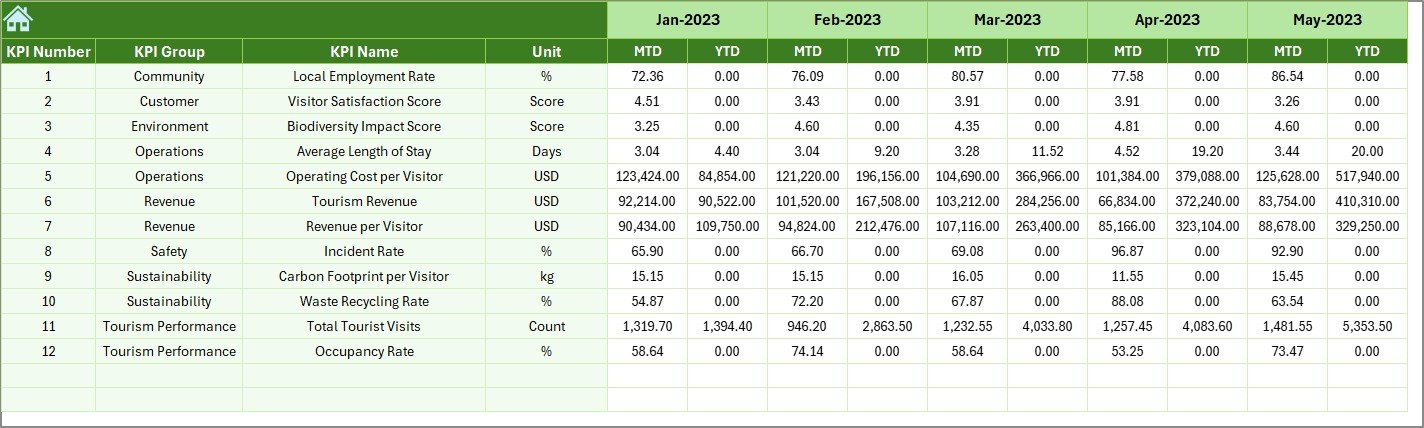
Previous Year Numbers Sheet
The Previous Year Numbers Sheet stores historical data.
Why This Sheet Matters
- Enables year-over-year comparison
- Highlights growth or decline patterns
- Supports long-term sustainability evaluation
As a result, decision-makers gain valuable historical context.
Click to buy Eco-Tourism KPI Dashboard in Excel
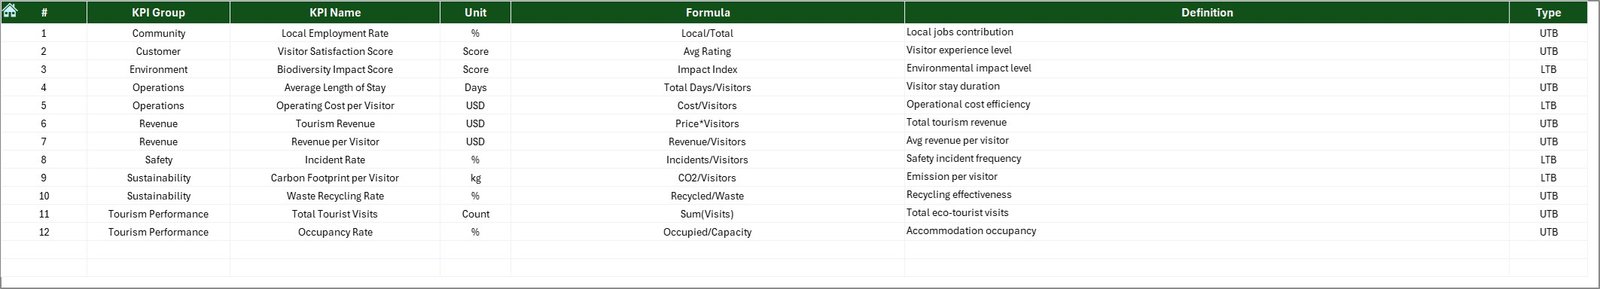
KPI Definition Sheet
The KPI Definition Sheet acts as the knowledge base.
Information Stored in This Sheet
- KPI Name
- KPI Group
- Unit of Measurement
- KPI Formula
- KPI Definition
Therefore, even new users can understand KPIs without confusion.
Click to buy Eco-Tourism KPI Dashboard in Excel
What KPIs Can You Track in an Eco-Tourism KPI Dashboard?
You can customize this dashboard to track multiple eco-tourism metrics.
Common Eco-Tourism KPIs
- Energy Consumption per Visitor
- Water Usage Efficiency
- Waste Recycling Rate
- Carbon Footprint per Trip
- Occupancy Rate
- Revenue per Visitor
- Community Employment Ratio
- Conservation Investment Percentage
Moreover, Excel allows easy expansion as your eco-tourism program grows.
Advantages of an Eco-Tourism KPI Dashboard in Excel
An Eco-Tourism KPI Dashboard in Excel delivers practical and strategic advantages.
Sustainability Advantages
- Tracks environmental impact clearly
- Supports eco-friendly decision-making
- Aligns tourism with conservation goals
Operational Advantages
- Centralizes all KPI data
- Reduces manual reporting effort
- Improves accuracy and consistency
Financial Advantages
- Monitors revenue and cost KPIs
- Identifies profitable eco-tourism initiatives
- Improves budget planning
Strategic Advantages
- Supports long-term planning
- Improves stakeholder transparency
- Enables data-driven sustainability reporting
As a result, organizations achieve balanced growth and responsibility.
Who Should Use an Eco-Tourism KPI Dashboard in Excel?
This dashboard suits a wide range of users.
Ideal Users
- Eco-resort owners
- Sustainable travel agencies
- Wildlife tourism operators
- Community-based tourism groups
- Environmental NGOs
- Tourism boards and authorities
Therefore, anyone involved in sustainable tourism management can benefit.
Best Practices for the Eco-Tourism KPI Dashboard in Excel
Following best practices ensures long-term success.
Standardize KPI Definitions
Always define KPIs clearly in the KPI Definition Sheet. This approach avoids misinterpretation.
Update Data Monthly
Regular updates keep insights relevant. Therefore, schedule monthly data entry routines.
Review Trends, Not Just Numbers
Always analyze MTD and YTD trends instead of focusing on single values.
Align KPIs With Sustainability Goals
Ensure KPIs reflect environmental, social, and economic objectives.
Use Conditional Formatting Wisely
Clear arrows and colors improve readability. However, avoid excessive formatting.
Train Users Properly
Basic Excel training helps users understand dashboard logic easily.
How Does This Dashboard Support Sustainable Tourism Goals?
This dashboard aligns business performance with sustainability principles.
- It tracks resource usage
- It monitors community benefits
- It evaluates financial viability
- It promotes transparency
Consequently, eco-tourism organizations can grow responsibly without harming ecosystems.
Can You Customize the Eco-Tourism KPI Dashboard in Excel?
Yes, Excel allows full customization.
Customization Options
- Add or remove KPIs
- Modify formulas
- Change charts and visuals
- Apply branding colors
- Extend analysis periods
Therefore, the dashboard adapts to any eco-tourism model.
How Does Excel Make KPI Dashboards Easy to Use?
Excel remains accessible and flexible.
- No advanced software required
- Works offline
- Easy data entry
- Powerful formulas and charts
As a result, Excel remains ideal for eco-tourism KPI management.
Conclusion: Why Should You Use an Eco-Tourism KPI Dashboard in Excel?
An Eco-Tourism KPI Dashboard in Excel provides a smart, structured, and sustainable way to manage tourism performance. It simplifies KPI tracking, improves transparency, and supports eco-friendly decisions. Moreover, it balances financial growth with environmental responsibility.
Therefore, if you want to manage eco-tourism operations efficiently while protecting nature and communities, this dashboard becomes an essential tool.
Frequently Asked Questions About Eco-Tourism KPI Dashboard in Excel
What is the main purpose of an Eco-Tourism KPI Dashboard in Excel?
The main purpose is to track sustainability, financial, and operational performance in one centralized Excel dashboard.
Can beginners use this Eco-Tourism KPI Dashboard?
Yes, the dashboard uses simple Excel features and clear layouts. Therefore, beginners can use it easily.
How often should I update the dashboard?
You should update it monthly to ensure accurate MTD and YTD insights.
Can I add more KPIs to the dashboard?
Yes, you can easily add more KPIs by extending the KPI Definition, Target, and Actual sheets.
Does this dashboard support year-over-year analysis?
Yes, the Previous Year Numbers sheet enables clear year-over-year comparisons.
Is Excel suitable for sustainability reporting?
Yes, Excel supports structured reporting, trend analysis, and visual dashboards effectively.
Visit our YouTube channel to learn step-by-step video tutorials
Watch the step-by-step video tutorial:
Click to buy Eco-Tourism KPI Dashboard in Excel