In today’s highly competitive outsourcing industry, data decides success or failure. Business Process Outsourcing (BPO) and Knowledge Process Outsourcing (KPO) organizations manage large teams, multiple clients, service-level agreements, and strict performance targets. Therefore, tracking performance manually or using scattered reports no longer works.
That is exactly where an Outsourcing (BPO and KPO) KPI Dashboard in Excel becomes a powerful solution.
In this detailed and practical article, you will learn what an Outsourcing KPI Dashboard in Excel is, why it matters, how it works, its complete sheet-wise structure, advantages, best practices, and frequently asked questions. Moreover, this guide uses simple language, real-world logic, and actionable explanations so you can apply everything immediately.
Click to Purchases Outsourcing (BPO and KPO) KPI Dashboard in Excel
What Is an Outsourcing (BPO and KPO) KPI Dashboard in Excel?
An Outsourcing (BPO and KPO) KPI Dashboard in Excel is a ready-to-use, interactive reporting tool designed to track, analyze, and monitor key performance indicators related to outsourcing operations.
Instead of reviewing multiple reports for productivity, quality, cost, and service levels, this Excel-based dashboard consolidates all critical KPIs into one centralized view. As a result, managers gain instant visibility into performance trends, gaps, and improvement areas.
Most importantly, Excel makes this dashboard affordable, flexible, and easy to customize for different BPO and KPO environments.
Why Do BPO and KPO Organizations Need a KPI Dashboard?
Outsourcing businesses operate in a fast-paced environment. At the same time, clients expect consistent quality, high productivity, and strict adherence to SLAs. Therefore, decision-makers need real-time insights, not delayed reports.
Here is why a KPI Dashboard in Excel becomes essential:
-
It tracks operational performance across teams and processes
-
It monitors service quality and compliance
-
It compares actual vs target performance
-
It highlights month-to-date (MTD) and year-to-date (YTD) trends
-
It supports data-driven decision-making
Without a dashboard, managers often rely on assumptions. However, with a KPI dashboard, they rely on facts.
What KPIs Are Commonly Tracked in a BPO and KPO Dashboard?
Before understanding the dashboard structure, it helps to know the common KPIs used in outsourcing operations.
Operational KPIs
-
Productivity per FTE
-
Average Handling Time (AHT)
-
Turnaround Time (TAT)
-
Utilization Rate
-
Volume Processed
Quality KPIs
-
Quality Score %
-
Error Rate
-
Rework Percentage
-
First Call Resolution (FCR)
Financial KPIs
-
Cost per Transaction
-
Revenue per FTE
-
Billing Accuracy
-
Margin %
Service-Level KPIs
-
SLA Compliance %
-
On-Time Delivery %
-
Escalation Rate
This dashboard structure supports all these KPIs in a scalable and organized manner.
Click to Purchases Outsourcing (BPO and KPO) KPI Dashboard in Excel
How Does an Outsourcing KPI Dashboard in Excel Work?
An Outsourcing KPI Dashboard in Excel works by separating data input, definitions, and analysis into structured worksheets. As a result, users can enter data easily while managers focus only on insights.
Moreover, the dashboard automatically calculates variances, trends, and indicators using Excel formulas and conditional formatting.
Once you update the data, the dashboard updates instantly.
Click to Purchases Outsourcing (BPO and KPO) KPI Dashboard in Excel
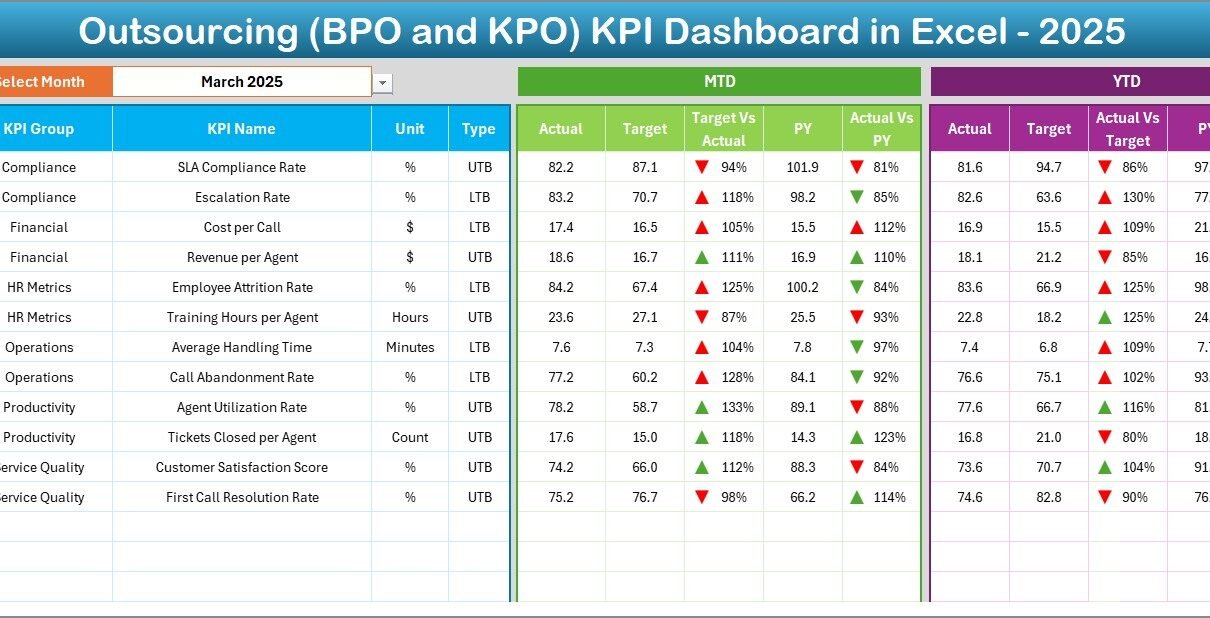
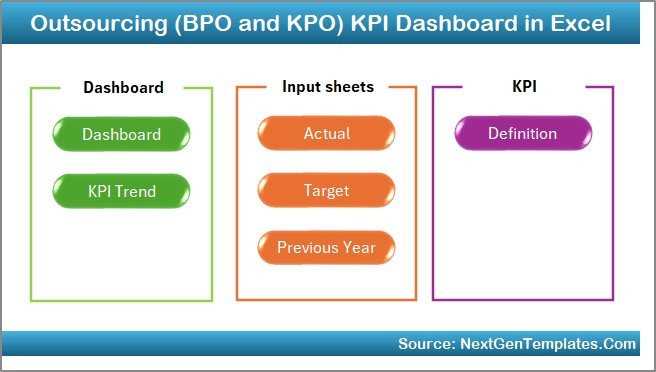
What Is the Sheet-Wise Structure of the Outsourcing KPI Dashboard in Excel?
This ready-to-use Outsourcing KPI Dashboard in Excel consists of 7 well-structured worksheets. Each sheet plays a specific role and ensures clarity, accuracy, and usability.
Let us understand each worksheet in detail.
1. What Is the Home Sheet in the Outsourcing KPI Dashboard?
The Home Sheet acts as the index or navigation page of the dashboard.
Key Features of the Home Sheet
-
It contains 6 navigation buttons
-
Each button links to a specific worksheet
-
It improves user experience and usability
-
It allows quick movement across the dashboard
As a result, users do not waste time searching for sheets. Instead, they access everything with a single click.
2. What Is the Dashboard Sheet and How Does It Work?
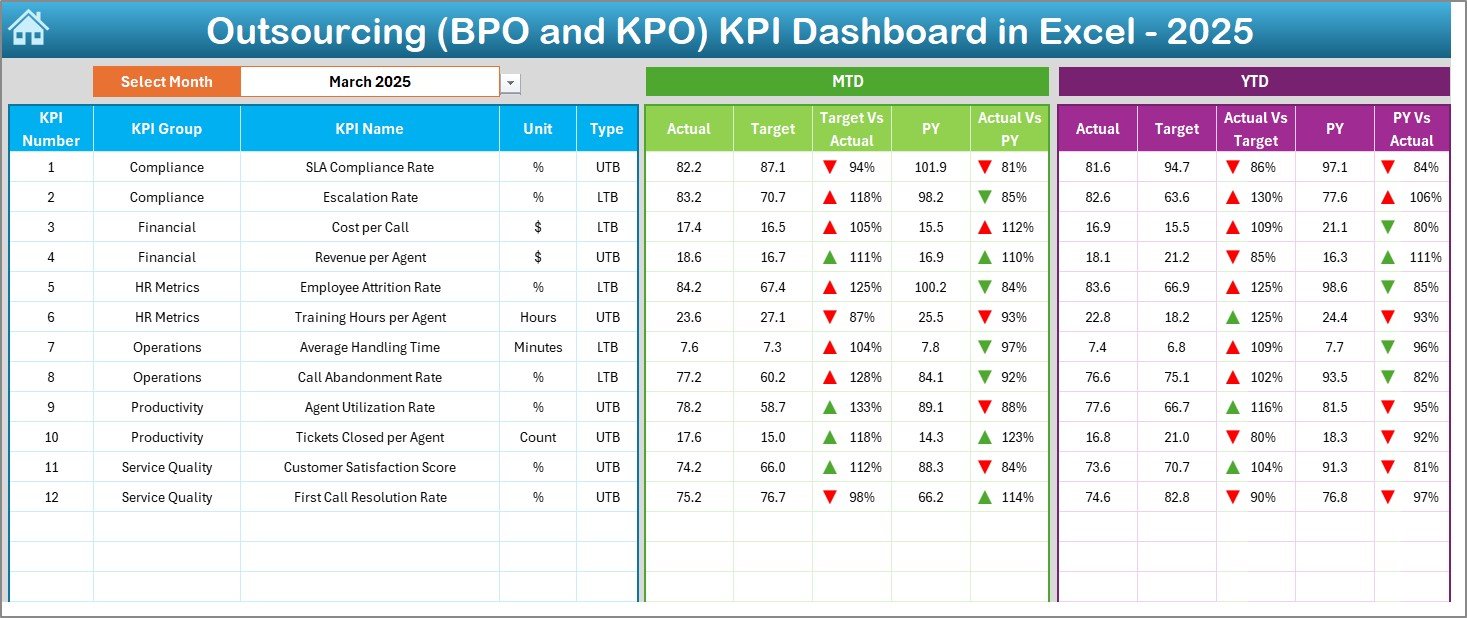
The Dashboard Sheet is the core of the entire KPI dashboard.
Key Highlights of the Dashboard Sheet
-
It displays all KPIs in one consolidated view
-
A Month Selector is available in cell D3
-
Selecting a month automatically updates the entire dashboard
KPIs Displayed on the Dashboard
For each KPI, the dashboard shows:
Month-to-Date (MTD)
-
Actual
-
Target
-
Previous Year
Year-to-Date (YTD)
-
Actual
-
Target
-
Previous Year
Performance Comparison
-
Target vs Actual comparison
-
Previous Year vs Actual comparison
Visual Indicators
-
Conditional formatting up and down arrows
-
Green arrows indicate positive performance
-
Red arrows indicate negative performance
Because of this design, decision-makers instantly identify underperforming KPIs.
Click to Purchases Outsourcing (BPO and KPO) KPI Dashboard in Excel
3. What Is the KPI Trend Sheet and Why Is It Important?
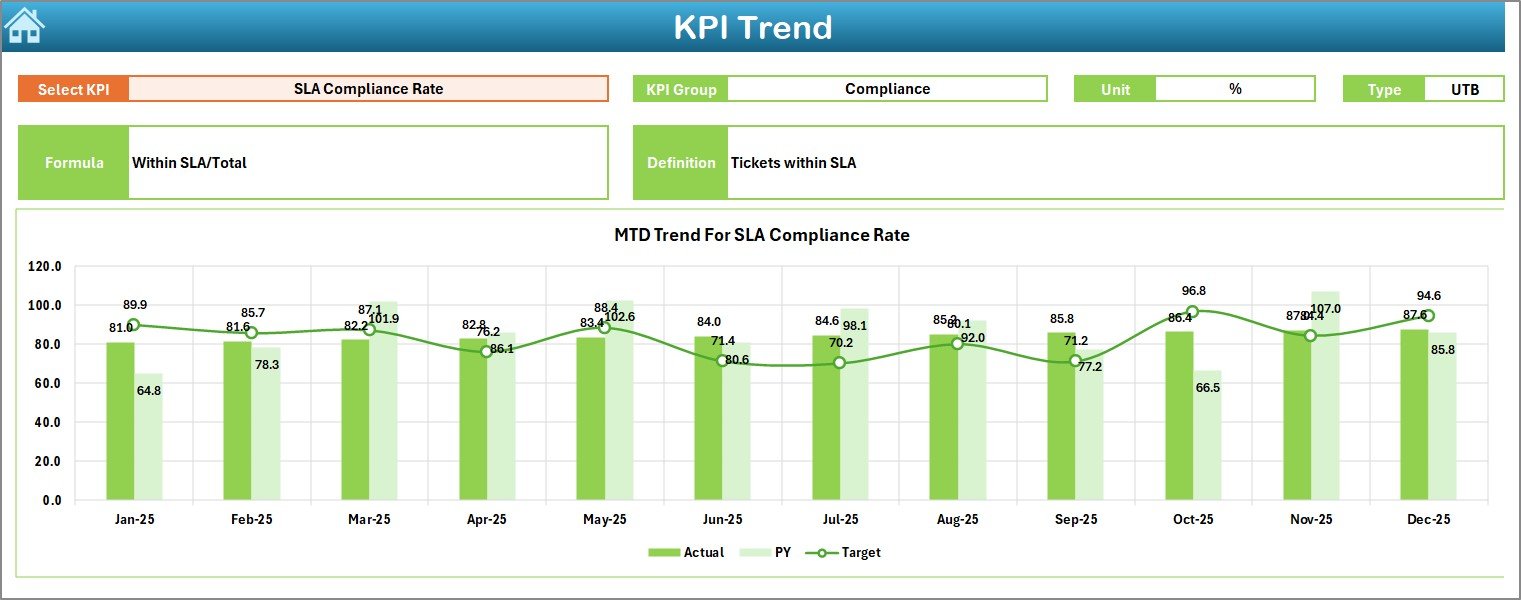
The KPI Trend Sheet focuses on in-depth KPI analysis.
How the KPI Trend Sheet Works
-
You select a KPI Name from a dropdown in cell C3
-
The sheet dynamically updates based on the selected KPI
Information Displayed
-
KPI Group
-
Unit of Measurement
-
KPI Type (Lower the Better or Upper the Better)
-
KPI Formula
-
KPI Definition
Trend Analysis
-
MTD trend chart for Actual, Target, and Previous Year
-
YTD trend chart for Actual, Target, and Previous Year
As a result, managers understand not only current performance but also historical trends.
4. What Is the Actual Numbers Input Sheet?
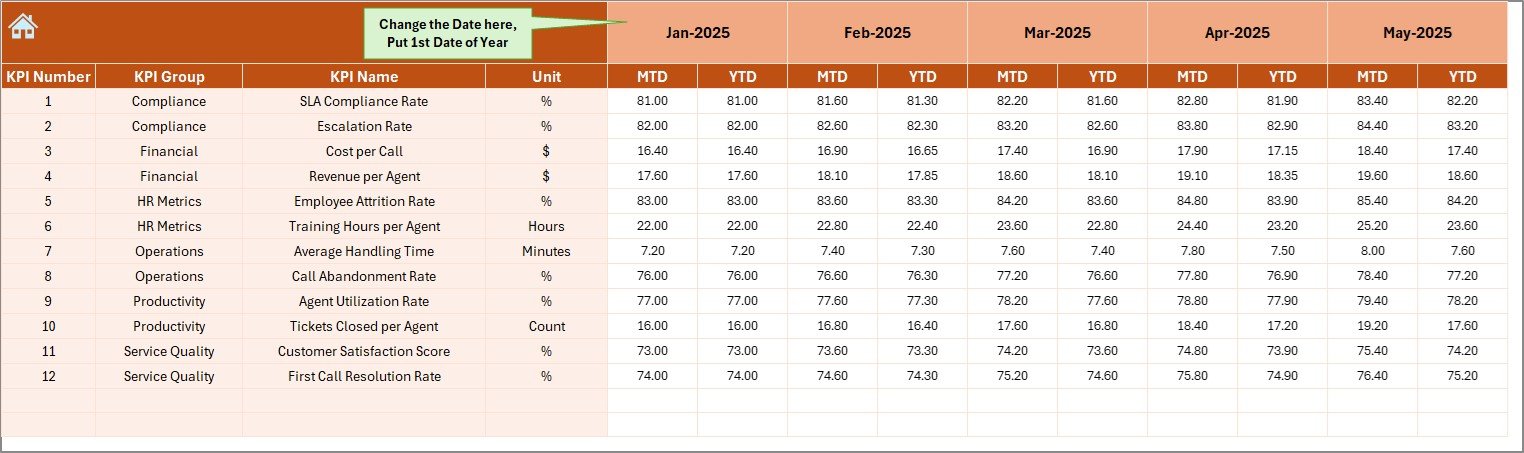
The Actual Numbers Input Sheet serves as the primary data entry point for current-year performance.
Key Features
-
Users enter MTD and YTD actual values
-
Month selection is available in cell E1
-
You enter the first month of the year in cell E1
-
All calculations adjust automatically based on month selection
This design reduces manual errors and ensures consistency across reports.
Click to Purchases Outsourcing (BPO and KPO) KPI Dashboard in Excel
5. What Is the Target Sheet and How Is It Used?

The Target Sheet stores planned performance values.
Key Details
-
Enter monthly MTD targets
-
Enter cumulative YTD targets
-
Targets align with KPIs defined in the KPI Definition sheet
Because targets remain separate from actual data, the dashboard maintains clean logic and easy updates.
6. What Is the Previous Year Number Sheet?

The Previous Year Number Sheet captures historical data.
Why This Sheet Matters
-
Enables year-over-year comparison
-
Helps identify growth, decline, or stability
-
Supports trend and benchmark analysis
You enter data in the same format as the current year, ensuring accurate comparisons.
7. What Is the KPI Definition Sheet?
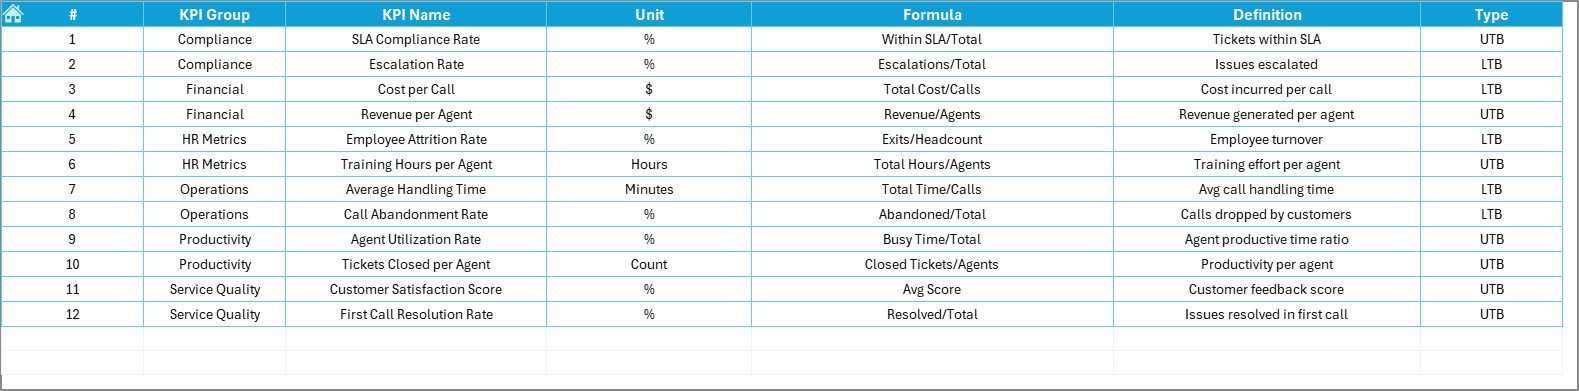
The KPI Definition Sheet acts as the foundation of the entire dashboard.
Information Stored
-
KPI Name
-
KPI Group
-
Unit of Measurement
-
KPI Formula
-
KPI Definition
This sheet ensures everyone interprets KPIs the same way. As a result, confusion and misinterpretation disappear.
Click to Purchases Outsourcing (BPO and KPO) KPI Dashboard in Excel
Advantages of Outsourcing (BPO and KPO) KPI Dashboard in Excel
Using an Outsourcing KPI Dashboard in Excel offers several practical advantages.
1. Centralized Performance Tracking
All KPIs appear in one place. Therefore, managers save time and avoid data silos.
2. Real-Time Insights
As soon as users update data, the dashboard refreshes automatically.
3. Easy Month-to-Date and Year-to-Date Analysis
The built-in MTD and YTD logic simplifies performance tracking.
4. Visual Decision Support
Charts, arrows, and comparisons make insights easy to understand.
5. Cost-Effective Solution
Excel eliminates the need for expensive BI tools for small and mid-sized teams.
6. High Customization
You can add new KPIs, modify targets, or adjust formulas easily.
How Does This Dashboard Support Better Decision-Making?
An Outsourcing KPI Dashboard in Excel supports smarter decisions by:
-
Highlighting SLA risks early
-
Identifying productivity gaps
-
Comparing targets with actuals clearly
-
Tracking improvement initiatives over time
Because of this, leaders act faster and more confidently.
Click to Purchases Outsourcing (BPO and KPO) KPI Dashboard in Excel
Best Practices for the Outsourcing (BPO and KPO) KPI Dashboard in Excel
To get maximum value from your dashboard, follow these best practices.
Keep KPIs Relevant
Select KPIs aligned with business goals and client SLAs.
Update Data Regularly
Daily or weekly updates improve accuracy and relevance.
Maintain Clear KPI Definitions
Always document formulas and definitions clearly.
Use Consistent Units
Avoid mixing percentages, counts, and averages incorrectly.
Review Trends, Not Just Numbers
Trends reveal patterns that single values cannot show.
Train Users
Ensure team members understand how to input and read data.
Common Mistakes to Avoid While Using KPI Dashboards
Even the best dashboards fail if users make these mistakes:
-
Tracking too many KPIs
-
Ignoring data validation
-
Using inconsistent time periods
-
Focusing only on MTD and ignoring YTD trends
-
Failing to review dashboards regularly
Avoiding these mistakes ensures long-term success.
Who Can Use an Outsourcing KPI Dashboard in Excel?
This dashboard benefits multiple roles, such as:
-
BPO and KPO Operations Managers
-
Delivery Managers
-
Quality Managers
-
Finance and Billing Teams
-
Process Excellence Teams
-
Senior Leadership
Each role gains tailored insights from the same dashboard.
How Is Excel Better Than Manual Reports for KPI Tracking?
Manual reports consume time and increase error risks. In contrast, Excel dashboards:
-
Automate calculations
-
Improve data accuracy
-
Save reporting time
-
Provide visual clarity
-
Enable faster decisions
Therefore, Excel dashboards remain a smart choice for outsourcing firms.
Click to Purchases Outsourcing (BPO and KPO) KPI Dashboard in Excel
Conclusion: Why You Should Use an Outsourcing KPI Dashboard in Excel
An Outsourcing (BPO and KPO) KPI Dashboard in Excel transforms raw operational data into actionable insights. It simplifies performance tracking, improves transparency, and supports data-driven decision-making.
Moreover, its structured design, MTD and YTD analysis, trend charts, and visual indicators make it a practical and powerful tool for outsourcing organizations of all sizes.
If you want clarity, control, and confidence in your outsourcing operations, this dashboard becomes an essential asset.
Frequently Asked Questions (FAQs)
What is the main purpose of an Outsourcing KPI Dashboard in Excel?
The main purpose is to track, analyze, and visualize outsourcing performance metrics in one centralized file.
Can small BPO firms use this KPI dashboard?
Yes, small and mid-sized BPO and KPO firms benefit the most because Excel offers flexibility and low cost.
How often should KPI data be updated?
You should update data weekly or monthly, depending on operational needs.
Does this dashboard support SLA monitoring?
Yes, SLA-related KPIs can be tracked easily using target vs actual comparisons.
Can I add more KPIs to the dashboard?
Yes, the dashboard structure supports adding new KPIs with minimal changes.
Is Excel suitable for long-term KPI tracking?
Yes, with proper data management and best practices, Excel supports long-term performance monitoring effectively.
Click to Purchases Outsourcing (BPO and KPO) KPI Dashboard in Excel
Visit our YouTube channel to learn step-by-step video tutorials