Credit unions operate in a unique space within the financial services industry. They focus on members instead of shareholders, prioritize trust, and aim to deliver value-driven financial products. However, despite this member-centric approach, many credit unions still struggle with scattered data, delayed reporting, and limited visibility into performance.
So, how can credit unions make faster, smarter, and more confident decisions?
The answer lies in a Credit Unions Dashboard in Power BI.
This article explains what a Credit Unions Dashboard in Power BI is, why it matters, how it works, and how it supports better decision-making. Additionally, it explores dashboard pages, advantages, best practices, and frequently asked questions—everything you need to know before adopting or building one.
Click to Purchases Credit Unions Dashboard in Power BI
What Is a Credit Unions Dashboard in Power BI?
A Credit Unions Dashboard in Power BI is an interactive data visualization solution designed to track, analyze, and monitor key operational and financial metrics of a credit union in real time.
Instead of relying on static spreadsheets or delayed monthly reports, this dashboard brings all critical metrics into one centralized view. As a result, decision-makers can quickly understand performance trends, identify risks, and act proactively.
Why Power BI for Credit Unions?
Power BI offers flexibility, scalability, and ease of use. Moreover, it connects seamlessly with multiple data sources, which makes it ideal for credit unions that manage member accounts, loans, branches, and products.
Why Do Credit Unions Need a Power BI Dashboard?
Credit unions deal with complex operations every day. They manage accounts, loans, interest rates, branches, cities, and member satisfaction simultaneously. However, without proper analytics, valuable insights remain hidden.
Here is why a Power BI dashboard becomes essential:
-
It centralizes financial and operational data
-
It provides real-time performance visibility
-
It reduces manual reporting efforts
-
It improves member experience through insights
-
It supports compliance and governance needs
Because of these benefits, more credit unions now adopt dashboards as a core decision-support tool.
How Does a Credit Unions Dashboard in Power BI Work?
A Credit Unions Dashboard in Power BI follows a structured data flow:
-
Data Collection
Data flows from core banking systems, loan systems, CRM platforms, and spreadsheets. -
Data Modeling
Power BI cleans, transforms, and models the data using relationships and calculations. -
Visualization
Charts, cards, and slicers present KPIs in a user-friendly format. -
Interaction
Users filter data by branch, city, product type, or month using slicers. -
Decision-Making
Leaders analyze trends and take timely action.
As a result, credit unions gain a single source of truth.
What Are the Key Features of a Credit Unions Dashboard in Power BI?
This Credit Unions Dashboard includes five well-structured pages, each designed to answer specific business questions.
Let’s explore them in detail.
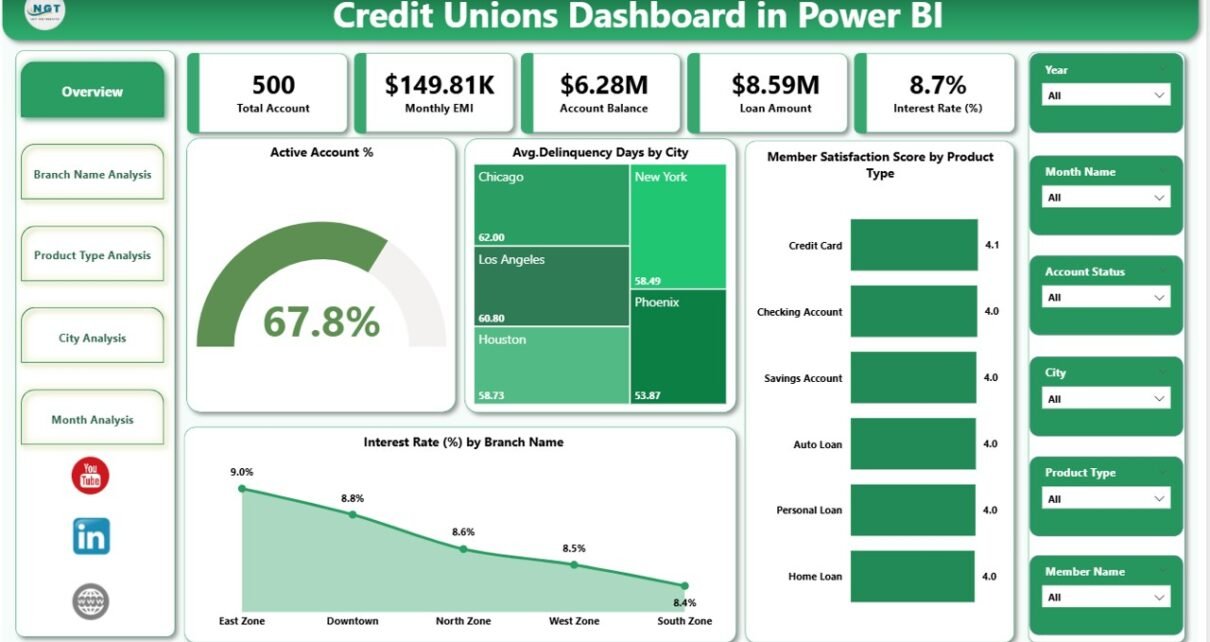
1. Overview Page: What Is the Overall Performance of the Credit Union?
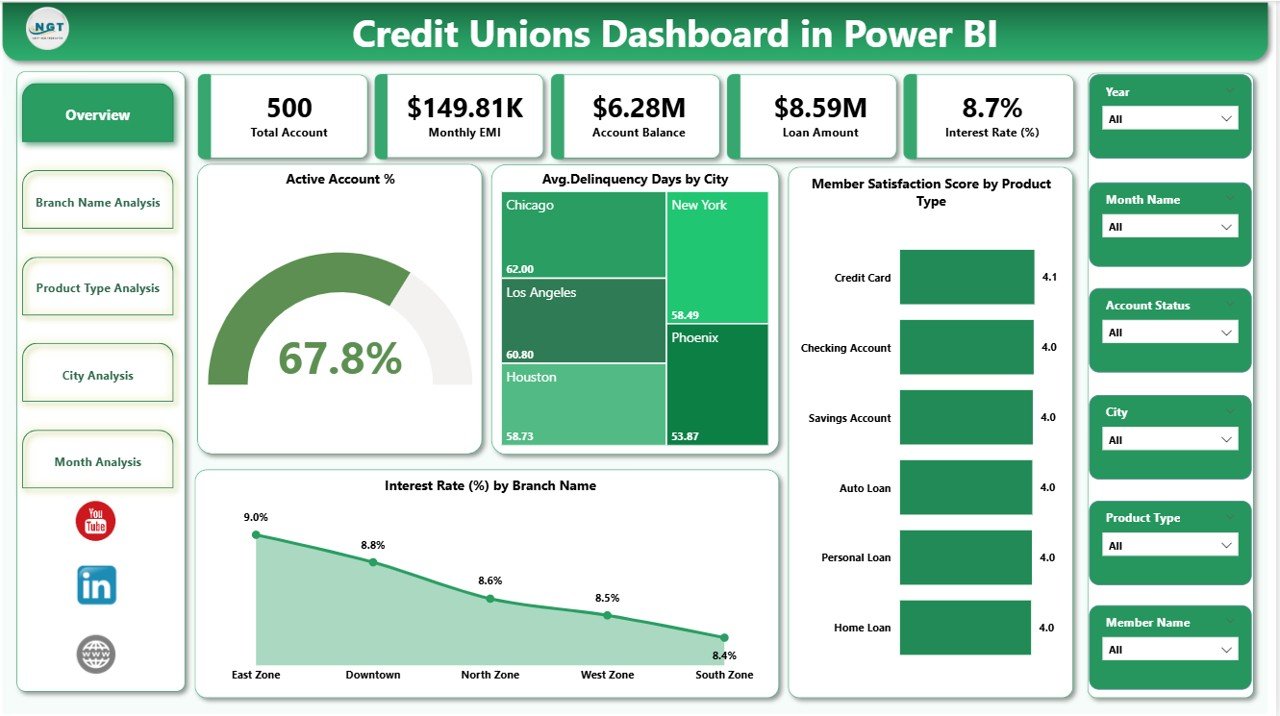
The Overview Page acts as the command center of the dashboard. It provides a high-level snapshot of key performance indicators.
Key KPIs Displayed on the Overview Page
-
Active Account %
Shows the percentage of active member accounts, helping identify engagement levels. -
Average Delinquency Days by City
Highlights credit risk patterns across locations. -
Member Satisfaction Score by Product Type
Measures how members perceive different financial products. -
Interest Rate by Branch Name
Compares interest rates across branches for pricing consistency.
Why This Page Matters
Because leadership teams need quick insights, this page delivers instant clarity. Moreover, slicers allow users to drill down by time, branch, or city.
2. Branch Name Analysis: How Do Branches Perform Against Each Other?
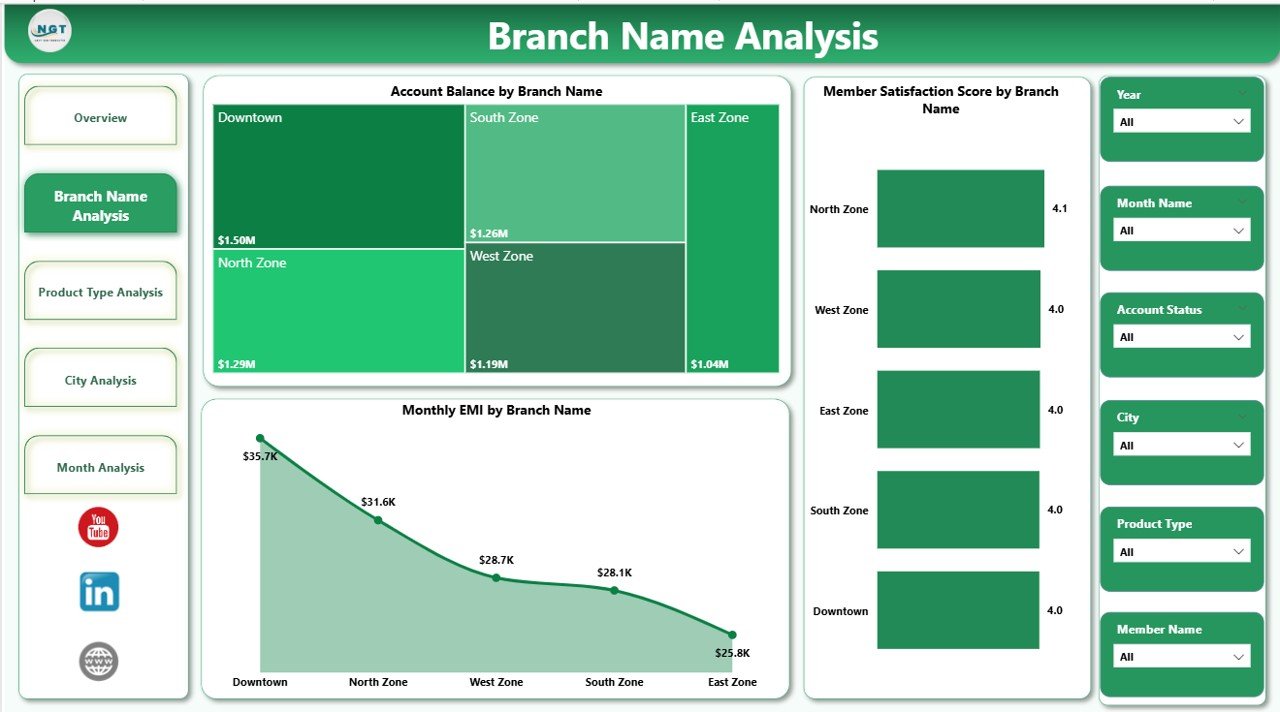
The Branch Name Analysis page focuses on branch-level performance.
Key Visuals on This Page
-
Member Satisfaction Score by Branch Name
Identifies high-performing and underperforming branches. -
Account Balance by Branch Name
Shows where deposits concentrate. -
Monthly EMI by Branch Name
Tracks loan repayment trends across branches.
Business Value
This page helps management compare branches objectively. Consequently, leaders can replicate best practices and address weak areas quickly.
3. Product Type Analysis: Which Products Drive Growth?
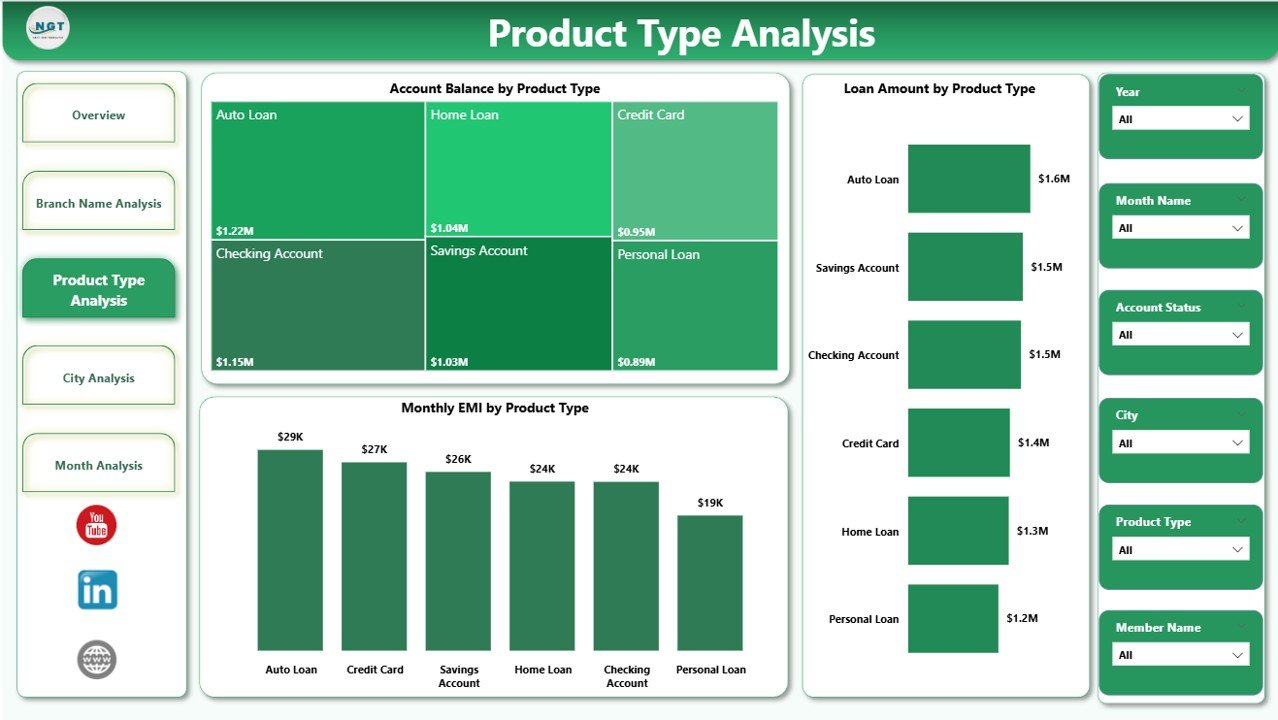
The Product Type Analysis page analyzes performance by product category.
Key Charts Included
-
Account Balance by Product Type
Shows which products hold the highest balances. -
Loan Amount by Product Type
Identifies popular lending products. -
Monthly EMI by Product Type
Highlights repayment behavior across products.
Why Product Insights Matter
Because product strategy drives revenue, this page helps credit unions refine offerings, adjust pricing, and improve member satisfaction.
Click to Purchases Credit Unions Dashboard in Power BI
4. City Analysis: How Does Performance Vary by Location?
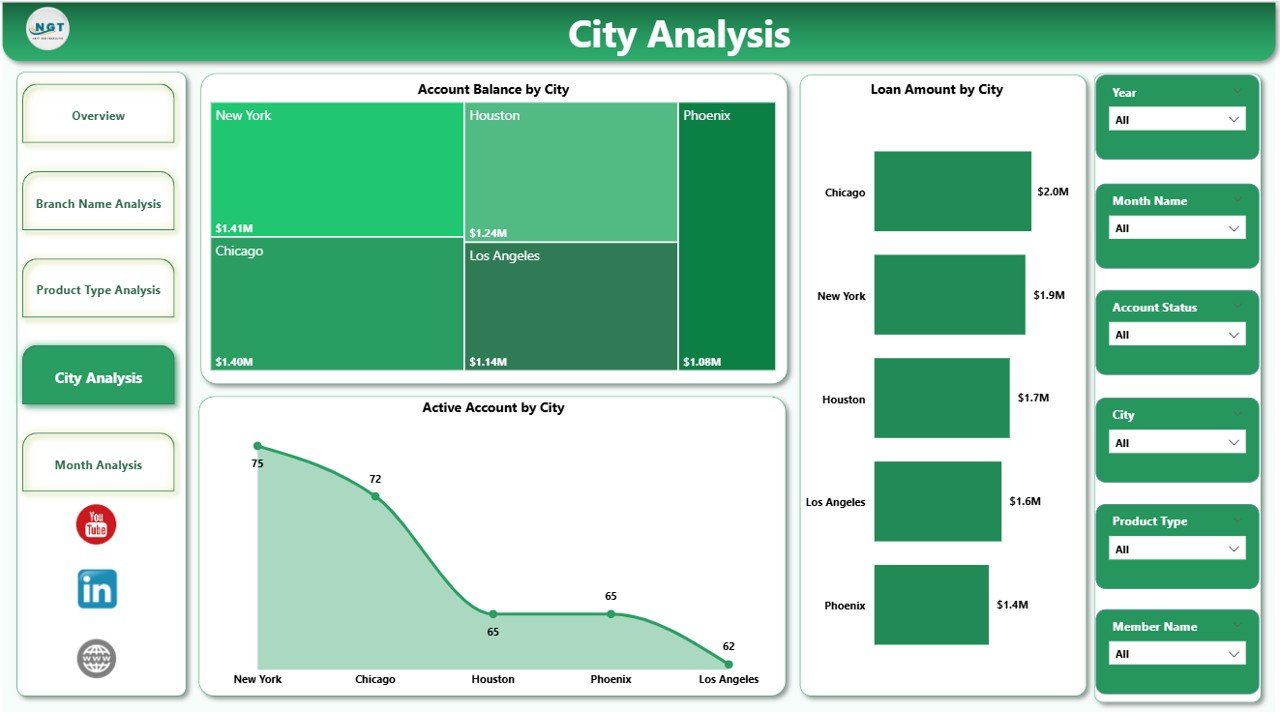
The City Analysis page focuses on geographic performance.
Key Metrics on This Page
-
Account Balance by City
-
Loan Amount by City
-
Monthly EMI by City
Strategic Impact
This analysis reveals regional trends. Therefore, credit unions can optimize branch expansion, marketing campaigns, and credit policies by location.
5. Month Analysis: How Do Trends Change Over Time?
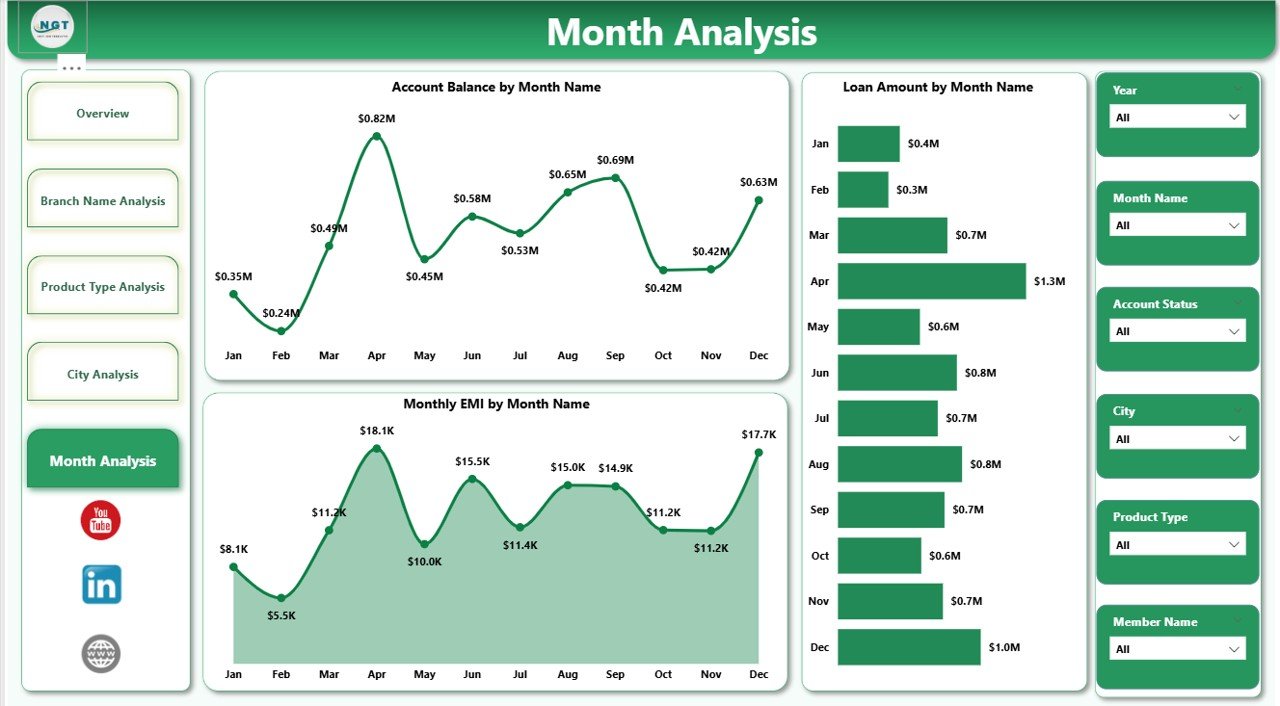
The Month Analysis page tracks time-based trends.
Key Time-Series Visuals
-
Account Balance by Month
-
Loan Amount by Month
-
Monthly EMI by Month
Why Monthly Trends Matter
Because financial performance changes over time, this page helps identify seasonality, growth patterns, and risk cycles.
Advantages of a Credit Unions Dashboard in Power BI
Implementing a Credit Unions Dashboard in Power BI delivers several powerful advantages.
1. Centralized Data Visibility
All critical data appears in one place. As a result, teams no longer depend on scattered reports.
2. Faster Decision-Making
Because insights update in real time, leaders act quickly and confidently.
3. Improved Member Experience
By tracking satisfaction and engagement metrics, credit unions enhance service quality.
4. Better Risk Management
Delinquency and EMI trends highlight early warning signs.
5. Operational Efficiency
Automation reduces manual reporting efforts and errors.
How Does This Dashboard Support Credit Union Leadership?
Leadership teams benefit significantly from this dashboard because it:
-
Aligns strategy with data
-
Improves transparency across departments
-
Encourages data-driven culture
-
Strengthens accountability
Moreover, executives gain instant clarity without diving into raw data.
Best Practices for the Credit Unions Dashboard in Power BI
To maximize value, follow these best practices.
1. Define Clear KPIs
Choose KPIs that align with strategic goals. Avoid unnecessary metrics.
2. Use Consistent Data Sources
Ensure all departments use standardized data definitions.
3. Design for Simplicity
Keep visuals clean and intuitive. Simpler dashboards drive better adoption.
4. Leverage Slicers Effectively
Use slicers for branch, city, product type, and month to enhance exploration.
5. Refresh Data Regularly
Schedule automatic refreshes to maintain accuracy.
Who Can Use a Credit Unions Dashboard in Power BI?
Click to Purchases Credit Unions Dashboard in Power BI
This dashboard supports multiple roles:
-
Credit union executives
-
Branch managers
-
Risk and compliance teams
-
Finance and accounting teams
-
Product managers
-
Data analysts
Because of its flexibility, each role can view insights relevant to them.
How Does a Credit Unions Dashboard Improve Compliance and Governance?
Compliance requires transparency and traceability. This dashboard helps by:
-
Maintaining consistent reporting
-
Tracking risk indicators
-
Supporting audits with visual evidence
-
Reducing data manipulation risks
As a result, credit unions strengthen governance frameworks.
Is a Credit Unions Dashboard in Power BI Scalable?
Yes, scalability remains one of its strongest benefits.
As credit unions grow, the dashboard can:
-
Add new branches and cities
-
Include additional products
-
Integrate more data sources
-
Expand KPIs without redesign
Therefore, it evolves with the organization.
Conclusion: Why Should Credit Unions Adopt a Power BI Dashboard?
A Credit Unions Dashboard in Power BI transforms how credit unions operate, analyze, and grow. It replaces guesswork with clarity, delays with real-time insights, and complexity with simplicity.
By leveraging interactive visuals, structured pages, and powerful analytics, credit unions gain a competitive edge while staying true to their member-focused mission.
In a data-driven financial world, this dashboard does not remain optional—it becomes essential.
Frequently Asked Questions (FAQs)
Click to Purchases Credit Unions Dashboard in Power BI
What is the main purpose of a Credit Unions Dashboard in Power BI?
The main purpose is to provide real-time visibility into financial, operational, and member-related performance metrics.
Can non-technical users use this dashboard easily?
Yes, the dashboard uses intuitive visuals and slicers, which makes it easy for non-technical users to explore data.
How often should data refresh in the dashboard?
Ideally, data should refresh daily or in real time, depending on operational needs.
Can this dashboard integrate with core banking systems?
Yes, Power BI integrates with databases, APIs, and spreadsheets commonly used by credit unions.
Does the dashboard support branch-level comparisons?
Absolutely. Branch Name Analysis allows direct comparison across multiple metrics.
Is Power BI secure for financial data?
Yes, Power BI includes robust security features like role-based access and data encryption.
Can the dashboard expand in the future?
Yes, the dashboard design supports scalability and future enhancements.
Visit our YouTube channel to learn step-by-step video tutorials