The Facilities Management Report in Excel gives facilities teams a single reporting view for every request — tracking 5 KPI cards and 5 analytical charts across 4 sheets, with slicer-based filtering by location, department, and issue type. Setup takes under 10 minutes: replace the sample data on the Data sheet and every card, chart, and slicer refreshes automatically.
🌍 Join 8,400+ teams in 40+ countries using NextGenTemplates to replace paid SaaS tools with one-time-purchase Excel, Google Sheets, Power BI, and HTML templates. Instant download · one-time payment · no subscription.
Key Features of the Facilities Management Report in Excel
This report is purpose-built for facilities teams who already log their requests somewhere — in email, a ticketing tool, or a basic spreadsheet — and need a clean summary layer for leadership. It is not a full CMMS; it is a reporting layer. That distinction matters: it means you get the value in 10 minutes, not 6 weeks of onboarding.
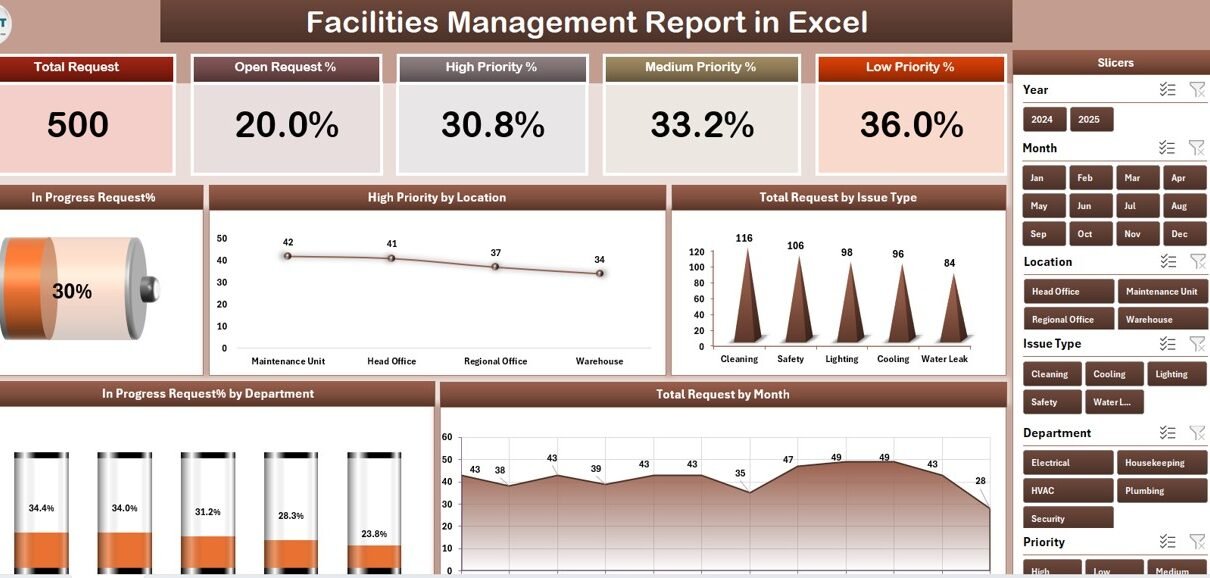
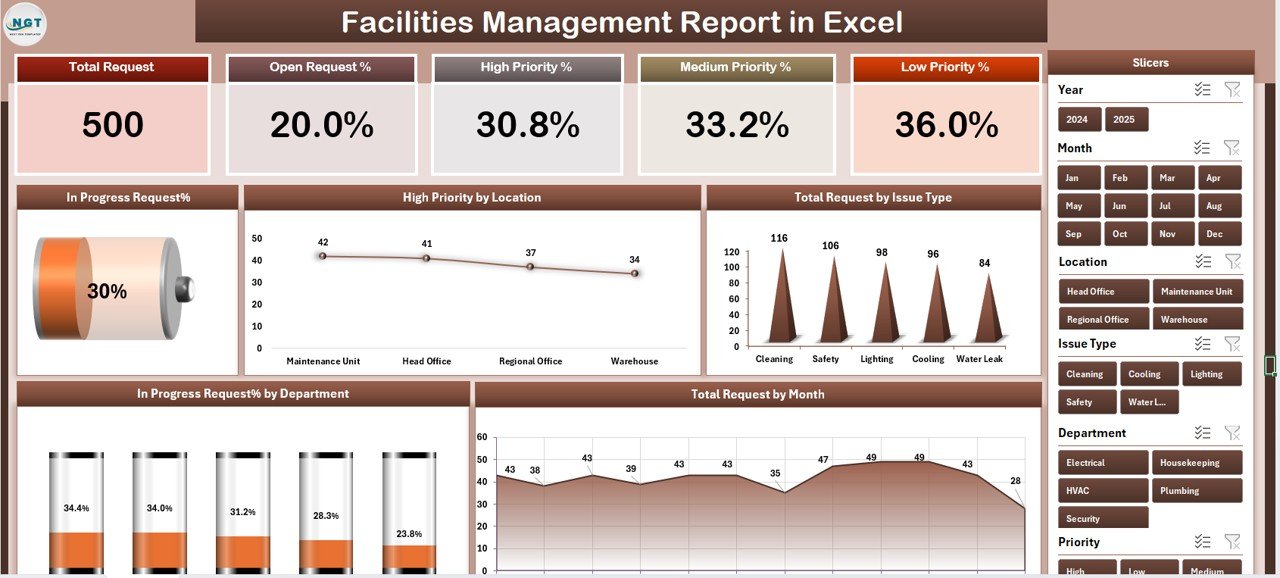
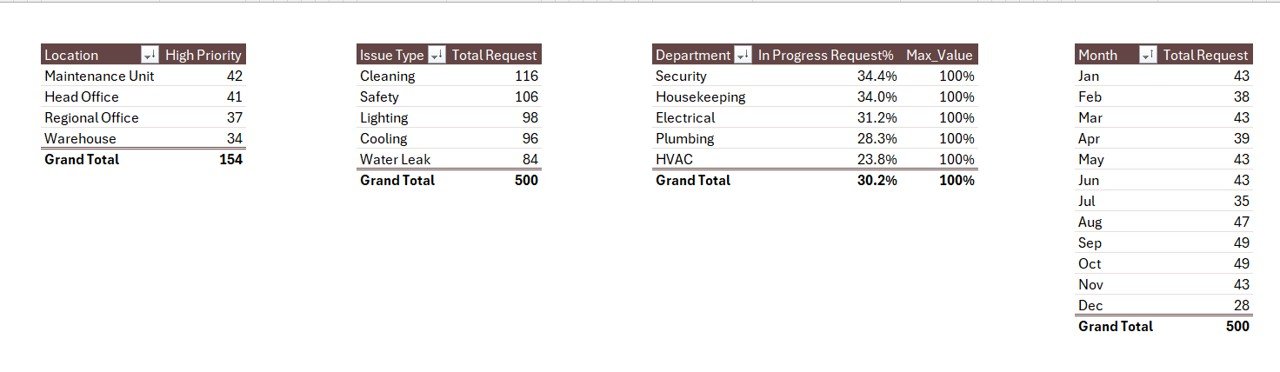
- 5 KPI cards on the Summary page headline the metrics a facility manager reviews first: total requests, in-progress count, high-priority open items, requests by department, and requests by month.
- 5 interactive charts — In Progress Request %, High Priority by Location, Total Request by Issue Type, In Progress % by Department, and Total Request by Month — cover the analytical views used in weekly and monthly reviews.
- Two slicers — right-side slicer on the Summary page, left-side slicer on the Report page — let you filter the entire workbook by location, department, or issue type with a single click.
- A dedicated Report page exposes a line-level Information Table. Use it when a department head wants the full ticket log, not just the roll-up.
- A Data sheet for raw input and a Support sheet for lookup lists (locations, departments, issue types, priorities) keep the rest of the workbook consistent when you add new categories.
- Native Excel — no macros, no VBA, no Power Query, no Power BI. Works in Excel 2016, 2019, 2021, Microsoft 365, and Excel for Mac.
Sheets Explanation — Inside the Facilities Management Report in Excel
1. Summary Page
The Summary page is the entry point and the view your director will see first. Five KPI cards run across the top of the page, giving the single-number readout for total requests, in-progress requests, high-priority requests, requests by department, and requests by month. Below the cards sit the five analytical charts, arranged for a natural reading order.
The right-side slicer pane is the core filtering mechanism. Click a location, a department, or an issue type and every card, every chart, and the related totals recompute. No formula skills are needed — Excel does this natively with slicers connected to the underlying data.
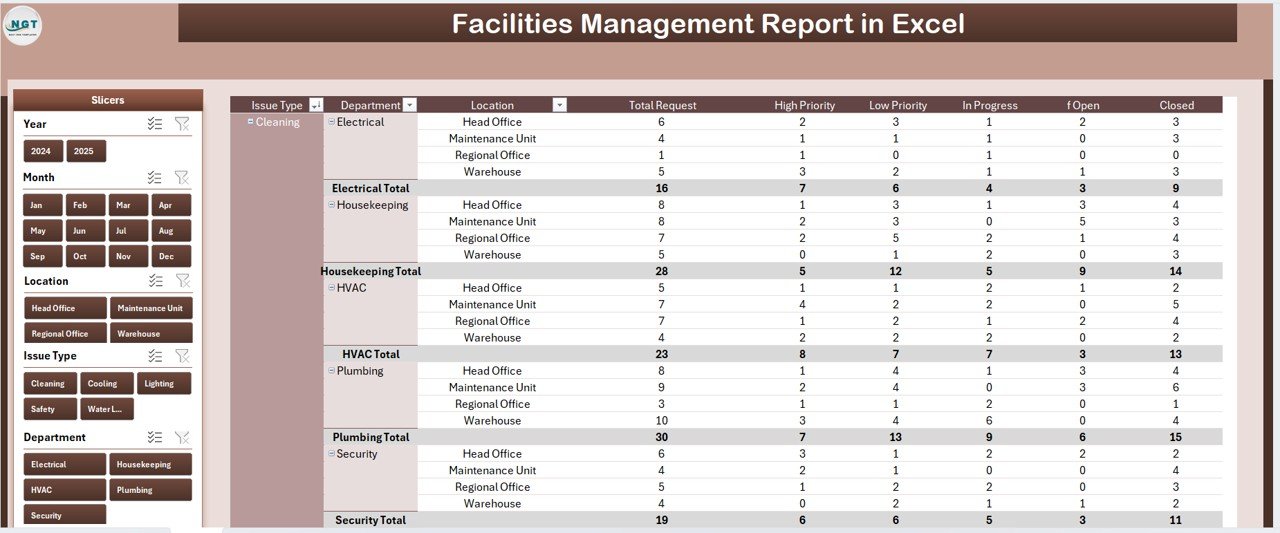
2. Report Page
The Report page is designed for the moment when a department head says “just send me the list.” A left-side slicer sits next to a wide Information Table that shows every individual request — date, request ID, location, department, issue type, priority, status, and any additional fields you add to the Data sheet.
Filter the slicer for, say, “High priority + Warehouse 2” and the Information Table narrows to exactly those rows. Export the filtered view to PDF and you have a share-ready report in under 60 seconds. This is the step that usually replaces a 10-minute email thread.
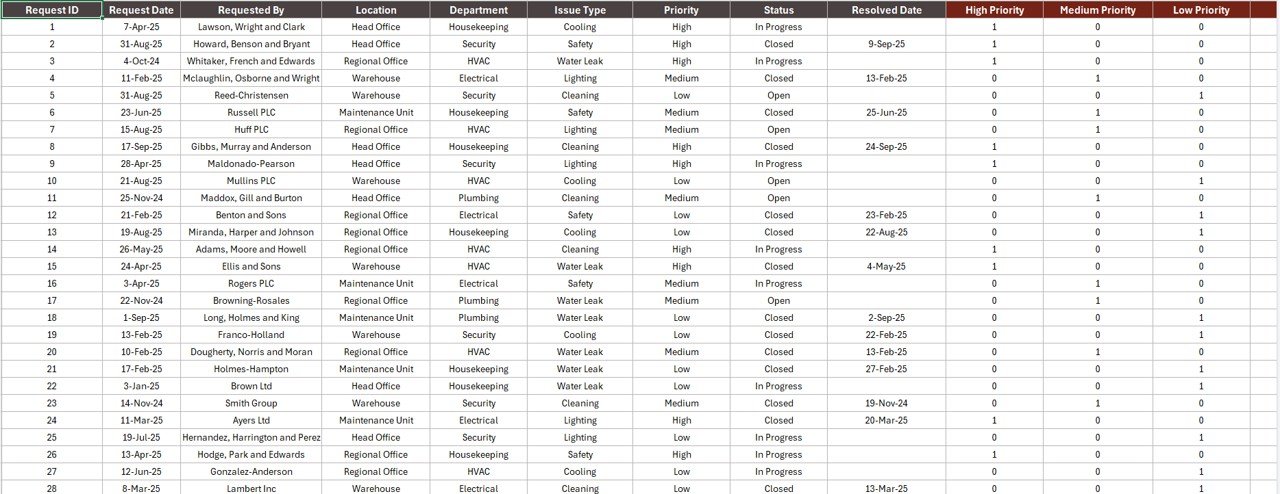
3. Data Sheet
The Data sheet is where your raw request log lives. The template ships with sample rows so you can see the structure; you replace them with your own data. Keep the column headers intact and every chart on the Summary page plus the table on the Report page will repopulate automatically.
If you want to extend the workbook to 5,000 or 10,000 request rows, you can. The formulas and charts are built on structured Excel tables so they expand with the data. Read Microsoft’s documentation on Excel Tables if you want to understand the underlying mechanism.
4. Support Sheet
The Support sheet holds the lookup lists. Add a new location, a new issue category, or a new priority label here once — and the slicers, the data-entry dropdowns, and every downstream aggregation pick it up without you touching any formulas. This is the sheet most Excel reports forget to include and most facility teams end up needing within the first week.
Facilities Management Report in Excel vs. Google Sheets vs. Paid CMMS — Feature Comparison
| Feature | Facilities Management Report in Excel | Google Sheets equivalent | Paid CMMS (UpKeep / Fiix / Limble) |
|---|---|---|---|
| Cost | $7.99 one-time | Free (build yourself, 8–12 hours) | $20–$100 / user / month |
| Platform | Microsoft Excel (desktop + Mac) | Google Sheets (browser) | Web + mobile SaaS |
| Setup time | Under 10 minutes | 8–12 hours from scratch | 2–6 weeks (onboarding + data import) |
| Works offline | ✅ Yes | ❌ Needs internet | ❌ Needs internet (mostly) |
| Slicer-based filtering | ✅ Two built-in slicers | Dropdowns / filter views | ✅ Yes |
| KPI cards + charts pre-built | ✅ 5 cards + 5 charts | Build yourself | ✅ Yes (locked behind tiers) |
| Customizable fields + colors | ✅ Fully unlocked | ✅ Yes | Limited to vendor templates |
| Year-1 cost at 5 users | $7.99 total | $0 (your time) | $1,200–$6,000 / year |
| Mobile app + technician workflow | ❌ No (reporting only) | ❌ No | ✅ Yes |
For facilities teams that want a clean reporting view of open requests, priorities, and monthly volumes — without paying $1,200+ a year for a full CMMS — the Facilities Management Report in Excel sits in the sweet spot.
Who Should Use This Template
Perfect for:
- Facility managers at 10–500 person companies handling 50–2,000 requests a month
- Office admins running in-house maintenance, repair, and service-desk tickets in Excel
- School, clinic, warehouse, and property operations teams that owe leadership a monthly request summary
- Consultants delivering a standard facilities-reporting pack to multiple clients
- Teams that already have a CMMS but want a lightweight Excel roll-up for the weekly leadership meeting
Not a fit if:
- You need a full CMMS — technician mobile apps, preventive-maintenance scheduling, or IoT sensor integration
- Your workflow requires photos, signatures, or barcode scans captured on the request form itself
- Your compliance team mandates a SOC 2 / HIPAA audit trail on every request edit
Real-World Use Cases
Priya runs facility operations for a 220-person tech company in Bangalore. Before this template, her Monday update to the director was a 15-tab Excel file and a lot of copy-paste. Now she keeps the Summary page open during the review, filters by building with the right-side slicer, and sends the exported Report page as a PDF when finance asks which locations are driving the most high-priority work.
Marcus is an independent facilities consultant with six small-business clients. He uses the Facilities Management Report in Excel as a standardized client deliverable. He drops each client’s request log into the Data sheet, updates the Support sheet with that client’s locations, renames the workbook, and sends it back — total time per client, under 30 minutes. No per-client SaaS licenses, no logins to manage.
Nina manages maintenance across a 14-campus K–12 school district. She tracks 800+ service requests a month in the Data sheet. When she used the Total Request by Month chart to show the board three years of request growth, she got sign-off for a second full-time maintenance hire. The chart did more than the memo.
Advantages of the Facilities Management Report in Excel
- No subscription. One payment of $7.99 — lifetime access, lifetime edits. At five users on a $25/user/month CMMS you would pay that back in the first 4 days of the first month.
- Portable. It’s a standard .xlsx file. OneDrive, SharePoint, Google Drive, Dropbox, email attachment — it goes wherever your other files go.
- Editable. Fully unlocked. Rename KPIs, swap the color palette, add new chart types, extend the Data sheet to 10,000+ rows — nothing is protected.
- Offline-capable. Works without internet access, which matters in warehouse, field, and basement-office environments where connectivity is patchy.
- No learning curve. If your team already uses Excel, no additional training is required.
Opportunities for Improvement
Being honest about what this template does not do is more useful than overselling what it does. The Facilities Management Report in Excel is a reporting layer — not a request-capture workflow. It doesn’t notify a technician by SMS, it doesn’t attach photos to a ticket, and it doesn’t run preventive-maintenance schedules automatically. If those are non-negotiable, a full CMMS is a better fit despite the cost.
Real-time multi-user editing also has the standard Excel caveats. For genuine simultaneous co-authoring you need Microsoft 365 with co-authoring enabled on your tenant. If that is not an option and multiple people must edit the Data sheet at the same time, consider the Google Sheets version of this workflow instead.
Best Practices
- Set up the Support sheet before the Data sheet — get your locations, departments, issue types, and priority levels right first, then populate requests.
- Keep the Data sheet column headers untouched. Everything downstream depends on them.
- Refresh the workbook once a week at minimum. A monthly-only refresh hides early warning signs like an unusual spike in high-priority requests from one location.
- Use the Report page for share-ready PDFs. Apply the left-side slicer, then File → Export → PDF. Don’t screenshot the Summary page; the PDF version is more professional.
- Back up the workbook to OneDrive or SharePoint with version history enabled. A sudden accidental overwrite of the Data sheet is the only failure mode users actually hit.
Explore Relevant Templates
- 📘 Work Order Request Tracker in Excel — the ticket-level companion that feeds into this reporting layer.
- 📘 Property Management Dashboard in Excel — if your focus is buildings and tenants rather than requests.
- 📘 HVAC Service Dashboard in Power BI — for teams that prefer Power BI over Excel.
- 📘 Equipment Borrowing Request Tracker in Excel — for tools, laptops, and shared assets.
- 📘 Energy Consumption Analysis Dashboard in Power BI — for utility spend and sustainability reporting.
Browse more options in the Excel Dashboard Templates and Power BI Dashboards collections on NextGenTemplates.
Frequently Asked Questions
What does the Facilities Management Report in Excel track?
The Facilities Management Report in Excel tracks 5 KPI cards and 5 analytical charts covering total requests, in-progress percentage, high-priority items by location, total requests by issue type, in-progress percentage by department, and total requests by month. Every metric updates automatically when you replace the sample data in the Data sheet.
Do I need macros, Power Query, or Power BI to use this report?
No. The Facilities Management Report in Excel uses only native Excel features — formulas, slicers, structured tables, and charts. It works in Excel 2016, 2019, 2021, Microsoft 365, and Excel for Mac. No VBA, no Power Query, and no Power BI required.
How long does setup take?
Under 10 minutes for a typical user. Update the lookup lists in the Support sheet, paste your request log into the Data sheet, and return to the Summary page. Every chart, KPI card, and slicer refreshes automatically. There is no onboarding process or vendor training.
How does this compare to UpKeep, Fiix, or Limble?
Those are full CMMS platforms in the $20–$100 per user per month range, with mobile apps, preventive-maintenance scheduling, and technician workflows. The Facilities Management Report in Excel is a one-time $7.99 reporting layer for teams that just need a clean summary view for leadership — without a subscription.
Can I add more locations, departments, or issue types?
Yes. Open the Support sheet, add your entries to the lookup lists, and the slicers plus data-entry dropdowns pick them up automatically across the Summary and Report pages. The template is fully unlocked for lifetime edits.
Can my team co-edit this workbook on OneDrive or SharePoint?
Yes. The Facilities Management Report in Excel is a standard .xlsx file — it works with OneDrive, SharePoint, Google Drive, Dropbox, and any corporate file-share. For real-time co-authoring you’ll need Microsoft 365 co-authoring enabled on your tenant.
Is there a refund policy?
Because the Facilities Management Report in Excel is a digital download delivered instantly, refunds aren’t offered after download. You can preview the Summary, Report, Data, and Support sheets in the product screenshots on the listing page before purchasing.
About the Author
Built by PK — Microsoft Certified Professional with 15+ years of Excel, Google Sheets, and Power BI experience. Founder of NextGenTemplates, reaching 300K+ subscribers across YouTube channels (@PK-AnExcelExpert, @NextGenTemplates, @NeoTechNavigators). Every template is hand-built and tested before release.
Conclusion
The Facilities Management Report in Excel gives small and mid-size facilities teams exactly what they need for weekly and monthly reporting — 5 KPI cards, 5 charts, two slicers, a line-level Report page, and a clean Data sheet — without asking them to sign a per-user per-month CMMS contract. If your team logs facility requests anywhere and you need a presentable summary view for leadership, this is the lightest path to get there.
👉 Click here to Purchase the Facilities Management Report in Excel
✅ Instant download · One-time payment · No subscription · Lifetime edits allowed
🎥 Visit our YouTube channel for step-by-step tutorials: Youtube.com/@PK-AnExcelExpert
📅 Last updated: April 2026