Spas and wellness centres operate in a highly competitive and service-driven environment. Every decision—from staff scheduling and treatment utilization to customer satisfaction and revenue growth—directly affects profitability and brand reputation. However, when managers rely on scattered spreadsheets or manual reports, performance gaps remain hidden.
That is exactly where a Spas and Wellness Centres KPI Dashboard in Excel becomes a powerful management solution.
In this detailed guide, you will learn what a Spas and Wellness Centres KPI Dashboard in Excel is, why it matters, how it works, its key features, advantages, best practices, and frequently asked questions. By the end of this article, you will clearly understand how this ready-to-use Excel dashboard helps spa owners and wellness managers monitor KPIs, control operations, and improve business outcomes.
Click to Purchases Spas and Wellness Centres KPI Dashboard in Excel
What Is a Spas and Wellness Centres KPI Dashboard in Excel?
A Spas and Wellness Centres KPI Dashboard in Excel is a structured performance tracking tool that consolidates key business metrics into one interactive interface.
Instead of reviewing multiple reports, managers can monitor:
-
Revenue and service performance
-
Customer satisfaction indicators
-
Staff productivity metrics
-
Treatment utilization rates
-
Month-to-date (MTD) and year-to-date (YTD) trends
Because Excel powers this dashboard, users can update data easily, customize KPIs, and share insights without advanced technical skills.
Why Do Spas and Wellness Centres Need a KPI Dashboard?
Spas and wellness centres manage daily operations that change quickly. Therefore, delayed or inaccurate reporting leads to poor decisions.
A KPI Dashboard in Excel helps because it:
-
Centralizes all KPIs in one view
-
Compares actual performance with targets
-
Tracks trends across months and years
-
Highlights underperforming areas instantly
-
Improves accountability across teams
As a result, managers gain clarity and control.
How Does a Spas and Wellness Centres KPI Dashboard in Excel Work?
This ready-to-use dashboard works through seven well-structured worksheets, each designed for a specific purpose. Together, these sheets create a complete KPI monitoring and analysis system for spas and wellness centres.
What Are the Key Worksheets in the Spas and Wellness Centres KPI Dashboard in Excel?
1. Home Sheet: How Does the Index Page Improve Navigation?
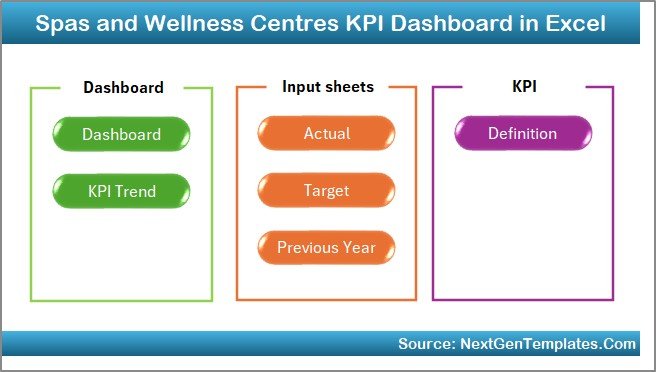
The Home Sheet serves as the main navigation hub of the dashboard. Instead of scrolling through sheets, users can jump directly to any section using buttons.
Key Features of the Home Sheet:
-
Clean and professional layout
-
Six navigation buttons for quick access
-
Easy movement between analytical pages
As a result, users save time and avoid confusion.
Click to Purchases Spas and Wellness Centres KPI Dashboard in Excel
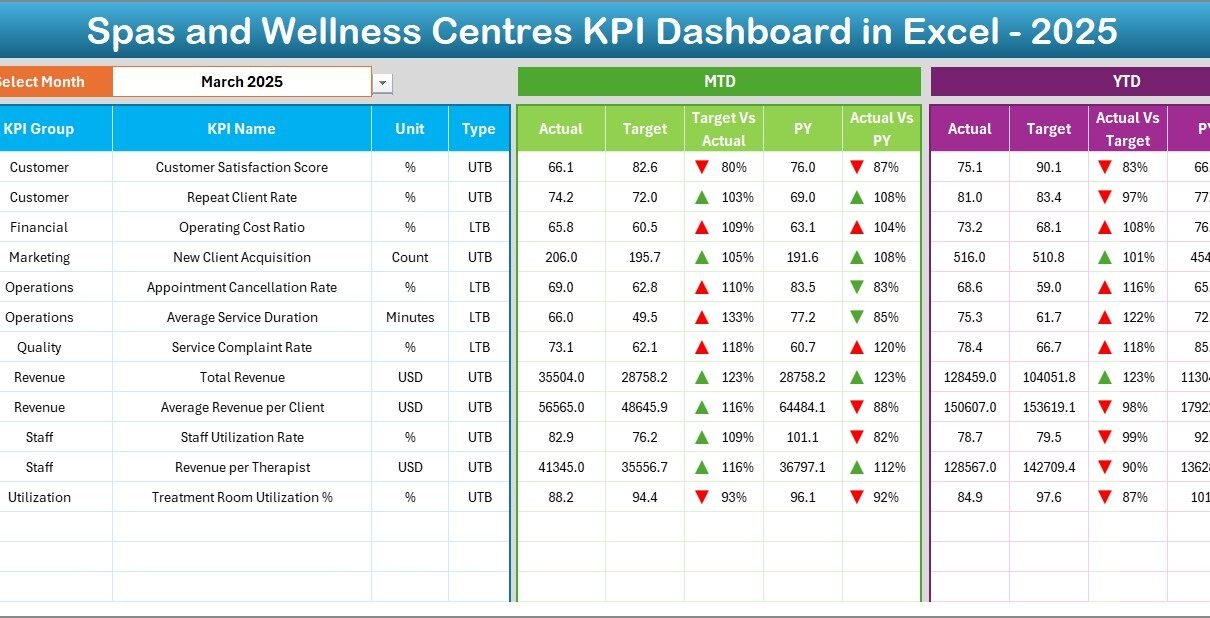
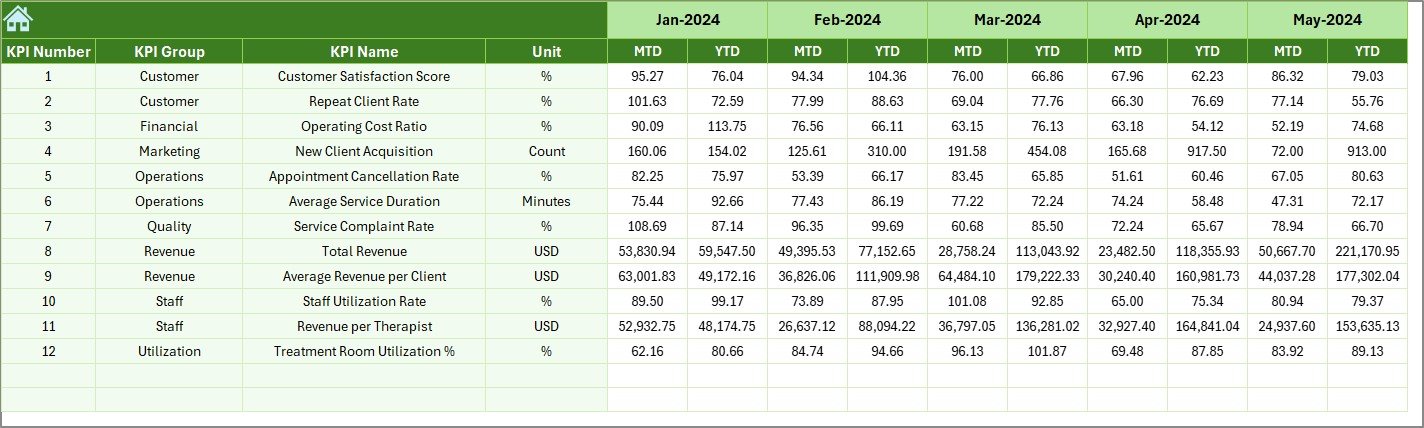
2. Dashboard Sheet: How Can You Monitor All KPIs in One Place?
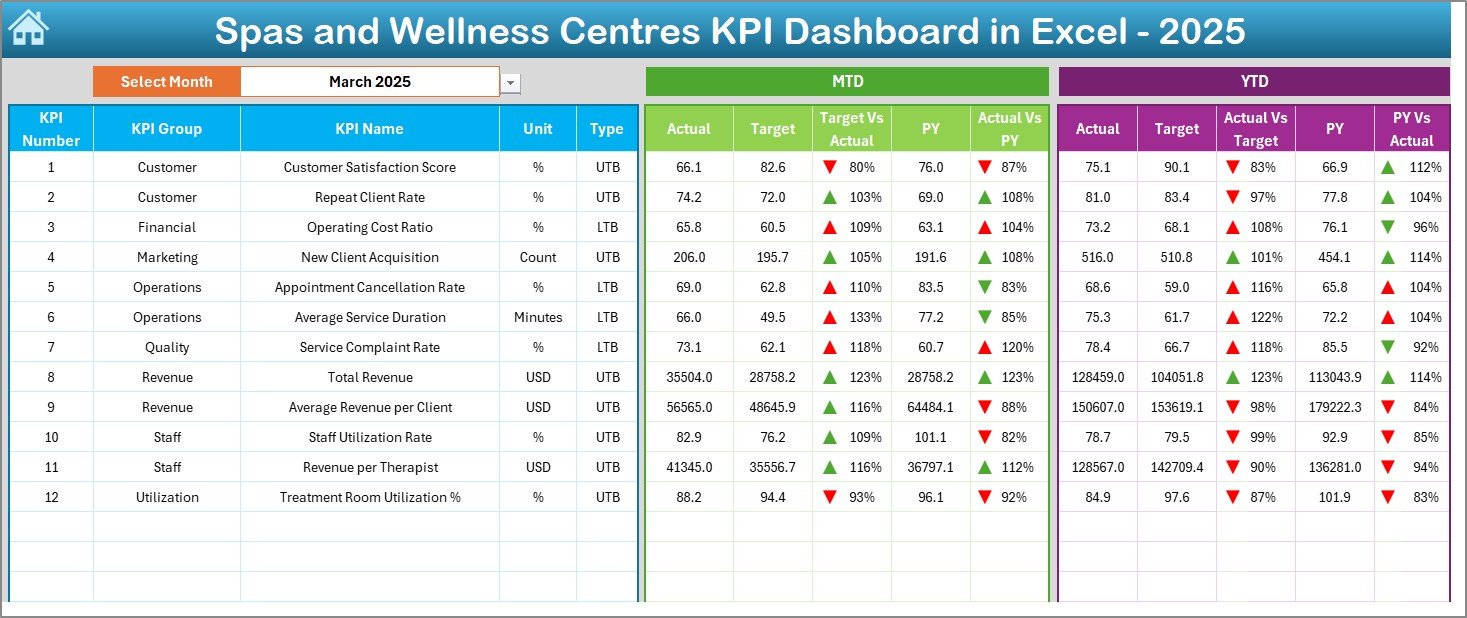
The Dashboard Sheet is the main analytical interface of the KPI dashboard.
How Does the Month Selection Work?
-
Select the Month from the dropdown available in cell D3
-
The entire dashboard updates automatically based on the selected month
What Metrics Does the Dashboard Display?
-
MTD Actual, Target, and Previous Year (PY) values
-
Target vs Actual comparison with up/down arrows
-
PY vs Actual comparison with conditional formatting
-
YTD Actual, Target, and PY values
-
Visual indicators for quick performance assessment
Because of this structure, managers instantly identify strong and weak areas.
3. KPI Trend Sheet: How Can You Analyze Individual KPI Performance?
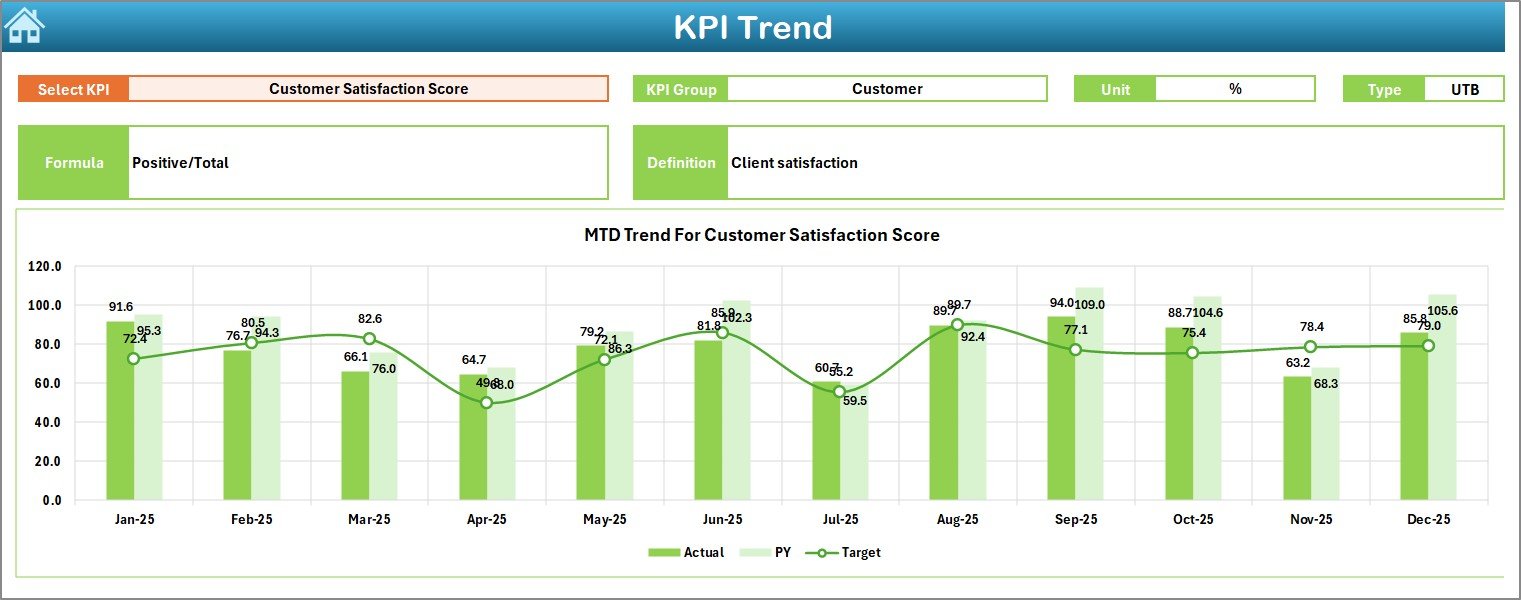
The KPI Trend Sheet allows detailed analysis of a selected KPI.
KPI Selection
-
Select the KPI Name from the dropdown available in cell C3
-
The sheet updates dynamically based on the selection
KPI Information Displayed
-
KPI Group
-
Unit of KPI
-
Type of KPI (Lower the Better or Upper the Better)
-
KPI Formula
-
KPI Definition
Trend Charts Included
-
MTD trend for Actual, Target, and PY
-
YTD trend for Actual, Target, and PY
Therefore, managers can understand performance patterns and seasonality.
Click to Purchases Spas and Wellness Centres KPI Dashboard in Excel
4. Actual Numbers Input Sheet: Where Do You Enter Actual Performance Data?
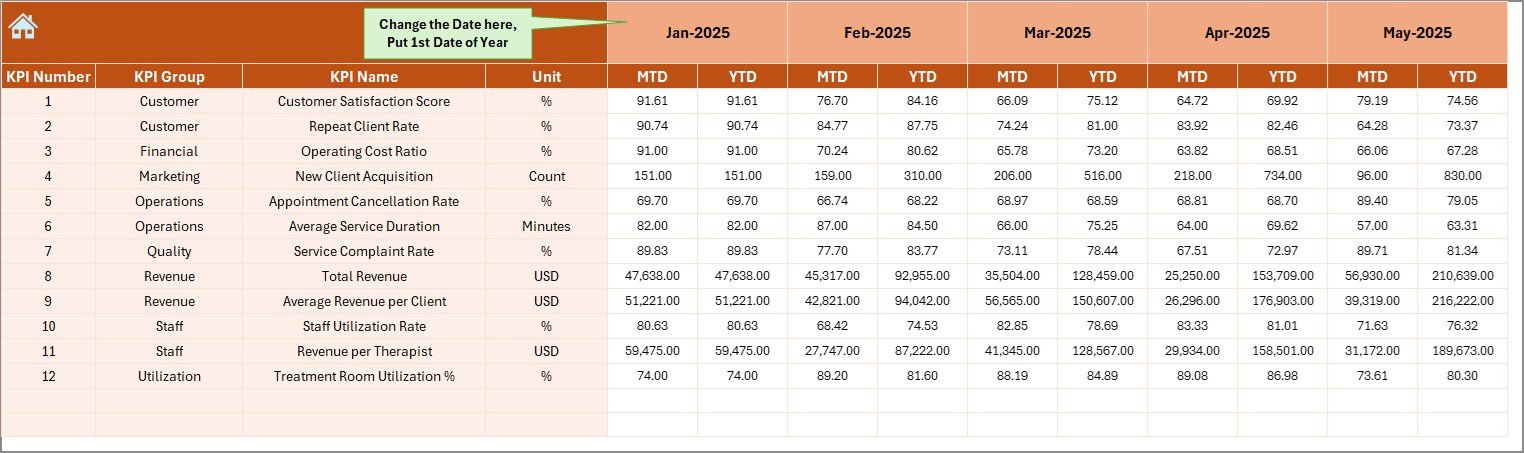
The Actual Numbers Input Sheet captures real performance data.
Key Features
-
Enter actual values for MTD and YTD
-
Change the reporting month using cell E1
-
Define the first month of the financial year easily
Because this sheet feeds calculations, accurate data ensures reliable insights.
5. Target Sheet: How Do You Set Performance Benchmarks?
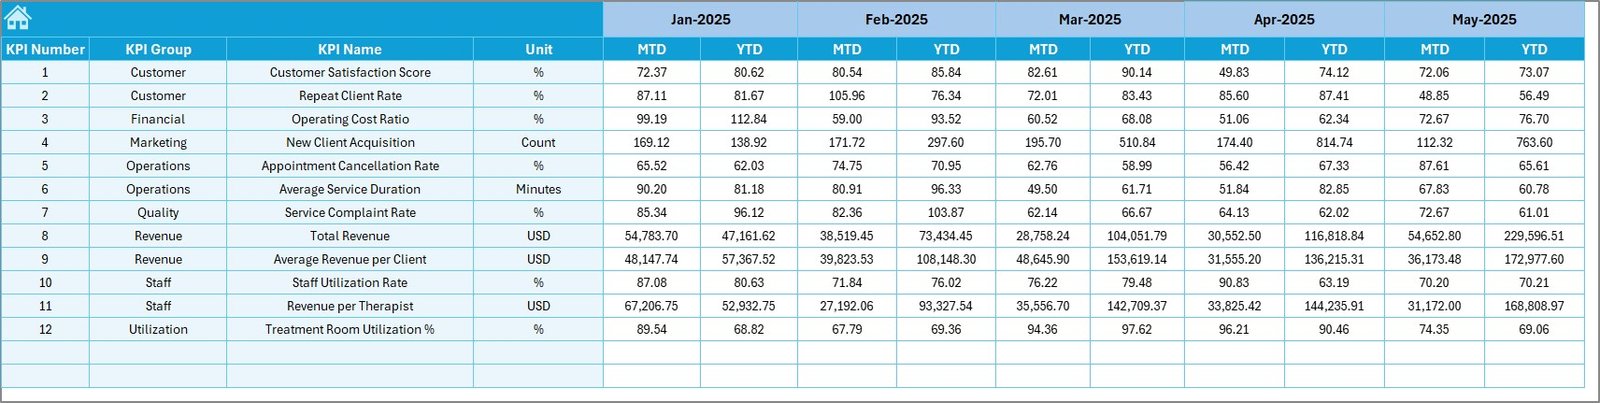
The Target Sheet stores target values for each KPI.
What You Can Do on This Sheet
-
Enter monthly MTD targets
-
Define YTD targets for each KPI
-
Align performance goals with business objectives
As a result, comparisons remain meaningful and consistent.
Click to Purchases Spas and Wellness Centres KPI Dashboard in Excel
6. Previous Year Numbers Sheet: How Do You Compare Historical Performance?
The Previous Year Numbers Sheet captures historical data.
Purpose of This Sheet
-
Enter previous year values for the same KPIs
-
Enable YOY (Year-over-Year) performance comparison
-
Identify growth or decline trends
This comparison adds strategic depth to decision-making.
7. KPI Definition Sheet: How Do You Maintain KPI Consistency?
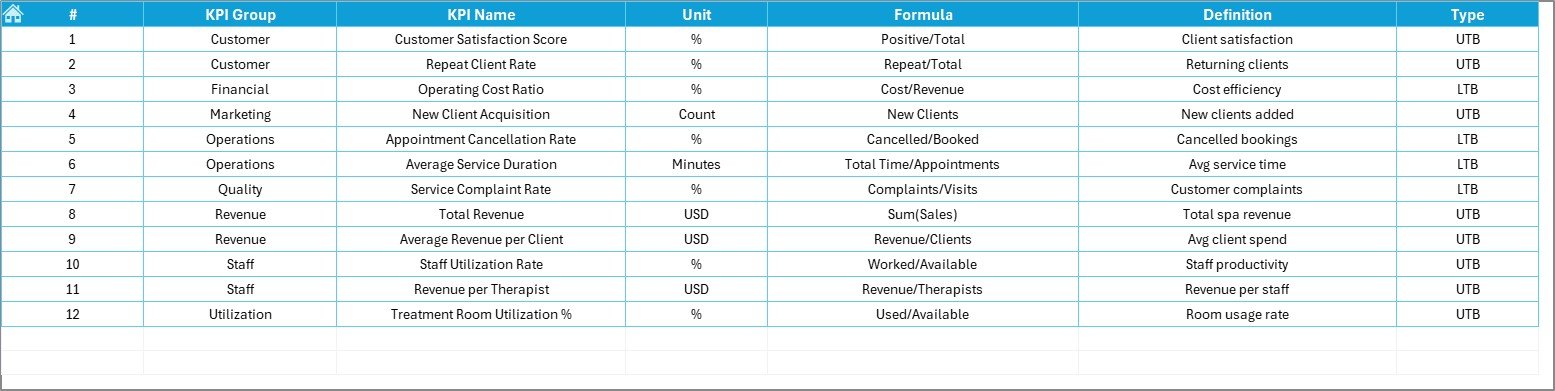
The KPI Definition Sheet standardizes KPI understanding across teams.
Information Stored in This Sheet
-
KPI Name
-
KPI Group
-
Unit of Measurement
-
KPI Formula
-
KPI Definition
This sheet eliminates ambiguity and ensures consistent measurement.
What KPIs Can a Spa and Wellness Centre Track?
This KPI dashboard supports multiple business-critical metrics, such as:
-
Revenue per treatment
-
Customer satisfaction score
-
Appointment utilization rate
-
Therapist productivity
-
Repeat customer percentage
-
Cancellation and no-show rate
-
Average service time
-
Membership growth
Therefore, the dashboard adapts to different spa business models.
Click to Purchases Spas and Wellness Centres KPI Dashboard in Excel
Advantages of Spas and Wellness Centres KPI Dashboard in Excel
Using this KPI dashboard delivers strong operational benefits.
Key Advantages Include:
-
Centralized KPI monitoring
-
Clear MTD and YTD analysis
-
Visual performance indicators
-
Easy customization in Excel
-
Reduced manual reporting effort
-
Faster decision-making
-
Improved staff accountability
As a result, spa managers focus more on service quality and growth.
How Does This Dashboard Improve Spa Business Performance?
Because the dashboard highlights gaps early:
-
Managers correct issues before revenue drops
-
Teams align with clear targets
-
Resources get allocated efficiently
-
Customer experience improves consistently
Therefore, performance management becomes proactive.
Click to Purchases Spas and Wellness Centres KPI Dashboard in Excel
Who Should Use a Spas and Wellness Centres KPI Dashboard in Excel?
This dashboard suits various professionals, including:
-
Spa owners
-
Wellness centre managers
-
Operations heads
-
Finance and performance analysts
-
Franchise operators
-
Multi-location spa managers
If you manage spa performance, this tool becomes essential.
Best Practices for Using the Spas and Wellness Centres KPI Dashboard in Excel
Follow these best practices to maximize value.
1. Define KPIs Clearly
Use the KPI Definition Sheet to avoid confusion.
2. Update Data Monthly
Regular updates keep insights accurate and actionable.
3. Review Trends, Not Just Numbers
Trend charts reveal patterns hidden in static values.
4. Set Realistic Targets
Align targets with capacity and market demand.
5. Share Insights with Teams
Transparency improves accountability and motivation.
6. Maintain a Single Master File
Avoid version conflicts by using one source of truth.
How Is This Dashboard Better Than Manual Reports?
Manual reports consume time and often arrive late. However, this KPI dashboard:
-
Updates instantly
-
Shows comparisons visually
-
Reduces human error
-
Supports faster decisions
As a result, it replaces outdated reporting methods.
Click to Purchases Spas and Wellness Centres KPI Dashboard in Excel
Conclusion: Why Use a Spas and Wellness Centres KPI Dashboard in Excel?
A Spas and Wellness Centres KPI Dashboard in Excel transforms performance tracking into a structured and insightful process. Instead of guessing outcomes, managers gain real-time visibility into operations.
Because this dashboard combines MTD, YTD, targets, previous year comparisons, and trend analysis, it supports smarter decisions and sustainable growth.
If you want better control, higher efficiency, and improved customer experience, this Excel KPI dashboard is the right solution.
Frequently Asked Questions (FAQs)
1. What is a Spas and Wellness Centres KPI Dashboard in Excel?
It is an Excel-based dashboard that tracks and analyzes spa performance metrics.
2. Can I customize KPIs?
Yes, you can easily add or modify KPIs.
3. Does it support MTD and YTD analysis?
Yes, the dashboard includes both MTD and YTD views.
4. Is Excel expertise required?
Only basic Excel knowledge is sufficient.
5. Can I compare with previous year performance?
Yes, the dashboard includes PY vs Actual comparisons.
6. Is it suitable for multi-location spas?
Yes, it works well for single and multi-location operations.
7. Does it improve profitability?
Yes, because better insights lead to better decisions.
Click to Purchases Spas and Wellness Centres KPI Dashboard in Excel
Visit our YouTube channel to learn step-by-step video tutorials