Artificial Intelligence continues to reshape how organizations operate, decide, and compete. However, as AI adoption increases, governance, ethics, compliance, and risk management become equally critical. Because of this growing need, organizations must track AI governance metrics in a structured, transparent, and consistent way.
That is exactly where an AI Governance KPI Dashboard in Excel becomes a powerful solution.
In this in-depth guide, you will learn what an AI Governance KPI Dashboard in Excel is, why it matters, how it works, and how each worksheet supports strong AI oversight. Moreover, you will explore its advantages, best practices, and frequently asked questions. By the end, you will clearly understand how this ready-to-use Excel dashboard helps organizations move from ad-hoc AI monitoring to disciplined AI governance.
An AI Governance KPI Dashboard in Excel is a structured and interactive reporting tool designed to track, analyze, and visualize key performance indicators related to AI governance.
Instead of managing scattered documents, emails, and static reports, this dashboard centralizes all AI governance KPIs in one Excel-based system. As a result, governance teams, risk officers, compliance leaders, and executives gain instant visibility into AI performance, ethics, compliance, and control effectiveness.
Because Excel remains widely used and easy to maintain, organizations can adopt this dashboard without expensive tools or long implementation cycles. Moreover, teams can update data monthly and immediately see changes across the entire dashboard.
Why Does AI Governance Matter More Than Ever?
AI systems now influence hiring, lending, healthcare decisions, customer service, and security operations. Therefore, weak AI governance creates serious risks.
Strong AI governance matters because it helps organizations:
-
Ensure ethical and responsible AI use
-
Comply with regulations and internal policies
-
Reduce bias, errors, and unfair outcomes
-
Improve transparency and accountability
-
Build trust with customers, regulators, and stakeholders
However, governance efforts fail when teams lack measurable KPIs and structured reporting. That is why an AI Governance KPI Dashboard in Excel plays such a critical role.
How Does an AI Governance KPI Dashboard in Excel Help Organizations?
An AI Governance KPI Dashboard in Excel helps organizations transform governance from theory into action.
Because the dashboard tracks monthly and yearly performance, teams can quickly identify gaps, trends, and risks. Moreover, leaders can compare actual results with targets and previous-year performance, which supports proactive decision-making.
Most importantly, this dashboard creates a single source of truth for AI governance metrics.
What Are the Key Features of the AI Governance KPI Dashboard in Excel?
This ready-to-use AI Governance KPI Dashboard in Excel includes 7 well-structured worksheets, each designed to support a specific governance activity.
Let us explore each sheet in detail.
How Does the Home Sheet Improve Navigation and Usability?
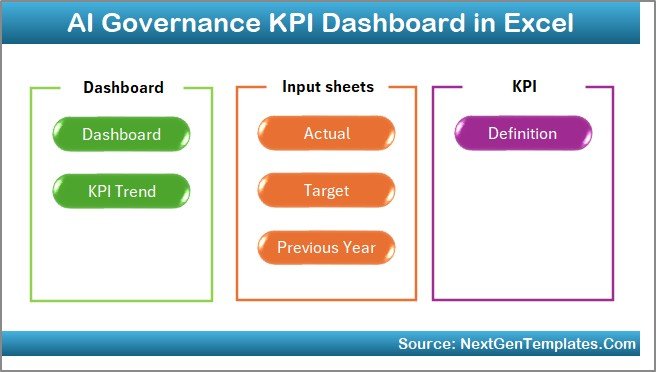
The Home Sheet acts as the index page of the dashboard.
On this sheet, you will find six clearly labeled navigation buttons. Each button allows users to jump directly to a specific worksheet with a single click. Because of this design, users do not waste time searching for sheets.
Key Benefits of the Home Sheet
-
Provides quick access to all sections
-
Improves user experience
-
Reduces navigation errors
-
Makes the dashboard executive-friendly
As a result, even non-technical users can use the dashboard confidently.
What Information Does the Dashboard Sheet Display?
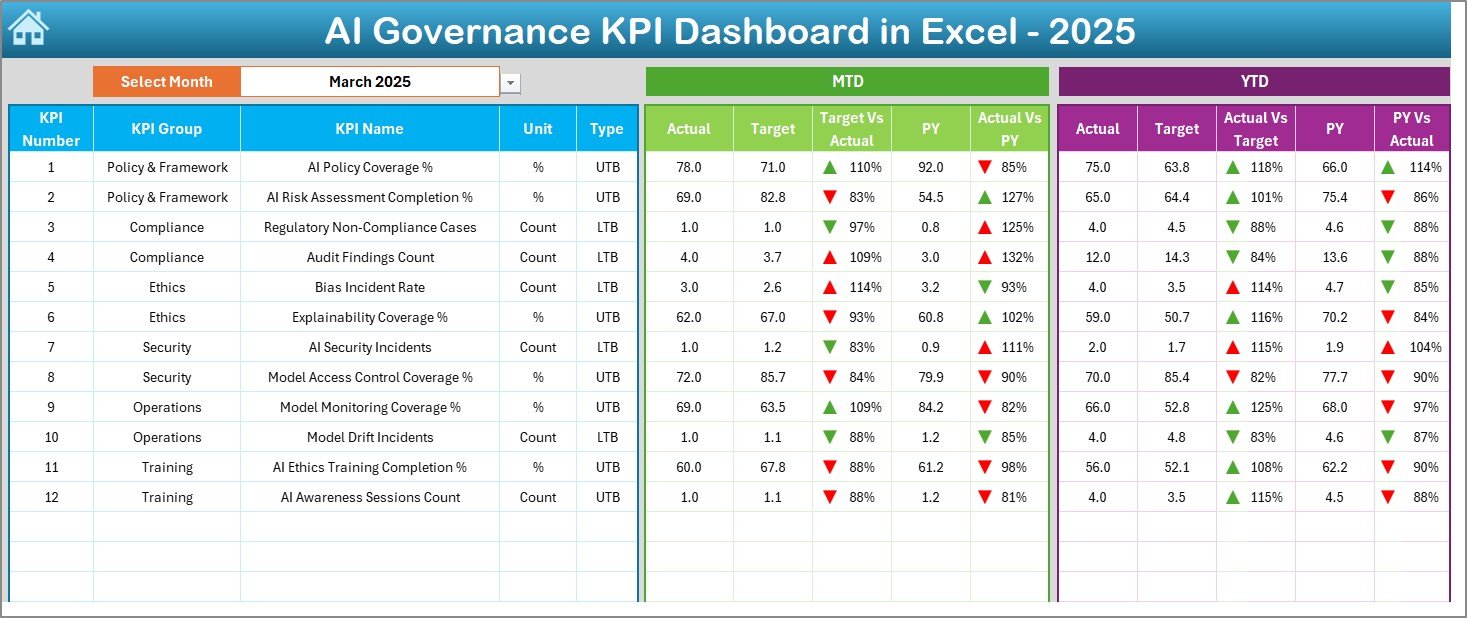
The Dashboard Sheet serves as the main performance view of the AI Governance KPI Dashboard in Excel.
On this sheet, you can monitor all AI governance KPIs at a glance.
Month Selection Control
-
On cell D3, you can select the reporting month from a drop-down list
-
Once you change the month, the entire dashboard updates automatically
This dynamic behavior ensures accurate and timely reporting.
KPI Performance Metrics Shown
For each KPI, the dashboard displays:
-
MTD Actual
-
MTD Target
-
MTD Previous Year
-
Target vs Actual variance
-
Previous Year vs Actual variance
In addition, the dashboard also shows:
-
YTD Actual
-
YTD Target
-
YTD Previous Year
-
Target vs Actual (YTD)
-
Previous Year vs Actual (YTD)
Conditional Formatting for Quick Insights
The dashboard uses up and down arrows with color indicators. Because of this visual approach, users can instantly identify:
-
KPIs meeting targets
-
KPIs missing targets
-
KPIs improving or declining compared to last year
This clarity allows faster governance decisions.
How Does the KPI Trend Sheet Support Deeper Analysis?
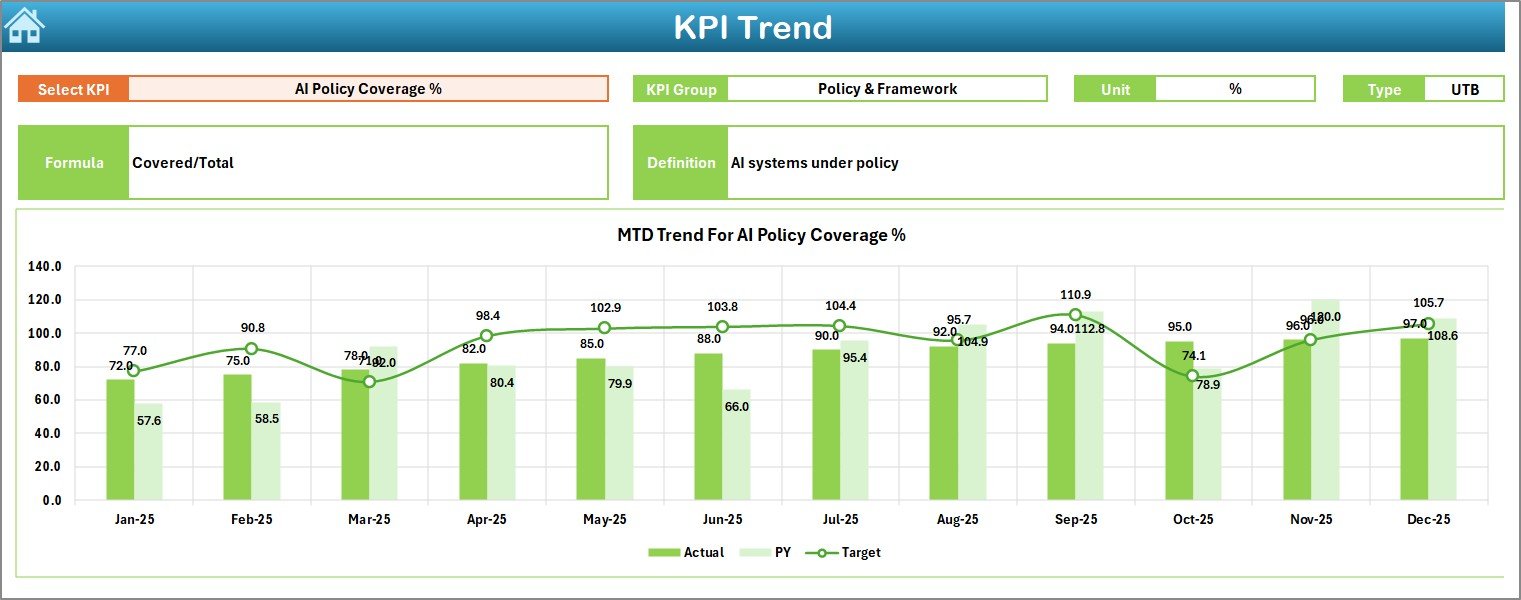
The KPI Trend Sheet enables detailed analysis for individual KPIs.
KPI Selection
-
On cell C3, you can select a KPI name from a drop-down list
-
Once selected, all related details update automatically
KPI Information Displayed
This sheet displays:
-
KPI Group
-
Unit of Measurement
-
KPI Type (Lower the Better or Upper the Better)
-
KPI Formula
-
KPI Definition
Because of this structure, users clearly understand what each KPI measures and why it matters.
Trend Charts
The sheet also includes MTD and YTD trend charts for:
-
Actual values
-
Target values
-
Previous year values
These visual trends help governance teams spot patterns, risks, and improvements over time.
Click to Purchases AI Governance KPI Dashboard in Excel
Why Is the Actual Numbers Input Sheet Important?
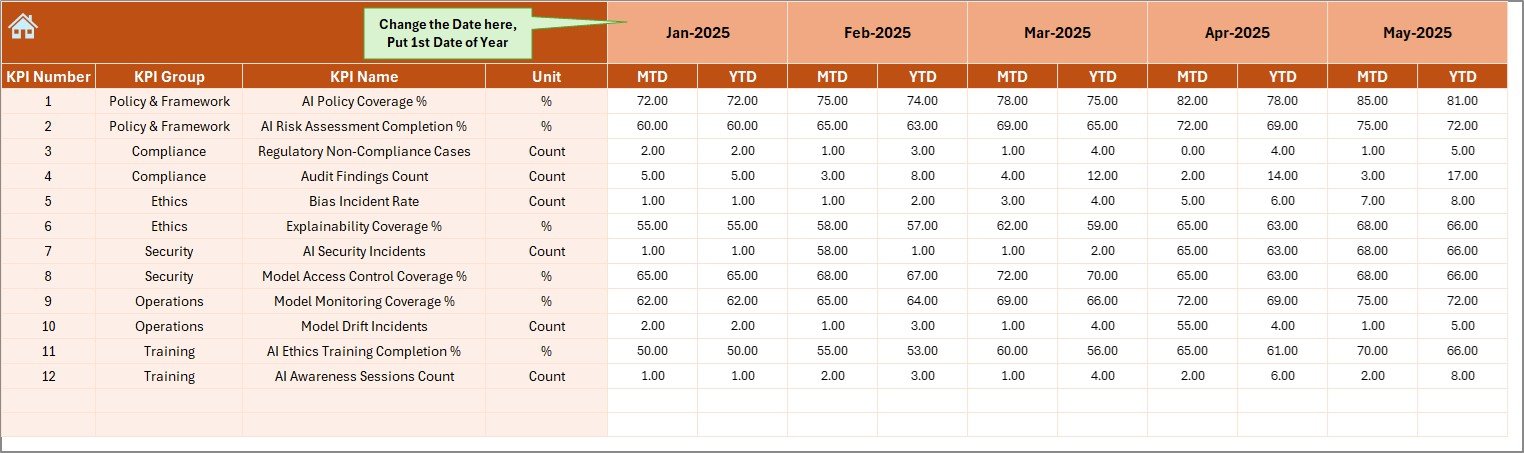
The Actual Numbers Input Sheet acts as the primary data entry point for current performance.
How Data Entry Works
-
You enter MTD and YTD actual values for each KPI
-
You control the reporting period using cell E1
-
In cell E1, you enter the first month of the year
Once you enter the data, Excel automatically updates all dashboards and trend charts.
Benefits of This Sheet
-
Keeps data entry simple
-
Reduces calculation errors
-
Maintains consistency across reports
As a result, teams can focus on analysis instead of manual calculations.
How Does the Target Sheet Help Track Governance Goals?

The Target Sheet stores target values for each AI governance KPI.
What You Enter in This Sheet
-
Monthly MTD target values
-
Cumulative YTD target values
Because targets remain separate from actual data, the dashboard can clearly compare performance against goals.
This separation also ensures better accountability and planning.
What Is the Role of the Previous Year Number Sheet?

The Previous Year Number Sheet allows organizations to track historical performance.
Key Purpose
-
Enter last year’s MTD and YTD values
-
Enable year-over-year comparison
Because governance maturity evolves over time, this comparison helps teams understand progress and gaps.
Why Is the KPI Definition Sheet Critical for AI Governance?
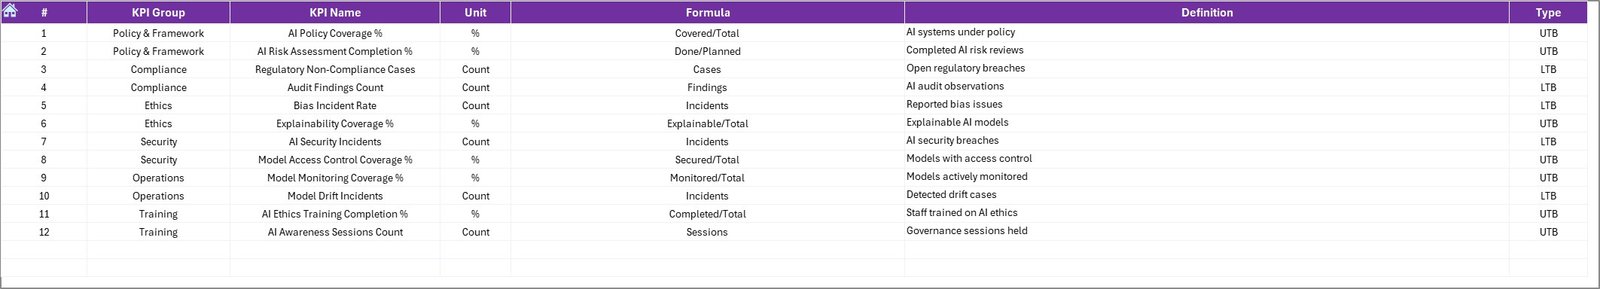
The KPI Definition Sheet acts as the backbone of the entire dashboard.
Information Stored in This Sheet
-
KPI Name
-
KPI Group
-
Unit of Measurement
-
Formula
-
KPI Definition
Because AI governance KPIs can be complex, this sheet ensures clarity and consistency. Moreover, new team members can quickly understand how each KPI works.
Which AI Governance KPIs Can You Track Using This Dashboard?
An AI Governance KPI Dashboard in Excel can track a wide range of governance metrics, including:
-
AI model compliance rate
-
Bias detection incidents
-
Model audit completion rate
-
Explainability coverage
-
Human-in-the-loop review rate
-
Policy adherence percentage
-
Risk assessment completion rate
Because the dashboard remains flexible, organizations can customize KPIs based on regulatory and internal needs.
Advantages of AI Governance KPI Dashboard in Excel
Why Should Organizations Use This Dashboard?
An AI Governance KPI Dashboard in Excel offers several strong advantages.
Centralized Governance Monitoring
-
Tracks all AI governance KPIs in one place
-
Eliminates fragmented reporting
Easy to Use and Maintain
-
Works entirely in Excel
-
Does not require advanced technical skills
Dynamic and Interactive Reporting
-
Month-wise selection
-
Automatic updates
-
Visual indicators for performance
Cost-Effective Solution
-
Avoids expensive governance platforms
-
Uses existing Excel infrastructure
Better Decision-Making
-
Highlights risks early
-
Supports proactive governance actions
Best Practices for the AI Governance KPI Dashboard in Excel
Click to Purchases AI Governance KPI Dashboard in Excel
How Can You Get the Most Value from This Dashboard?
Follow these best practices to maximize effectiveness.
Define Clear and Relevant KPIs
Select KPIs that align with regulations, ethics policies, and business goals.
Maintain Data Accuracy
Update actual, target, and previous-year data regularly to ensure reliable insights.
Review Trends Monthly
Analyze MTD and YTD trends every month to detect early warning signals.
Use KPI Definitions Consistently
Keep formulas and definitions standardized to avoid confusion.
Share Insights with Stakeholders
Use dashboard outputs during governance reviews and executive meetings.
How Does This Dashboard Support Regulatory Compliance?
Because regulations increasingly demand AI transparency and accountability, this dashboard plays a vital role.
It helps organizations:
-
Demonstrate governance controls
-
Provide audit-ready reports
-
Track compliance KPIs over time
-
Support regulatory inspections
As a result, organizations strengthen their compliance posture.
Who Should Use an AI Governance KPI Dashboard in Excel?
This dashboard suits multiple roles, including:
-
AI governance teams
-
Risk and compliance officers
-
Data science leaders
-
Internal audit teams
-
Executive leadership
Because of its simplicity, both technical and non-technical users can benefit.
Conclusion: Is an AI Governance KPI Dashboard in Excel Worth Using?
Yes, absolutely.
An AI Governance KPI Dashboard in Excel provides a structured, transparent, and practical way to monitor AI governance performance. Instead of reactive reporting, organizations gain proactive oversight.
By using this ready-to-use Excel dashboard, teams improve accountability, reduce AI risks, and build trust in AI systems. Most importantly, they turn governance into measurable action.
Frequently Asked Questions About AI Governance KPI Dashboard in Excel
What Is the Purpose of an AI Governance KPI Dashboard in Excel?
The dashboard tracks, analyzes, and visualizes AI governance KPIs to ensure ethical, compliant, and responsible AI usage.
Can I Customize the KPIs in the Dashboard?
Yes, you can easily add, remove, or modify KPIs in the KPI Definition Sheet.
Do I Need Advanced Excel Skills to Use This Dashboard?
No, basic Excel knowledge is sufficient to use and maintain the dashboard.
How Often Should I Update the Data?
You should update the data monthly to keep governance insights accurate and relevant.
Can This Dashboard Support Audits?
Yes, the dashboard provides structured and historical data that supports internal and external audits.
Is This Dashboard Suitable for Small Organizations?
Yes, both small and large organizations can use this Excel-based solution effectively.
Visit our YouTube channel to learn step-by-step video tutorials