Contracts play a critical role in protecting business interests, managing obligations, and driving revenue. However, when organizations manage contracts using scattered Excel files, emails, or static reports, visibility drops quickly. As a result, teams miss targets, compliance risks increase, and leadership struggles to track performance.
That is exactly where a Contract Management KPI Dashboard in Power BI delivers real value.
This ready-to-use Power BI dashboard transforms raw contract data into clear, interactive, and actionable insights. Instead of manually reviewing contract registers, teams can instantly monitor KPIs, track trends, and compare performance across months and years.
In this detailed and SEO-friendly guide, you will learn what a Contract Management KPI Dashboard in Power BI is, how it works, why it is important, and how each dashboard page supports smarter contract decisions. Moreover, you will explore its advantages, best practices, and frequently asked questions. By the end of this article, you will clearly understand how this dashboard helps organizations gain full control over contract performance.
Click to Purchases Contract Management KPI Dashboard in Power BI
What Is a Contract Management KPI Dashboard in Power BI?
A Contract Management KPI Dashboard in Power BI is an interactive analytics solution designed to track, analyze, and monitor key performance indicators related to contract lifecycle management.
Instead of relying on static Excel reports, this dashboard connects contract data from Excel and visualizes it in Power BI. Consequently, users gain real-time insights into contract compliance, performance, and trends.
This dashboard typically tracks:
-
Contract performance KPIs
-
Target vs actual comparisons
-
Month-to-Date (MTD) and Year-to-Date (YTD) metrics
-
Previous year comparisons
-
KPI trend analysis
Since the dashboard runs on Power BI, users benefit from interactive slicers, drill-through analysis, and dynamic visuals.
Why Do Organizations Need a Contract KPI Dashboard?
Contract management involves deadlines, service levels, compliance requirements, and financial commitments. Therefore, even a small delay or oversight can cause serious issues.
A KPI dashboard helps organizations:
-
Track contract performance consistently
-
Identify missed targets early
-
Compare current performance with previous years
-
Improve accountability across teams
-
Support data-driven contract decisions
Moreover, leadership gains a single source of truth for contract KPIs.
Introduction to Contract Management KPI Dashboard in Power BI
The Contract Management KPI Dashboard in Power BI is a professionally designed and ready-to-use dashboard built for contract performance monitoring.
This dashboard uses Excel as a data source and Power BI for visualization. As a result, it combines data simplicity with powerful analytics.
With this dashboard, you can:
-
Track MTD and YTD KPIs
-
Monitor target achieved and missed KPIs
-
Compare current year and previous year performance
-
Analyze KPI trends using interactive charts
-
Drill through to detailed KPI definitions
Key Features of Contract Management KPI Dashboard in Power BI
Below are the key features that make this dashboard effective and easy to use.
📊 Centralized Contract KPI Monitoring
All contract KPIs appear in one interactive Power BI dashboard.
🎯 MTD and YTD Performance Tracking
Track Month-to-Date and Year-to-Date performance for every KPI.
🔁 Target vs Actual Comparison
Quickly identify whether KPIs meet or miss defined targets.
📈 Trend Analysis
Visualize KPI performance trends for current year, previous year, and targets.
🎨 Visual KPI Status Indicators
Use red and green icons to instantly understand KPI performance.
🔍 Drill-Through KPI Details
Access KPI formulas and definitions directly from the dashboard.
Click to Purchases Contract Management KPI Dashboard in Power BI
Pages Included in Contract Management KPI Dashboard in Power BI
This Power BI dashboard consists of three well-structured pages, each designed to support a specific type of analysis.
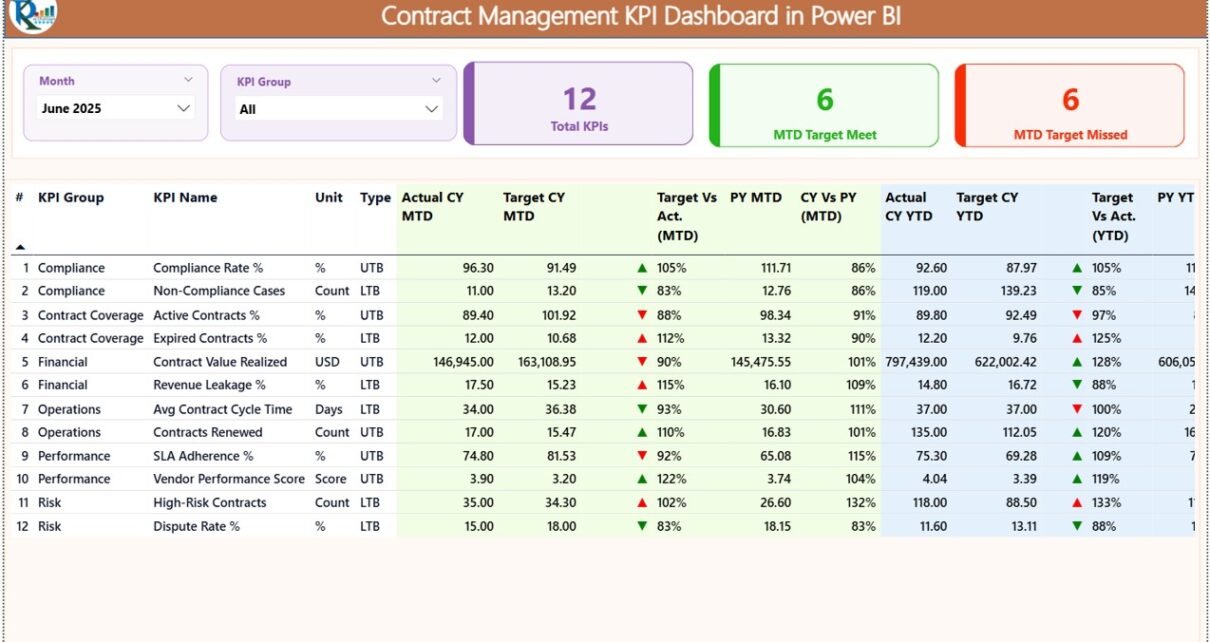
1. Summary Page – Overall Contract KPI Performance
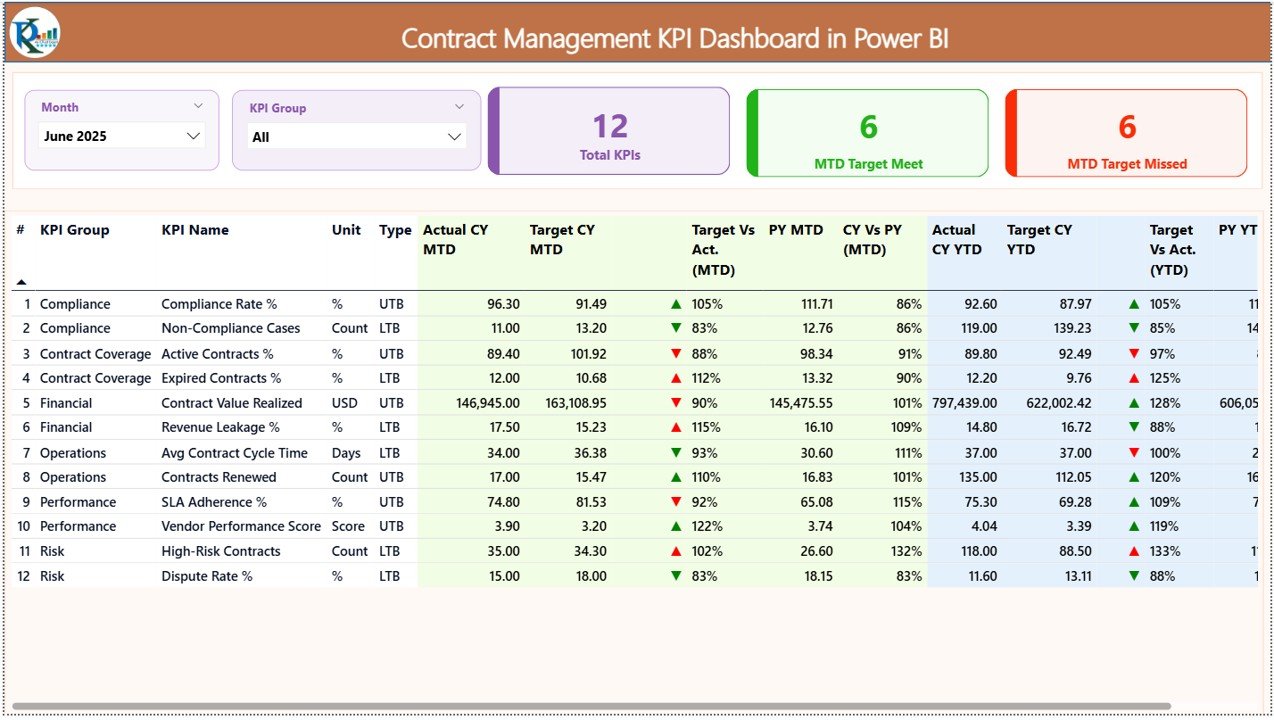
The Summary Page is the main page of the dashboard and provides a complete overview of all contract KPIs.
Key Elements of Summary Page
🔽 Interactive Slicers
At the top of the page, you can filter data using:
-
Month slicer
-
KPI Group slicer
These slicers update the entire dashboard instantly.
📊 KPI Summary Cards
The dashboard displays three key cards:
-
Total KPIs count
-
MTD Target Meet count
-
MTD Target Missed count
These cards give an instant snapshot of overall performance.
📋 Detailed KPI Table
Below the cards, a detailed table displays comprehensive KPI information.
The table includes:
-
KPI Number
-
KPI Group
-
KPI Name
-
Unit of Measurement
-
KPI Type (LTB or UTB)
-
Actual CY MTD
-
Target CY MTD
-
MTD Status Icon
-
Target vs Actual (MTD %)
-
Previous Year MTD
-
CY vs PY (MTD %)
-
Actual CY YTD
-
Target CY YTD
-
YTD Status Icon
-
Target vs Actual (YTD %)
-
Previous Year YTD
-
CY vs PY (YTD %)
This structured layout makes performance analysis fast and accurate.
Click to Purchases Contract Management KPI Dashboard in Power BI
2. KPI Trend Page – Analyze Performance Trends
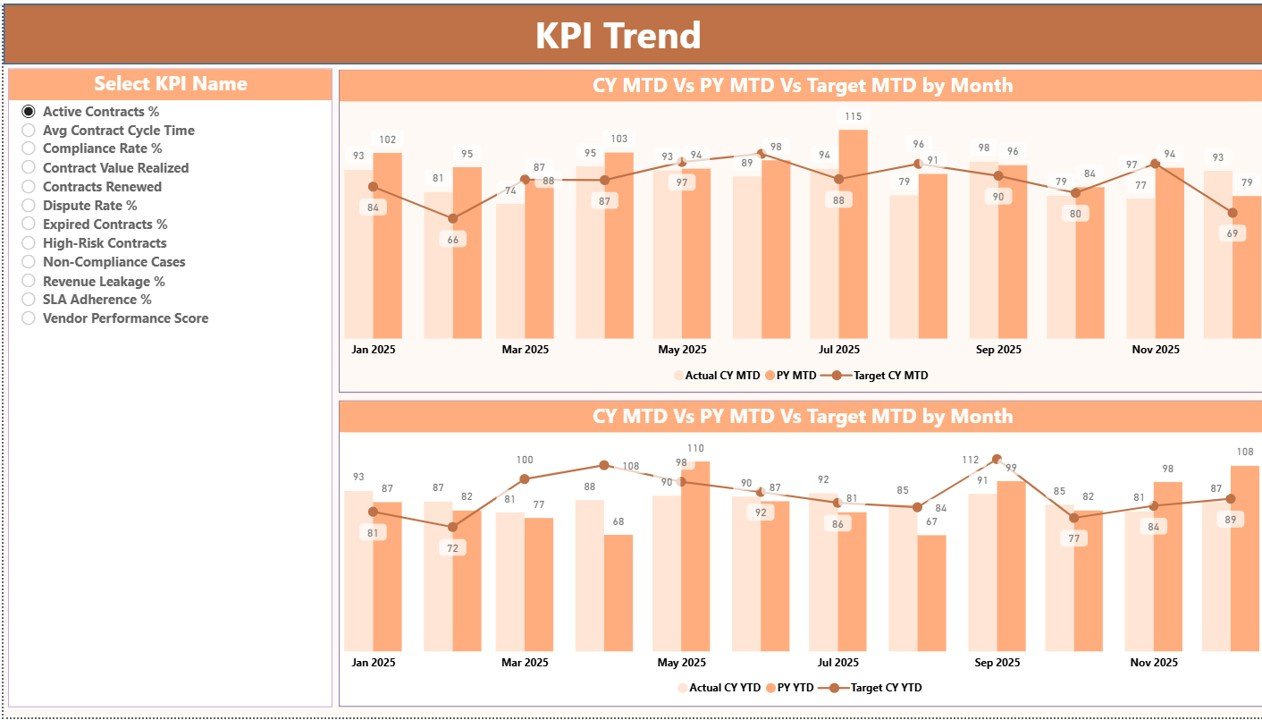
The KPI Trend Page helps users analyze performance trends for individual KPIs.
How the KPI Trend Page Works
🔽 KPI Selection Slicer
On the left side, a slicer allows you to select a KPI name.
Once selected, all visuals update automatically.
📊 Combo Charts for MTD and YTD
The page displays two combo charts:
-
MTD Actual, Target, and Previous Year
-
YTD Actual, Target, and Previous Year
These charts help you understand whether performance improves or declines over time.
3. KPI Definition Page – Drill-Through Details
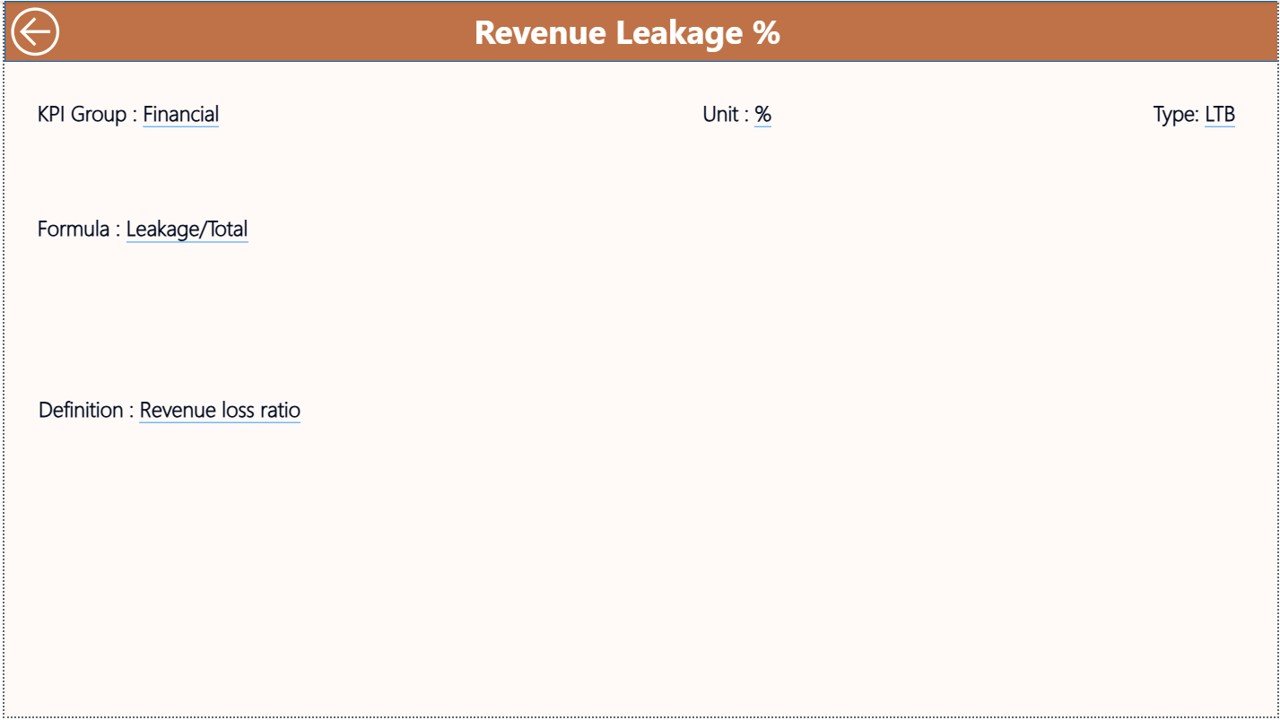
The KPI Definition Page is a hidden drill-through page designed to provide detailed KPI information.
Features of KPI Definition Page
-
Displays KPI Formula
-
Shows KPI Definition
-
Provides KPI context and logic
You can drill through from the Summary Page to access this information. To return, simply click the back button located at the top-left corner.
Excel Data Source Used in This Dashboard
The data source for this Power BI dashboard is an Excel file. This file contains three structured worksheets.
Click to Purchases Contract Management KPI Dashboard in Power BI
1. Input_Actual Sheet – Enter Actual KPI Values
In this sheet, you enter:
-
KPI Name
-
Month (first date of the month)
-
Actual MTD values
-
Actual YTD values
This sheet captures real performance data.
2. Input_Target Sheet – Enter Target KPI Values
In this sheet, you enter:
-
KPI Name
-
Month (first date of the month)
-
Target MTD values
-
Target YTD values
Targets help measure performance gaps.
3. KPI Definition Sheet – Define KPI Structure
In this sheet, you enter:
-
KPI Number
-
KPI Group
-
KPI Name
-
Unit
-
Formula
-
KPI Definition
-
KPI Type (LTB or UTB)
This ensures KPI consistency across the dashboard.
How Does This Dashboard Improve Contract Decisions?
By combining performance data, comparisons, and trends, this dashboard supports better decision-making.
-
Managers detect risks early
-
Missed targets become visible instantly
-
Compliance improves
-
Contract renewals become data-driven
Therefore, organizations shift from reactive contract management to proactive performance control.
Click to Purchases Contract Management KPI Dashboard in Power BI
Advantages of Contract Management KPI Dashboard in Power BI
Using this dashboard offers multiple advantages.
✅ Real-Time Performance Visibility
Instant insights using interactive visuals.
✅ Improved Compliance Tracking
Quickly identify missed KPIs.
✅ Time-Saving Analytics
Automated calculations replace manual reports.
✅ Stronger Accountability
Clear targets improve ownership.
✅ Scalable and Flexible
Easily extend KPIs as business grows.
Click to Purchases Contract Management KPI Dashboard in Power BI
Best Practices for Contract Management KPI Dashboard in Power BI
To get the most value, follow these best practices.
📌 Define Relevant Contract KPIs
Align KPIs with business and compliance goals.
📌 Update Excel Data Regularly
Ensure actual and target data stays current.
📌 Review Trends Monthly
Focus on patterns rather than single values.
📌 Use Drill-Through Features
Encourage users to explore KPI definitions.
📌 Maintain Clean KPI Definitions
Avoid confusion by keeping KPI logic clear.
Who Can Use This Dashboard?
This dashboard is ideal for:
-
Contract managers
-
Legal and compliance teams
-
Procurement professionals
-
Finance teams
-
Senior leadership
Anyone with basic Power BI knowledge can use it effectively.
Conclusion
The Contract Management KPI Dashboard in Power BI is a powerful analytics solution for tracking contract performance with clarity and confidence.
Instead of relying on static reports, this ready-to-use dashboard delivers real-time insights, trend analysis, and KPI transparency. By monitoring MTD, YTD, targets, and previous year performance, organizations gain full visibility and control over contract management.
If your goal is to reduce risk, improve compliance, and make smarter contract decisions, this Power BI dashboard is the right solution.
Click to Purchases Contract Management KPI Dashboard in Power BI
Frequently Asked Questions (FAQs)
❓ What is a Contract Management KPI Dashboard in Power BI?
It is a Power BI dashboard designed to track and analyze contract performance KPIs.
❓ Does this dashboard support MTD and YTD analysis?
Yes, it supports both Month-to-Date and Year-to-Date performance tracking.
❓ Is Excel required for this dashboard?
Yes, Excel is used as the data source for actuals, targets, and KPI definitions.
❓ Can I customize KPIs in this dashboard?
Yes, you can easily modify KPIs through the Excel data source.
❓ Do I need advanced Power BI skills?
No, basic Power BI knowledge is enough to use this dashboard.
Click to Purchases Contract Management KPI Dashboard in Power BI
Visit our YouTube channel to learn step-by-step video tutorials