The toy and games industry moves fast. Customer preferences change quickly, seasonal demand impacts sales heavily, and margins depend on smart pricing and discount strategies. Because of this, businesses in the toy and games sector must rely on accurate data analysis instead of assumptions.
That is exactly why a Toy and Games Industry Dashboard in Excel becomes a powerful decision-making tool.
This article explains what a Toy and Games Industry Dashboard in Excel is, how it works, why it matters, and how each dashboard page delivers actionable insights. Moreover, you will explore its advantages, best practices, and frequently asked questions. By the end, you will clearly understand how this dashboard helps toy manufacturers, wholesalers, distributors, and retailers gain full control over sales and profitability.
Click to Purchases Toy and Games Industry Dashboard in Excel
What Is a Toy and Games Industry Dashboard in Excel?
A Toy and Games Industry Dashboard in Excel is a ready-to-use, interactive reporting solution that analyzes sales, costs, profits, discounts, and trends across products, brands, regions, and sales channels.
Instead of reviewing multiple Excel sheets or manual reports, this dashboard brings all critical metrics into one structured view. As a result, business users can quickly monitor performance and identify improvement areas.
Moreover, the dashboard updates automatically when users refresh the data. Therefore, teams save time and focus more on decision-making rather than manual reporting.
Why Do Toy and Games Businesses Need a Dashboard in Excel?
Toy and games businesses face several data challenges. Sales fluctuate during festivals, holidays, and school seasons. Discount strategies affect margins. Multiple brands and product categories complicate performance tracking.
Because of these challenges, Excel dashboards help in several ways:
-
They consolidate data from multiple sources
-
They highlight profit and loss trends clearly
-
They support fast, data-driven decisions
-
They reduce dependency on manual reports
In addition, Excel remains familiar, flexible, and cost-effective. Therefore, many organizations prefer Excel dashboards over expensive BI tools.
How Does the Toy and Games Industry Dashboard in Excel Work?
The dashboard works through a structured Excel file that includes:
-
Data Sheet – stores raw transactional data
-
Support Sheet – manages calculations and mappings
-
Dashboard Pages – display insights using pivot charts
-
Page Navigator – enables seamless page navigation
-
Slicers – filter data by region, category, brand, channel, or month
Users only need to update the data sheet. After refreshing pivot tables, the dashboard updates automatically.
What Are the Key Features of the Toy and Games Industry Dashboard in Excel?
This dashboard includes thoughtfully designed features that enhance usability and analysis.
Page Navigator for Easy Navigation
The Page Navigator, located on the left side, allows users to switch between dashboard pages instantly. Because of this, users avoid scrolling and confusion.
Right-Side Slicers for Interactive Filtering
Each dashboard page includes right-side slicers. These slicers help users filter insights by specific dimensions such as region, brand, product category, or month.
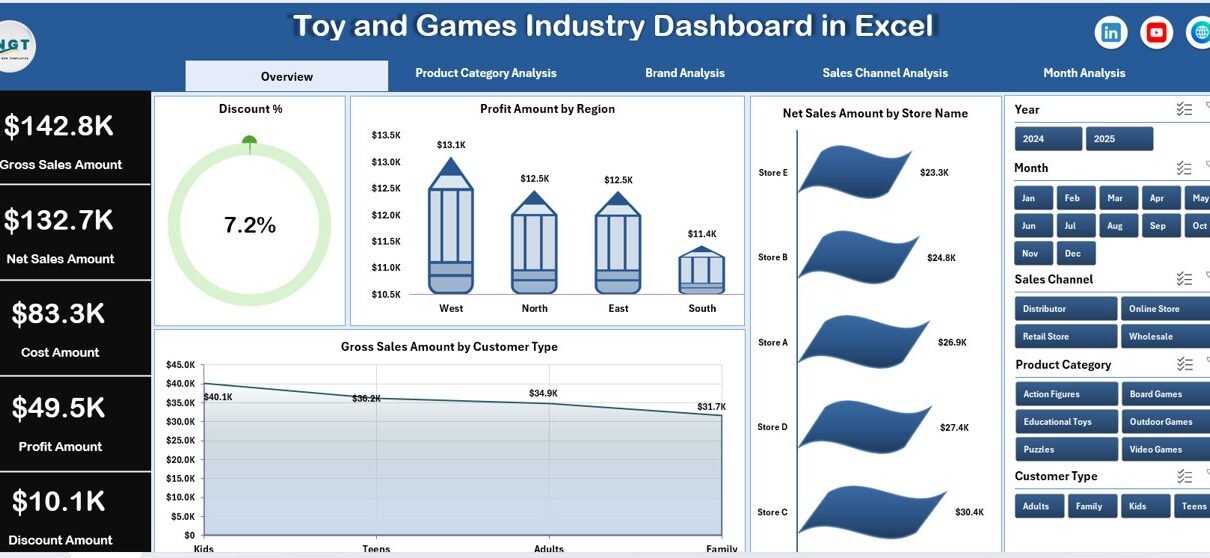
KPI Cards for Quick Performance Review
The Overview page includes four KPI cards. These cards provide a snapshot of key business metrics at a glance.
What Insights Does the Overview Page Provide?
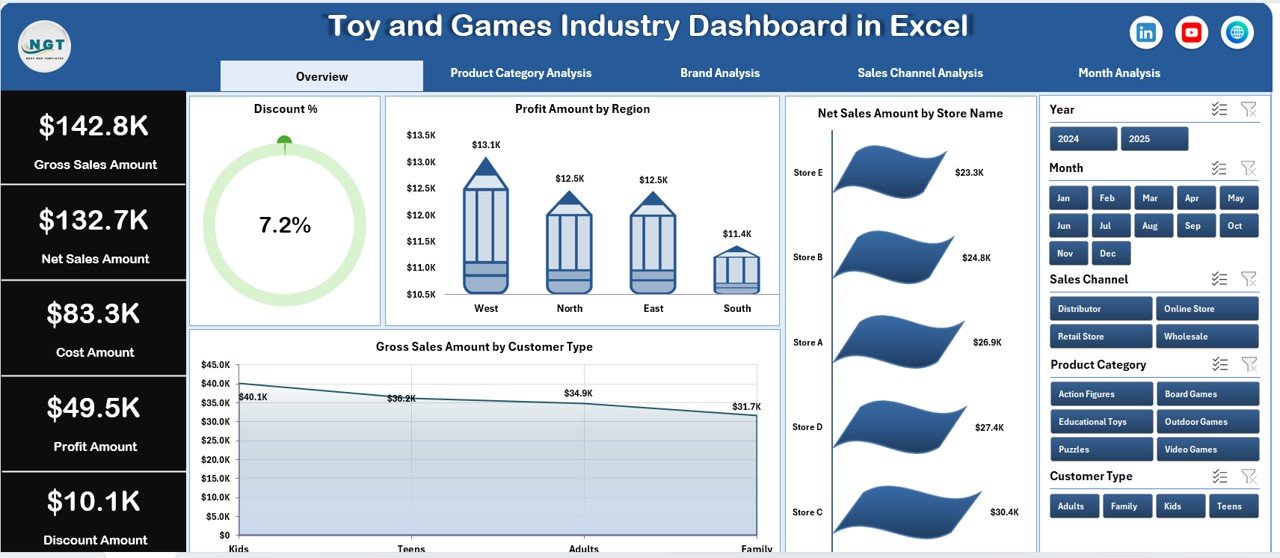
The Overview Page acts as the control center of the dashboard. It delivers high-level performance insights that help management assess business health instantly.
Key Elements of the Overview Page
-
Right-side slicers for quick filtering
-
Four KPI cards for summary metrics
-
Four visual charts for sales and profit analysis
Charts Included on the Overview Page
-
Discount % by Region – shows discount patterns across regions
-
Profit Amount by Region – highlights regional profitability
-
Net Sales Amount by Store Name – identifies top-performing stores
-
Gross Sales Amount by Customer Type – compares customer segments
Because of this structure, decision-makers can immediately identify profitable regions and customer types.
How Does Product Category Analysis Improve Decision-Making?

The Product Category Analysis page focuses on performance across toy and game categories.
Why Product Category Analysis Matters
Different categories behave differently. For example, educational toys, action figures, and board games follow unique demand cycles. Therefore, category-level insights help optimize inventory and pricing.
Charts Included in Product Category Analysis
-
Gross Sales Amount by Product Category
-
Discount % by Product Category
-
Profit Amount by Product Category
-
Net Sales Amount by Product Category
With these insights, businesses can easily identify high-margin categories and reduce discounts on underperforming products.
Click to Purchases Toy and Games Industry Dashboard in Excel
What Can You Learn from the Brand Analysis Page?

Brand performance plays a critical role in the toy and games industry. Some brands command premium pricing, while others rely on volume sales.
Purpose of Brand Analysis
The Brand Analysis page evaluates how each brand contributes to revenue, cost, and profit.
Charts Included in Brand Analysis
-
Gross Sales Amount by Brand
-
Cost Amount by Brand
-
Profit Amount by Brand
-
Net Sales Amount by Brand
As a result, businesses can prioritize strong brands and renegotiate costs with low-margin suppliers.
Why Is Sales Channel Analysis Important?
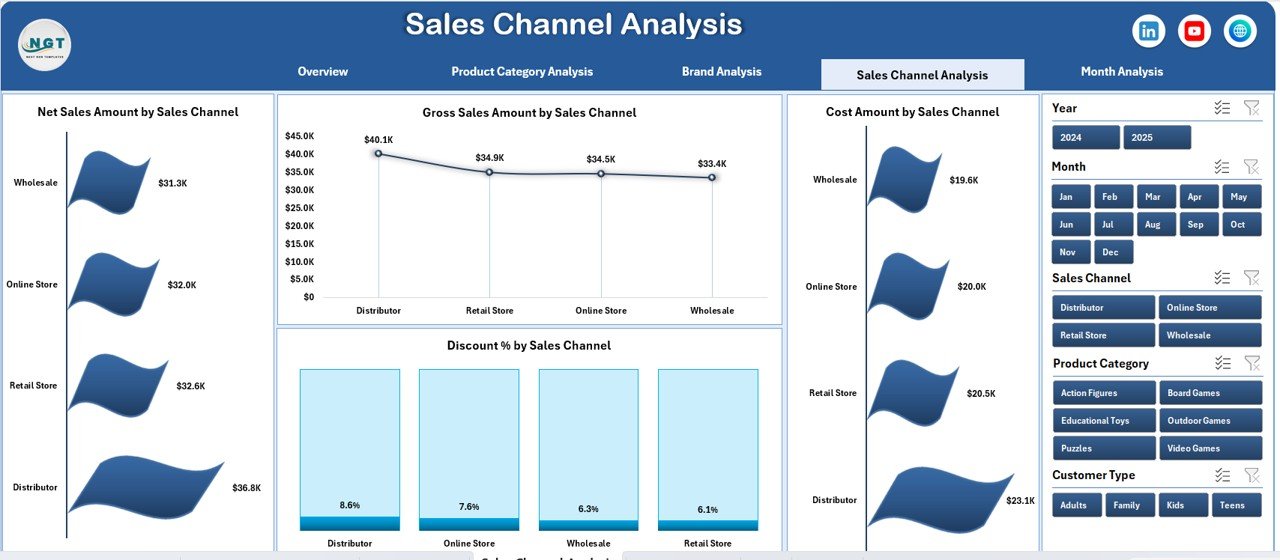
Toy and games businesses sell through multiple channels such as online stores, retail outlets, distributors, and marketplaces.
Benefits of Sales Channel Analysis
Sales channel analysis helps identify which channels generate maximum revenue and which channels reduce profitability due to high discounts or costs.
Charts Included in Sales Channel Analysis
-
Gross Sales Amount by Sales Channel
-
Cost Amount by Sales Channel
-
Discount % by Sales Channel
-
Net Sales Amount by Sales Channel
Because of this page, businesses can realign their sales strategies and improve channel profitability.
How Does Month Analysis Help Track Trends?
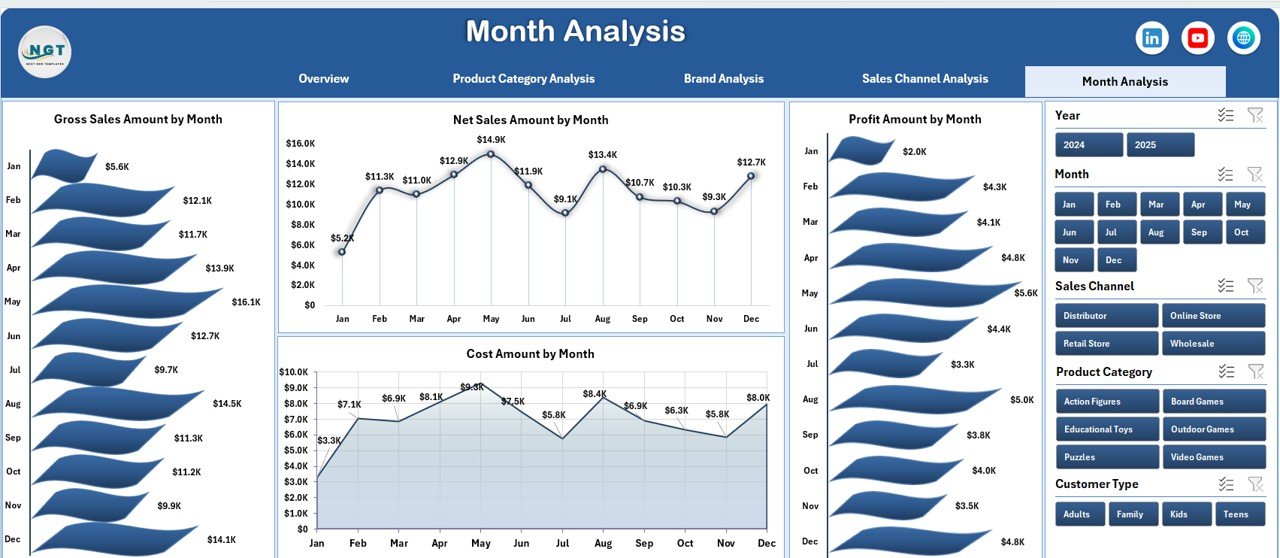
The Month Analysis page focuses on time-based trends. It helps businesses understand seasonality and monthly performance changes.
Why Monthly Analysis Matters
Toy sales fluctuate heavily due to festivals, holidays, and school seasons. Therefore, monthly insights help plan inventory and promotions effectively.
Charts Included in Month Analysis
-
Gross Sales Amount by Month
-
Cost Amount by Month
-
Profit Amount by Month
-
Net Sales Amount by Month
With this information, businesses can forecast demand and prepare for peak seasons confidently.
Click to Purchases Toy and Games Industry Dashboard in Excel
How Do the Data Sheet and Support Sheet Work?
Data Sheet
The Data Sheet stores transactional data such as:
-
Product category
-
Brand
-
Sales channel
-
Region
-
Customer type
-
Sales amount
-
Cost amount
-
Discount percentage
Users can add or update records without breaking the dashboard.
Support Sheet
The Support Sheet manages calculations, mappings, and helper columns. It ensures smooth pivot table functionality and accurate metrics.
Advantages of Toy and Games Industry Dashboard in Excel
A Toy and Games Industry Dashboard in Excel offers several strategic advantages.
Key Advantages
-
✅ Centralized sales and profit visibility
-
✅ Easy-to-use Excel interface
-
✅ Interactive slicers and charts
-
✅ Quick identification of profitable products
-
✅ Better pricing and discount decisions
-
✅ Improved inventory planning
-
✅ Cost-effective analytics solution
Because of these benefits, this dashboard suits both small businesses and large enterprises.
Who Can Use This Dashboard?
This dashboard supports a wide range of users:
-
Toy manufacturers
-
Game distributors
-
Retail store owners
-
E-commerce managers
-
Sales and finance teams
-
Business owners and analysts
Since it uses Excel, no advanced technical skills are required.
Best Practices for the Toy and Games Industry Dashboard in Excel
Following best practices ensures maximum dashboard effectiveness.
1. Maintain Clean Data
Always validate data entries before refreshing the dashboard. Clean data improves accuracy.
2. Update Data Regularly
Frequent updates ensure real-time insights and better decisions.
3. Use Slicers Wisely
Apply slicers to analyze one dimension at a time for clearer insights.
4. Track Profit Along with Sales
High sales do not always mean high profit. Always monitor profit trends.
5. Review Monthly Trends
Monthly analysis helps identify seasonality and demand shifts.
6. Share Insights with Teams
Use dashboard visuals during meetings to align teams around data.
How Does This Dashboard Support Business Growth?
This dashboard helps businesses grow by:
-
Improving pricing strategies
-
Optimizing product portfolios
-
Strengthening high-performing brands
-
Reducing unnecessary discounts
-
Enhancing forecasting accuracy
As a result, organizations gain stronger financial control and competitive advantage.
Conclusion: Is a Toy and Games Industry Dashboard in Excel Worth Using?
Absolutely.
A Toy and Games Industry Dashboard in Excel transforms raw data into clear, actionable insights. It simplifies performance tracking across products, brands, channels, and time periods. Moreover, it empowers decision-makers to act quickly and confidently.
If you want better visibility, stronger profit control, and smarter sales strategies, this dashboard becomes an essential business tool.
Frequently Asked Questions (FAQs)
What is a Toy and Games Industry Dashboard in Excel?
It is an Excel-based analytical dashboard that tracks sales, costs, profits, discounts, and trends for toy and games businesses.
Can beginners use this dashboard?
Yes. The dashboard uses standard Excel features and requires no advanced technical skills.
Does the dashboard support filtering?
Yes. Right-side slicers allow interactive filtering across all pages.
Can I customize the dashboard?
Yes. Users can add new charts, KPIs, or filters based on business needs.
Does it support monthly trend analysis?
Yes. The Month Analysis page provides detailed monthly performance insights.
Is Excel suitable for industry dashboards?
Yes. Excel offers flexibility, affordability, and ease of use, making it ideal for dashboards.
Visit our YouTube channel to learn step-by-step video tutorials