The cosmetics and skincare industry moves fast. New products launch every month, trends change quickly, and customer preferences evolve constantly. Because of this, beauty brands, distributors, and retailers cannot rely on static reports or gut feelings anymore. Instead, they need real-time, visual, and data-driven insights.
That is exactly where a Cosmetics and Skincare Dashboard in Power BI becomes essential.
This detailed guide explains what a Cosmetics and Skincare Dashboard in Power BI is, why it matters, how it works, and how each dashboard page supports smarter decisions. Moreover, you will learn about its advantages, best practices, and frequently asked questions. By the end, you will clearly understand how this dashboard helps beauty businesses improve sales, profitability, and strategic planning.
Click to Purchases Cosmetics and Skincare Dashboard in Power BI
What Is a Cosmetics and Skincare Dashboard in Power BI?
A Cosmetics and Skincare Dashboard in Power BI is an interactive analytics solution designed to track, analyze, and visualize beauty product sales data in one centralized view.
Instead of working with multiple Excel files or manual summaries, this dashboard transforms raw sales data into clear charts, KPI cards, and trend analysis. As a result, decision-makers can quickly understand performance across regions, brands, product categories, stores, and time periods.
Moreover, because it is built in Power BI, the dashboard offers:
-
Interactive slicers
-
Real-time filtering
-
Dynamic visuals
-
Easy scalability
Consequently, teams move faster and make better decisions.
Why Do Cosmetics and Skincare Businesses Need a Power BI Dashboard?
Cosmetics and skincare businesses deal with high-volume, multi-dimensional data. Therefore, managing this data without a structured dashboard creates serious challenges.
Common Challenges Without a Dashboard
-
Sales data scattered across files
-
No clear visibility into profitability
-
Difficulty tracking discounts and margins
-
Time-consuming manual reporting
-
Limited insights into brand or store performance
However, a Power BI dashboard solves all these problems by offering instant clarity.
How Does a Cosmetics and Skincare Dashboard in Power BI Work?
The dashboard works by connecting your sales data to Power BI and presenting it in a structured format. Typically, the data includes:
-
Product details
-
Brand names
-
Store names
-
Regions
-
Sales amounts
-
Discounts
-
Profit figures
-
Monthly timelines
After loading the data, Power BI creates interactive visuals that update automatically when you apply slicers. Therefore, users can analyze performance from multiple angles in seconds.
What Are the Key Pages in a Cosmetics and Skincare Dashboard in Power BI?
This dashboard includes five powerful analytical pages, each designed to answer specific business questions.
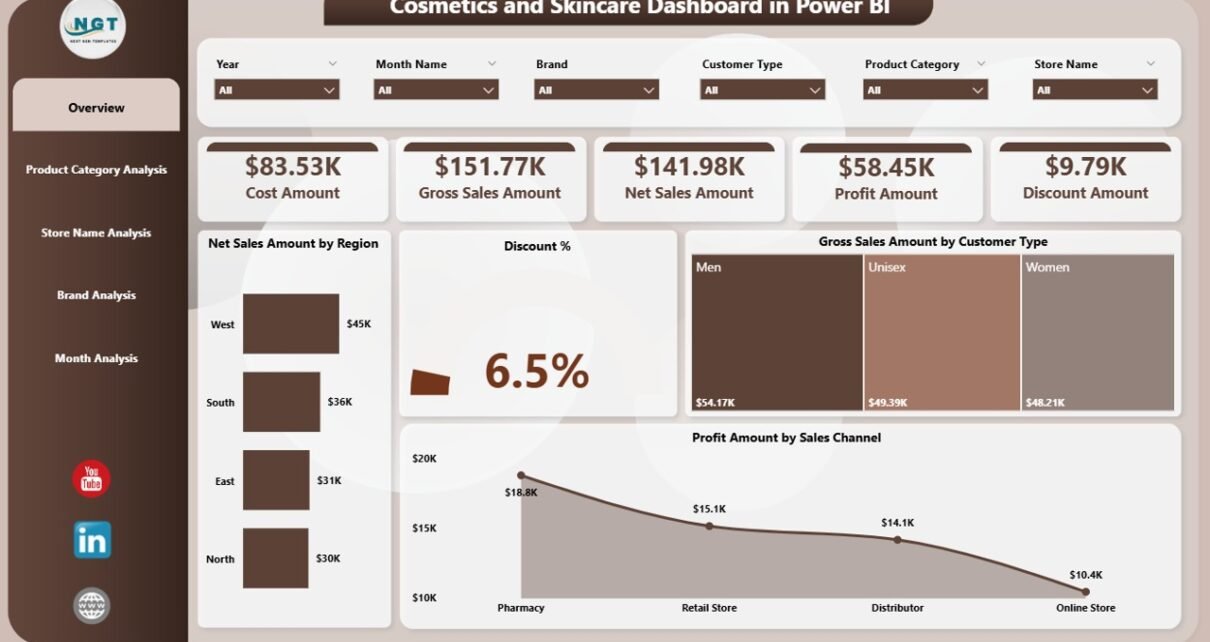
1. Overview Page: How Is the Business Performing at a Glance?
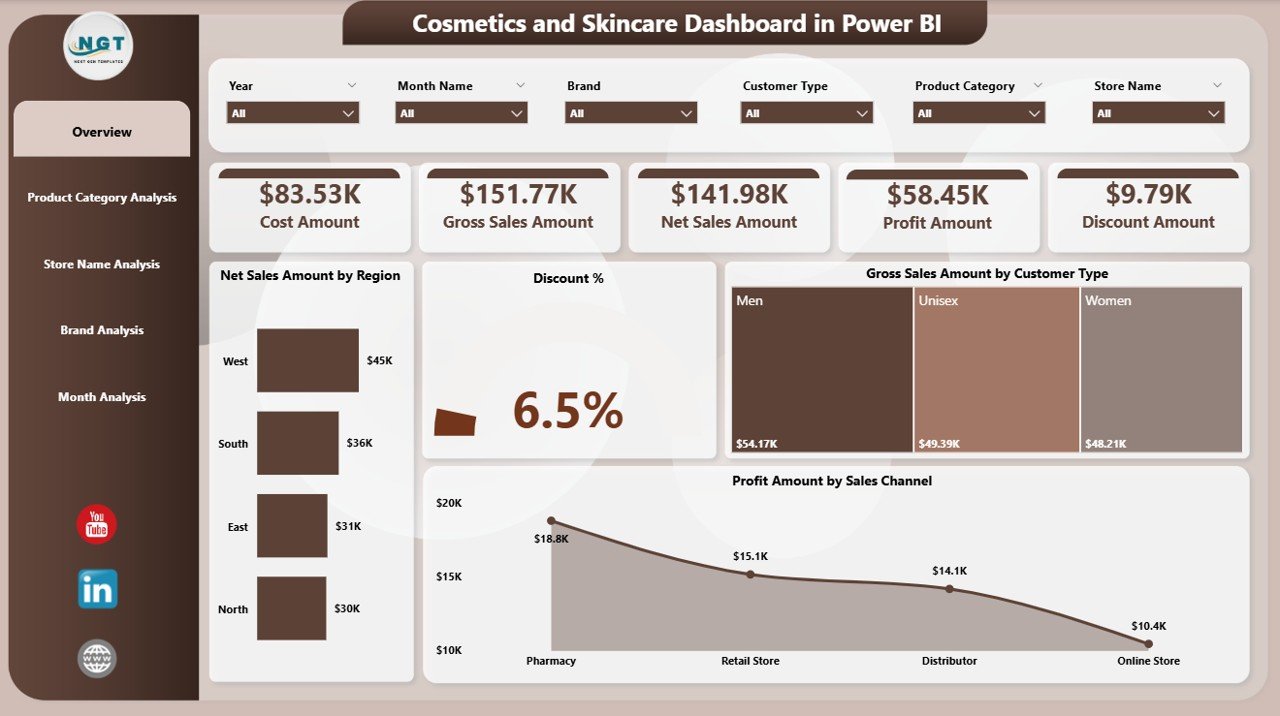
The Overview Page acts as the control center of the dashboard. It provides a high-level snapshot of overall performance.
Key Features of the Overview Page
-
Interactive slicers for quick filtering
-
KPI cards for instant metrics
-
Summary visuals for fast insights
KPI Cards on the Overview Page
-
Net Sales Amount by Region
-
Discount Percentage
-
Gross Sales Amount by Customer Type
-
Profit Amount by Sales Channel
Because these KPIs appear at the top, leadership teams can instantly assess performance without digging into details.
Why the Overview Page Matters
-
Saves time during reviews
-
Supports quick decision-making
-
Highlights problem areas immediately
2. Product Category Analysis: Which Categories Drive the Most Value?
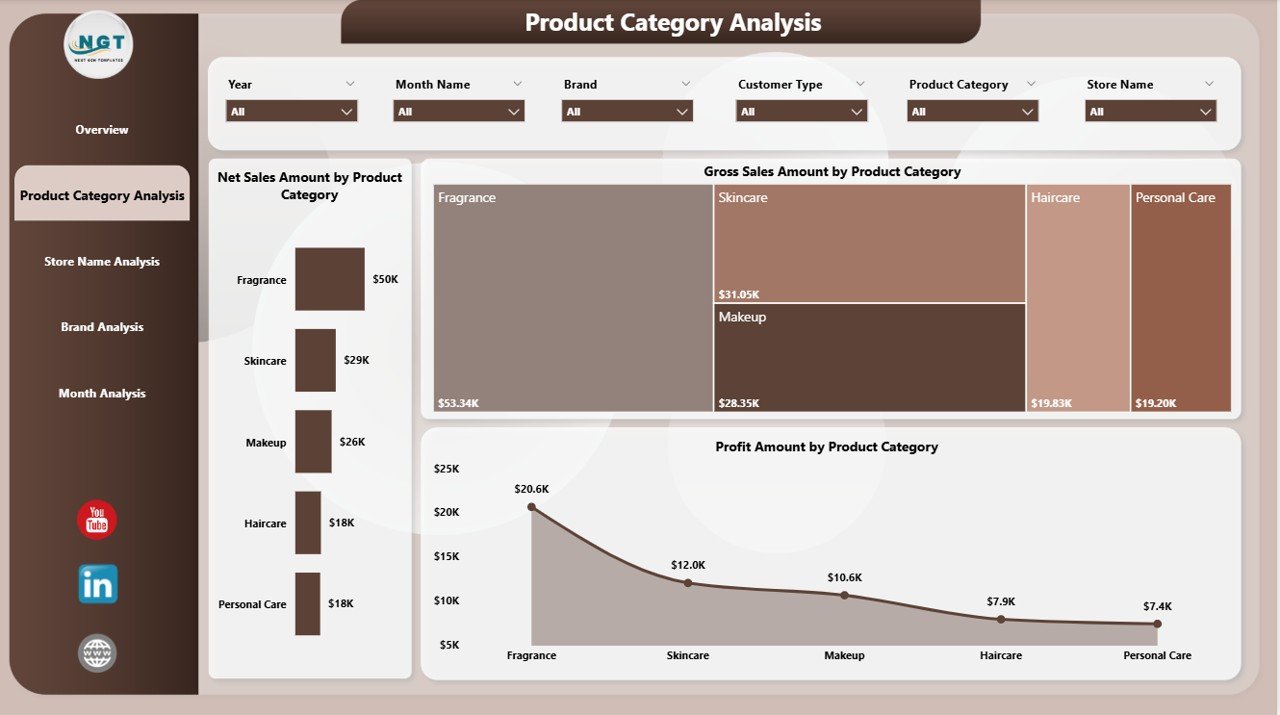
The Product Category Analysis Page focuses on category-level performance. Since cosmetics and skincare portfolios include multiple product lines, category insights become critical.
Charts Included on This Page
-
Net Sales Amount by Product Category
-
Gross Sales Amount by Product Category
-
Profit Amount by Product Category
With these visuals, users can instantly identify:
-
Top-performing categories
-
Low-margin product groups
-
Growth opportunities
Business Impact of Category Analysis
-
Improves product mix decisions
-
Helps optimize inventory planning
-
Supports pricing and promotion strategies
-
Click to Purchases Cosmetics and Skincare Dashboard in Power BI
3. Name Analysis: Which Stores Perform Best?
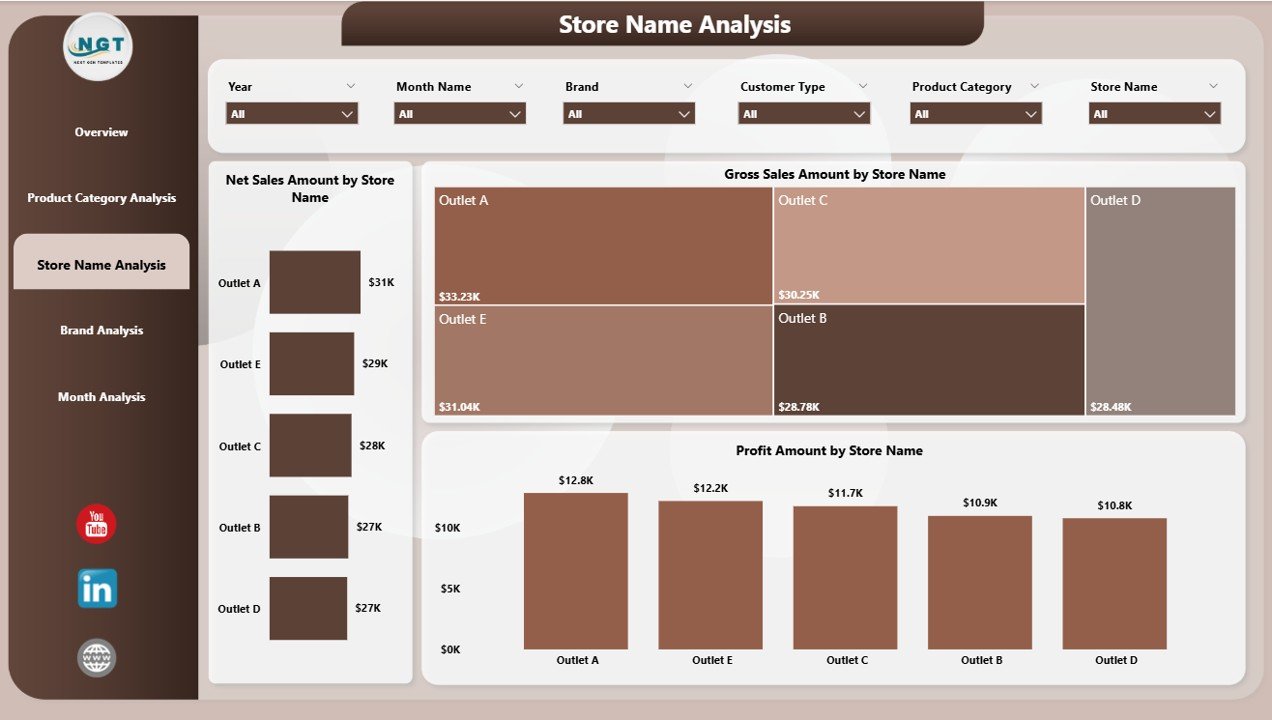
The Store Name Analysis Page evaluates performance across individual stores. Since store-level variations can significantly affect results, this page provides deep clarity.
Charts Available on This Page
-
Net Sales Amount by Store Name
-
Gross Sales Amount by Store Name
-
Profit Amount by Store Name
By using slicers, users can compare stores by:
-
Region
-
Brand
-
Category
-
Month
Why Store Analysis Is Important
-
Identifies high-performing locations
-
Flags underperforming stores early
-
Supports store-level strategy improvements
4. Brand Analysis: Which Brands Generate Maximum Profit?
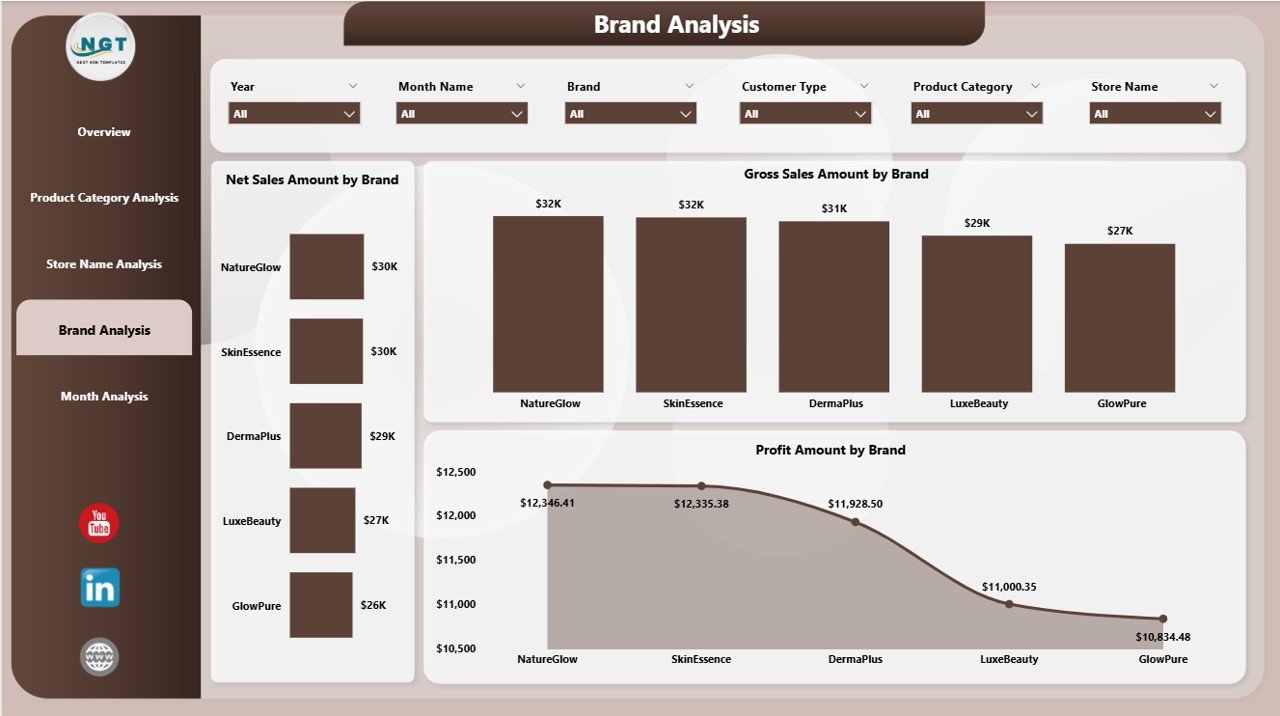
The Brand Analysis Page focuses on brand-level insights. Since cosmetics companies often manage multiple brands, this analysis becomes extremely valuable.
Charts Included
-
Net Sales Amount by Brand
-
Gross Sales Amount by Brand
-
Profit Amount by Brand
These visuals clearly show:
-
Strongest brands
-
Brands with high discounts but low profit
-
Brand-wise growth trends
Strategic Benefits of Brand Analysis
-
Improves brand portfolio management
-
Supports marketing investment decisions
-
Helps refine brand positioning
5. Month Analysis: How Do Sales Trends Change Over Time?
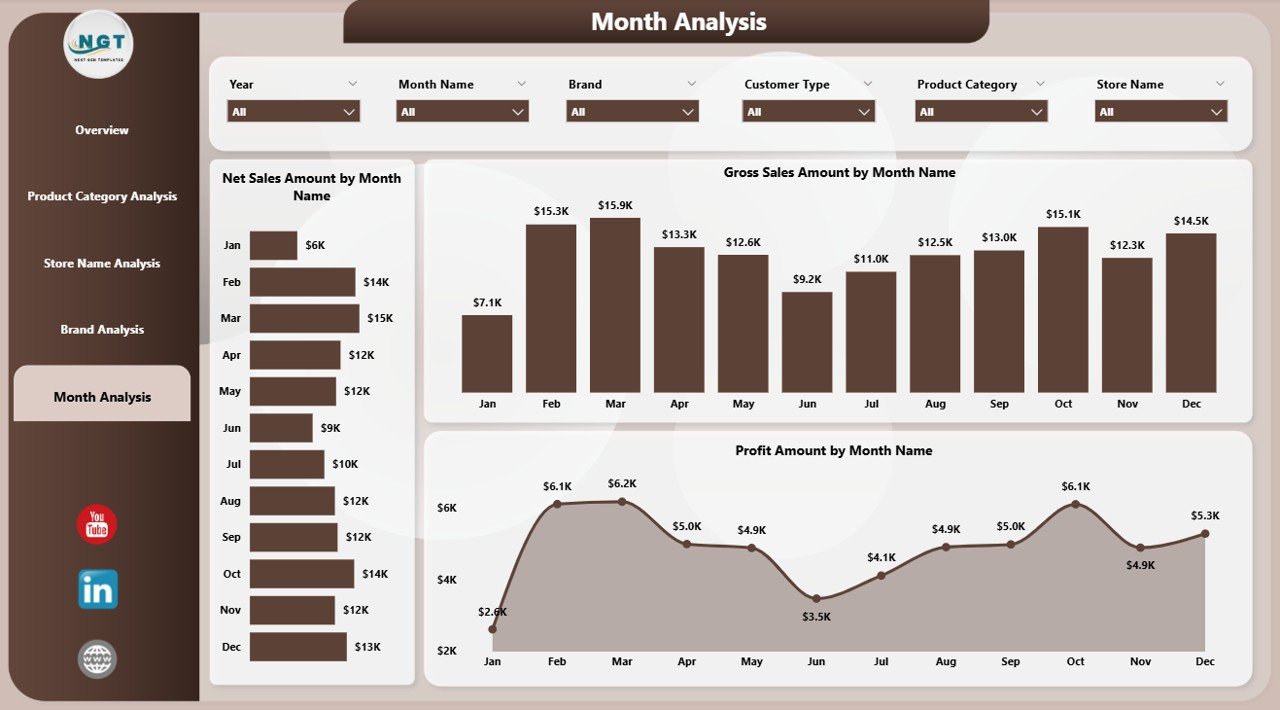
The Month Analysis Page highlights time-based performance. This page helps teams understand seasonality and trends.
Charts on the Month Analysis Page
-
Net Sales Amount by Month
-
Gross Sales Amount by Month
-
Profit Amount by Month
Because the data appears monthly, businesses can:
-
Track growth patterns
-
Identify seasonal peaks
-
Plan promotions more effectively
Who Should Use a Cosmetics and Skincare Dashboard in Power BI?
This dashboard benefits multiple stakeholders across the organization.
Ideal Users
-
Business owners
-
Sales managers
-
Marketing teams
-
Finance teams
-
Retail managers
-
Operations leaders
Because the dashboard remains intuitive, even non-technical users can extract insights easily.
Advantages of a Cosmetics and Skincare Dashboard in Power BI
A Power BI dashboard delivers measurable business value. Below are the key advantages.
1. Real-Time Sales Visibility
The dashboard updates instantly when data changes. As a result, teams always work with the latest numbers.
2. Improved Profitability Analysis
Because profit metrics appear across pages, businesses can quickly identify margin issues.
3. Faster Decision-Making
Visual insights replace lengthy reports. Therefore, decisions happen faster.
4. Better Discount Control
Tracking discount percentages helps protect margins.
5. Stronger Strategic Planning
Click to Purchases Cosmetics and Skincare Dashboard in Power BI
Historical and trend analysis supports better forecasting.
How Does This Dashboard Improve Decision-Making?
Decision-making improves because:
-
Data appears in one place
-
Insights remain visual and interactive
-
Filters allow quick comparisons
As a result, teams move from reactive reporting to proactive planning.
Best Practices for the Cosmetics and Skincare Dashboard in Power BI
To get maximum value, businesses should follow these best practices.
1. Maintain Clean Data
Always ensure consistent naming for brands, categories, and stores.
2. Update Data Regularly
Frequent data refresh ensures accurate insights.
3. Use Slicers Wisely
Limit slicers to key dimensions to avoid clutter.
4. Focus on Actionable KPIs
Track metrics that directly support decisions.
5. Train Users
A short training session improves adoption and usage.
How Can This Dashboard Support Business Growth?
This dashboard supports growth by:
-
Identifying profitable products
-
Highlighting expansion opportunities
-
Improving operational efficiency
-
Reducing reporting time
Consequently, teams focus more on strategy and less on manual work.
What Makes Power BI Ideal for Cosmetics and Skincare Analytics?
Power BI works well because it offers:
-
High-performance visuals
-
Strong data modeling
-
Easy scalability
-
Secure sharing
Moreover, it integrates seamlessly with Excel and databases.
Can Small and Medium Beauty Businesses Use This Dashboard?
Yes, absolutely. Power BI works for businesses of all sizes. Even small brands benefit from:
-
Better visibility
-
Improved control
-
Faster insights
Conclusion: Why Should You Use a Cosmetics and Skincare Dashboard in Power BI?
A Cosmetics and Skincare Dashboard in Power BI transforms raw sales data into meaningful insights. It simplifies reporting, improves visibility, and supports smarter decisions across the organization.
Because the dashboard covers overview, product categories, stores, brands, and monthly trends, it delivers a complete performance picture. Moreover, its interactive nature empowers teams to explore data independently.
In today’s competitive beauty market, data-driven decisions create the biggest advantage. Therefore, adopting a Power BI dashboard is no longer optional—it is essential.
Frequently Asked Questions (FAQs)
What is a Cosmetics and Skincare Dashboard in Power BI?
It is an interactive analytics dashboard that tracks sales, profit, discounts, and trends for beauty products.
Who can use this dashboard?
Sales teams, finance teams, marketing managers, and business owners can all use it.
Does the dashboard support real-time analysis?
Yes, it updates automatically when data refreshes.
Can I customize the dashboard?
Yes, Power BI allows full customization based on business needs.
Is Power BI suitable for small beauty brands?
Yes, Power BI works well for both small and large businesses.
What data do I need to build this dashboard?
You need sales data with product, brand, store, region, and date details.
Visit our YouTube channel to learn step-by-step video tutorials