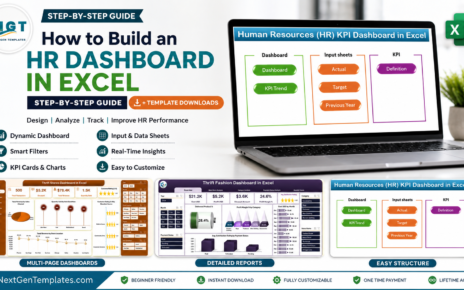
Corporate secretarial work plays a critical role in ensuring legal compliance, governance, and transparency within an organization. However, when teams track secretarial activities using scattered Excel files, emails, or manual registers, control reduces quickly. As a result, deadlines get missed, risks increase, and management visibility drops.
That is exactly where a Corporate Secretarial KPI Dashboard in Excel becomes a powerful solution.
In this detailed and SEO-friendly guide, you will learn what a Corporate Secretarial KPI Dashboard in Excel is, why it matters, how it works, its key features, advantages, best practices, and frequently asked questions. Moreover, you will understand how this ready-to-use Excel dashboard helps corporate secretarial teams track compliance KPIs with accuracy and confidence.
Click to Purchases Corporate Secretarial KPI Dashboard in Excel
What Is a Corporate Secretarial KPI Dashboard in Excel?
A Corporate Secretarial KPI Dashboard in Excel is a ready-to-use analytical template designed to monitor and analyze key performance indicators related to corporate secretarial and compliance activities.
Instead of managing multiple trackers, this dashboard centralizes all secretarial KPIs into one structured Excel file. As a result, secretarial teams can track statutory filings, board compliance, timelines, and performance trends in a visual and interactive manner.
Moreover, since the dashboard works fully inside Microsoft Excel, organizations do not need expensive compliance software or complex tools. You can update data easily, customize KPIs, and generate insights instantly.
Why Do Corporate Secretarial Teams Need KPI Dashboards?
Corporate secretarial teams handle multiple responsibilities every month. Therefore, they need complete visibility and control at all times.
A KPI dashboard helps because:
-
It tracks statutory and governance performance in real time
-
It highlights missed or delayed activities instantly
-
It supports management reviews and audits
-
It reduces dependency on manual tracking
-
It improves accountability across teams
Additionally, when leadership reviews compliance performance, a dashboard communicates insights far more clearly than raw Excel tables.
How Does a Corporate Secretarial KPI Dashboard in Excel Work?
The dashboard works using structured data tables, formulas, and dynamic visuals. Once users enter actual, target, and previous year values, the dashboard calculates performance automatically.
Moreover, slicers and drop-down selections allow users to analyze performance month-wise, KPI-wise, and year-to-date. As a result, the dashboard turns raw compliance data into actionable insights.
Key Features of the Corporate Secretarial KPI Dashboard in Excel
This ready-to-use dashboard includes 7 well-structured worksheets, each designed for a specific purpose. Let us understand each sheet in detail.
1. Home Sheet – Central Navigation Hub
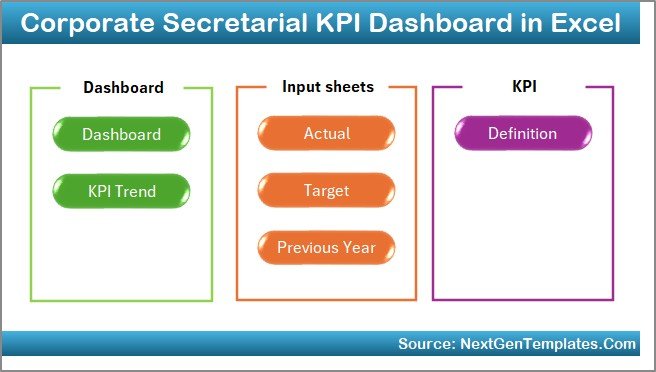
The Home Sheet acts as an index page for the entire dashboard.
Key Highlights:
-
Clean and professional layout
-
6 navigation buttons
-
One-click access to all worksheets
-
Improves user experience and usability
As a result, users can move across the dashboard easily without scrolling through Excel tabs.
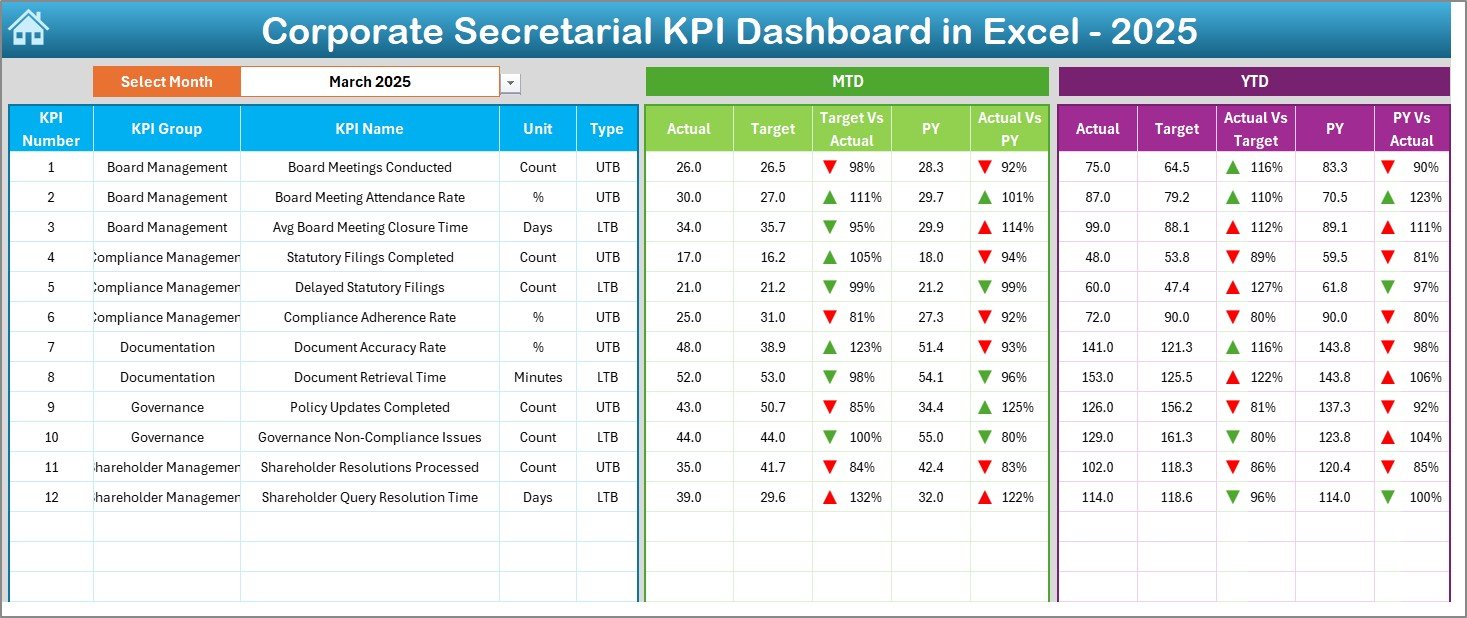
2. Dashboard Sheet – Complete KPI Performance View
The Dashboard Sheet is the heart of the entire template.
What Does This Sheet Show?
-
Month selection drop-down (Cell D3)
-
Automatic refresh of all KPI numbers
-
MTD (Month-to-Date) performance
-
YTD (Year-to-Date) performance
-
Target vs Actual comparison
-
Previous Year vs Actual comparison
Key Metrics Displayed:
-
MTD Actual, Target, Previous Year
-
YTD Actual, Target, Previous Year
-
Variance indicators using up/down arrows
-
Conditional formatting for quick insights
Because of this structure, management can instantly identify:
-
KPIs performing well
-
KPIs missing targets
-
Compliance trends across months
-
Click to Purchases Corporate Secretarial KPI Dashboard in Excel
3. KPI Trend Sheet – Deep Performance Analysis
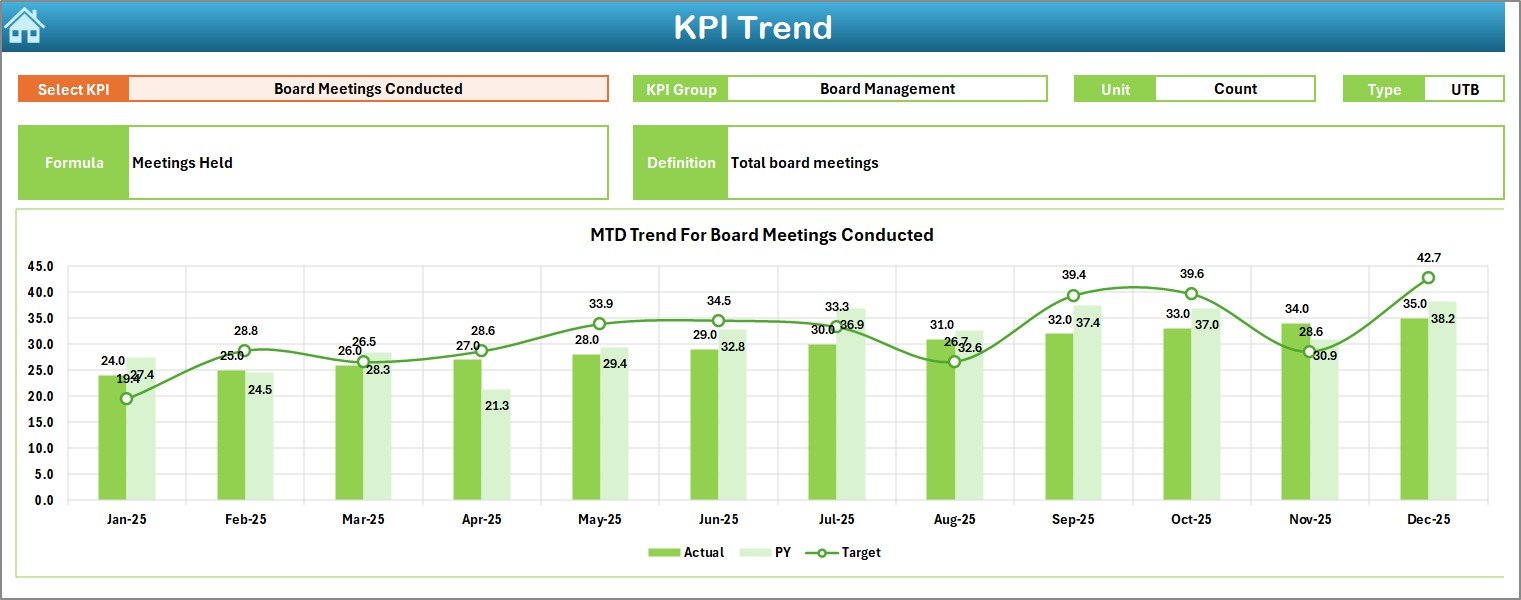
The KPI Trend Sheet allows users to analyze one KPI at a time.
How It Works:
-
Select KPI Name from drop-down (Cell C3)
-
Dashboard automatically updates KPI details
Information Displayed:
-
KPI Group
-
Unit of Measurement
-
KPI Type (Lower the Better / Upper the Better)
-
KPI Formula
-
KPI Definition
Visual Insights:
-
MTD Trend Chart (Actual, Target, PY)
-
YTD Trend Chart (Actual, Target, PY)
As a result, users can analyze long-term trends and identify improvement areas quickly.
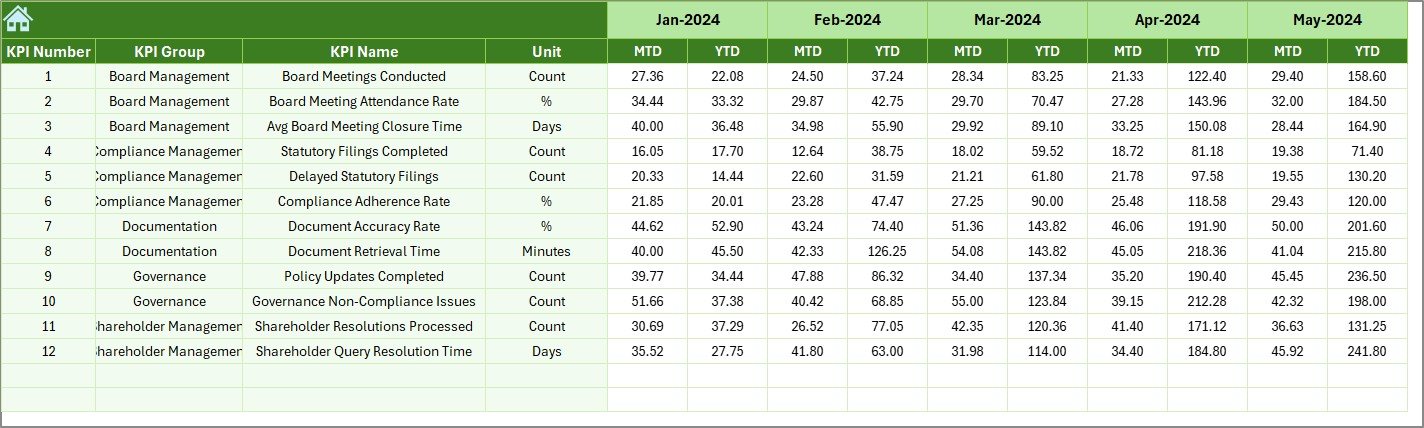
4. Actual Numbers Input Sheet – Current Year Data Entry
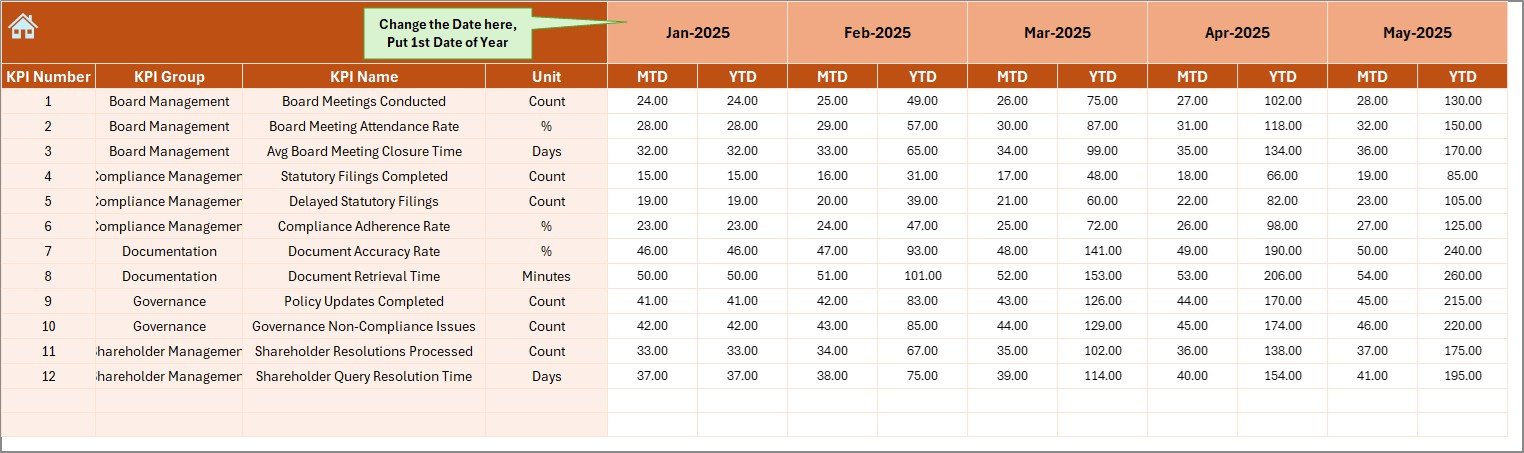
The Actual Numbers Input Sheet captures real performance data.
How to Use This Sheet:
-
Select the first month of the year in Cell E1
-
Enter MTD and YTD actual values
-
Data updates automatically across the dashboard
Because of this setup, users avoid repetitive manual calculations and reduce data errors.
Click to Purchases Corporate Secretarial KPI Dashboard in Excel
5. Target Sheet – Monthly and YTD Targets
The Target Sheet stores planned KPI values.
Key Benefits:
-
Enter MTD targets for each KPI
-
Enter YTD targets for long-term tracking
-
Supports realistic planning and benchmarking
Once targets are updated, the dashboard instantly compares them with actual performance.
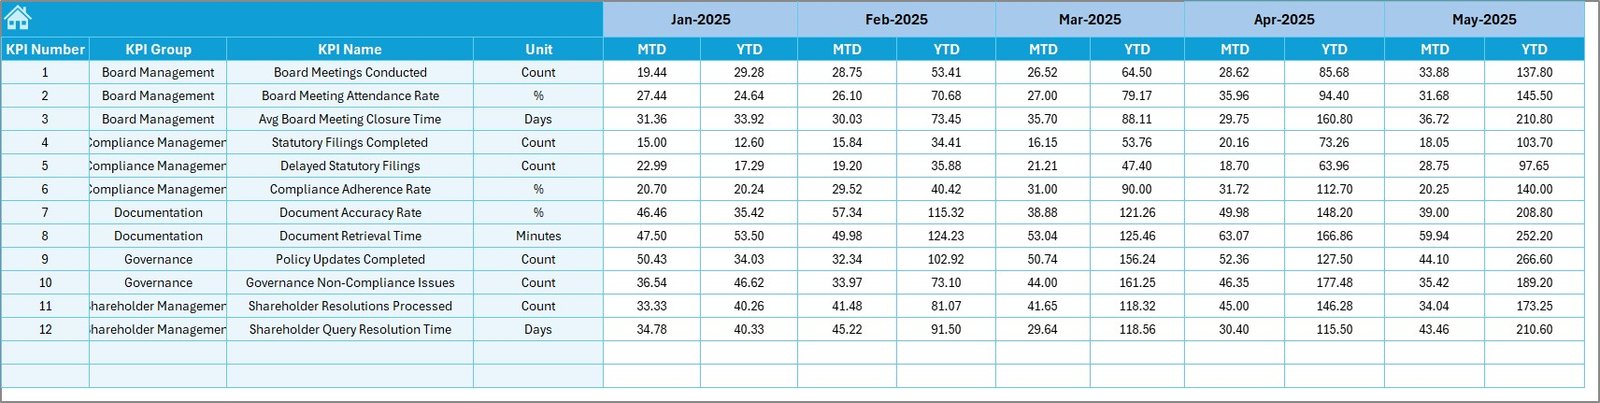
6. Previous Year Numbers Sheet – Year-over-Year Comparison
The Previous Year Numbers Sheet helps track historical performance.
Why This Sheet Matters:
-
Enables YoY analysis
-
Highlights improvement or decline
-
Supports audit and review discussions
Users enter previous year values using the same structure as the current year.
7. KPI Definition Sheet – KPI Governance and Clarity
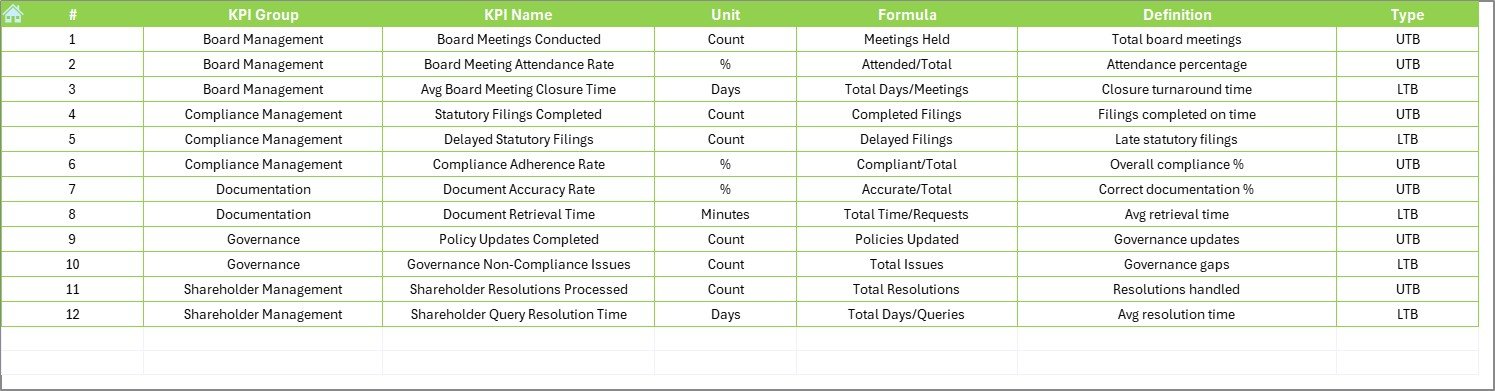
The KPI Definition Sheet ensures transparency and consistency.
Details Captured:
-
KPI Name
-
KPI Group
-
Unit
-
Formula
-
Definition
This sheet helps new users, auditors, and stakeholders understand KPIs clearly.
Click to Purchases Corporate Secretarial KPI Dashboard in Excel
What KPIs Can You Track Using This Dashboard?
You can track multiple corporate secretarial KPIs, such as:
-
Statutory filing completion rate
-
Board meeting compliance percentage
-
Delay in ROC filings
-
Regulatory non-compliance count
-
Annual return filing accuracy
-
Secretarial audit observations
Moreover, since the dashboard is flexible, you can customize KPIs based on your organization’s needs.
Advantages of Corporate Secretarial KPI Dashboard in Excel
Using this dashboard offers several business benefits.
1. Centralized Compliance Tracking
All KPIs stay in one structured Excel file. As a result, teams avoid scattered trackers.
2. Improved Visibility
Management gets instant insights into compliance performance.
3. Time Savings
Automated calculations reduce manual effort significantly.
4. Cost-Effective Solution
No need for expensive compliance software.
5. Audit-Ready Reporting
Clear data, trends, and comparisons support audits and reviews.
6. Easy Customization
Users can modify KPIs, targets, and formats easily.
Who Should Use a Corporate Secretarial KPI Dashboard?
This dashboard suits:
-
Corporate Secretarial Teams
-
Company Secretaries
-
Compliance Officers
-
Legal and Governance Teams
-
CFOs and Finance Heads
-
Internal Audit Teams
Both small organizations and large enterprises can benefit equally.
Best Practices for Corporate Secretarial KPI Dashboard in Excel
To get maximum value, follow these best practices.
1. Define Clear KPIs
Always define KPIs with clear formulas and definitions.
2. Update Data Regularly
Enter actual numbers monthly to maintain accuracy.
3. Review Trends, Not Just Numbers
Use trend charts to identify long-term issues.
4. Align Targets with Regulations
Set realistic targets based on statutory requirements.
5. Keep KPI Definitions Updated
Update definitions when regulations change.
6. Use Dashboard During Reviews
Use the dashboard in board and compliance meetings.
How This Dashboard Improves Decision-Making
Because the dashboard converts data into visuals, decision-makers can:
-
Identify compliance gaps quickly
-
Take corrective actions early
-
Track improvement over time
-
Support strategic governance decisions
As a result, organizations reduce risk and improve compliance maturity.
Conclusion: Why You Should Use a Corporate Secretarial KPI Dashboard in Excel
A Corporate Secretarial KPI Dashboard in Excel is no longer optional in today’s compliance-driven environment. Instead, it acts as a single source of truth for tracking secretarial performance, regulatory compliance, and governance effectiveness.
Since this dashboard is ready to use, flexible, and Excel-based, organizations can implement it immediately without technical complexity. Moreover, it improves visibility, accountability, and decision-making across all compliance activities.
Frequently Asked Questions (FAQs)
Click to Purchases Corporate Secretarial KPI Dashboard in Excel
What is a Corporate Secretarial KPI Dashboard in Excel?
It is an Excel-based dashboard that tracks corporate secretarial and compliance KPIs using structured data and visuals.
Is this dashboard suitable for small companies?
Yes, small companies can use it easily and scale it as they grow.
Do I need advanced Excel skills to use this dashboard?
No, basic Excel knowledge is sufficient.
Can I customize KPIs in the dashboard?
Yes, you can add, remove, or modify KPIs easily.
Does the dashboard support year-over-year comparison?
Yes, it includes a dedicated previous year comparison sheet.
Can this dashboard help during audits?
Yes, it provides clear, structured, and audit-ready compliance data.
Visit our YouTube channel to learn step-by-step video tutorials