Managing tax litigation has become more complex than ever. Because regulations change frequently and tax authorities demand strict compliance, organizations must track every tax case, appeal, and resolution carefully. However, when teams rely on scattered Excel files or static reports, they often lose control over deadlines, performance, and outcomes.
That is exactly where a Tax Litigation KPI Dashboard in Power BI becomes a powerful and practical solution.
In this detailed guide, you will learn what a Tax Litigation KPI Dashboard in Power BI is, how it works, why organizations need it, its key features, dashboard pages, data structure, advantages, best practices, and frequently asked questions. By the end, you will clearly understand how this dashboard supports smarter tax litigation management and better decision-making.
Click to buy Tax Litigation KPI Dashboard in Power BI
What Is a Tax Litigation KPI Dashboard in Power BI?
A Tax Litigation KPI Dashboard in Power BI is an interactive analytics solution designed to track, monitor, and analyze tax litigation performance using key performance indicators (KPIs).
Instead of reviewing multiple spreadsheets or legal reports, tax teams use one centralized Power BI dashboard to:
- Track ongoing tax cases and disputes
- Monitor targets versus actual performance
- Compare current year and previous year results
- Identify risk areas and compliance gaps
- Improve litigation strategy and outcomes
Because Power BI offers slicers, dynamic visuals, and drill-through features, users can analyze tax litigation data quickly and confidently.
Why Do Organizations Need a Tax Litigation KPI Dashboard in Power BI?
Tax litigation involves deadlines, penalties, case volumes, and financial exposure. Therefore, organizations need accurate and timely insights. However, manual tracking creates delays and errors.
A Tax Litigation KPI Dashboard in Power BI solves these challenges because it:
- Centralizes all litigation KPIs in one view
- Improves transparency and accountability
- Supports faster and data-driven decisions
- Reduces dependency on manual reporting
- Enhances compliance monitoring
As a result, organizations gain control over their tax litigation processes.
How Does a Tax Litigation KPI Dashboard in Power BI Work?
The dashboard uses Excel as a data source and Power BI as a visualization tool. Users update KPI data in Excel, and Power BI refreshes visuals automatically.
Data Flow Overview
- Enter actual values in the Excel file
- Enter target values for each KPI
- Define KPIs with formulas and descriptions
- Refresh Power BI dashboard
- Analyze MTD, YTD, and trend insights
Because this process remains simple, even non-technical users can maintain the dashboard easily.
What Are the Key Features of a Tax Litigation KPI Dashboard in Power BI?
This dashboard is a ready-to-use solution designed for tax teams, finance leaders, and compliance professionals.
Core Features
- Interactive slicers for Month and KPI Group
- Automated MTD and YTD calculations
- Target vs Actual performance tracking
- Previous Year comparison analysis
- KPI status indicators using icons
- Drill-through KPI definitions
Because of these features, users can focus on insights instead of manual work.
What Are the Pages in the Tax Litigation KPI Dashboard in Power BI?
The dashboard contains three structured pages, each designed for a specific purpose.
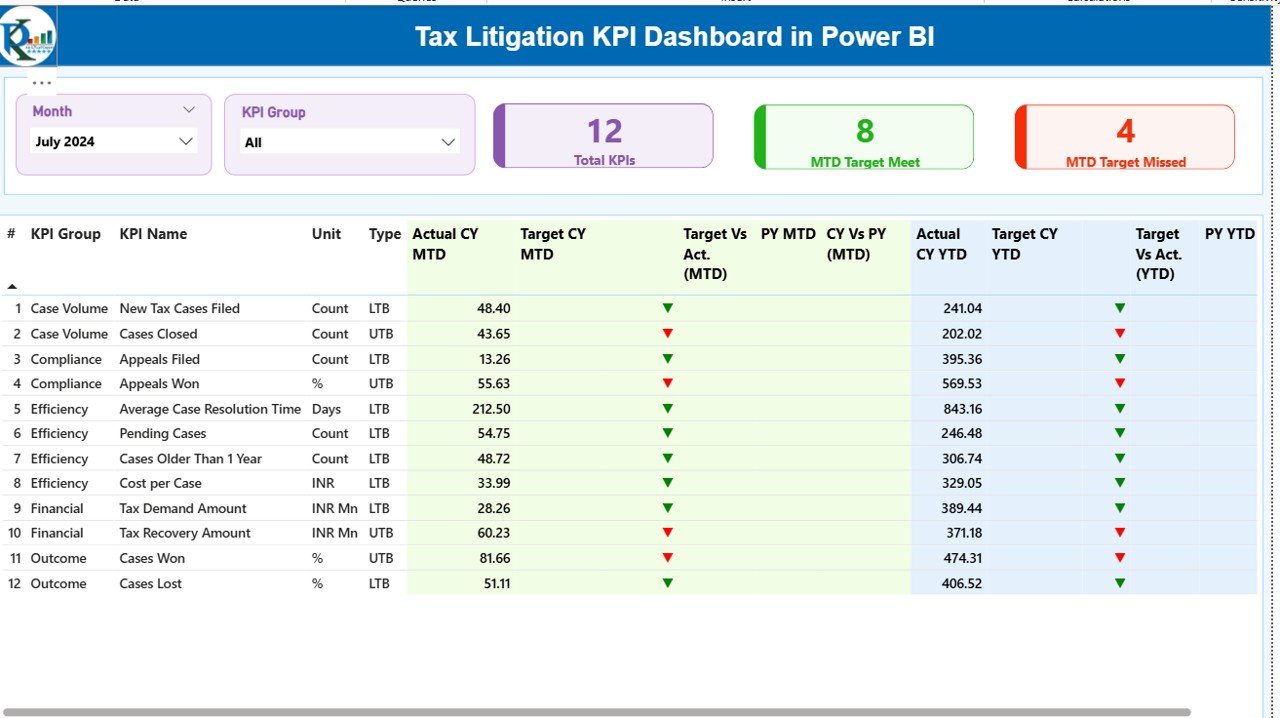
Summary Page
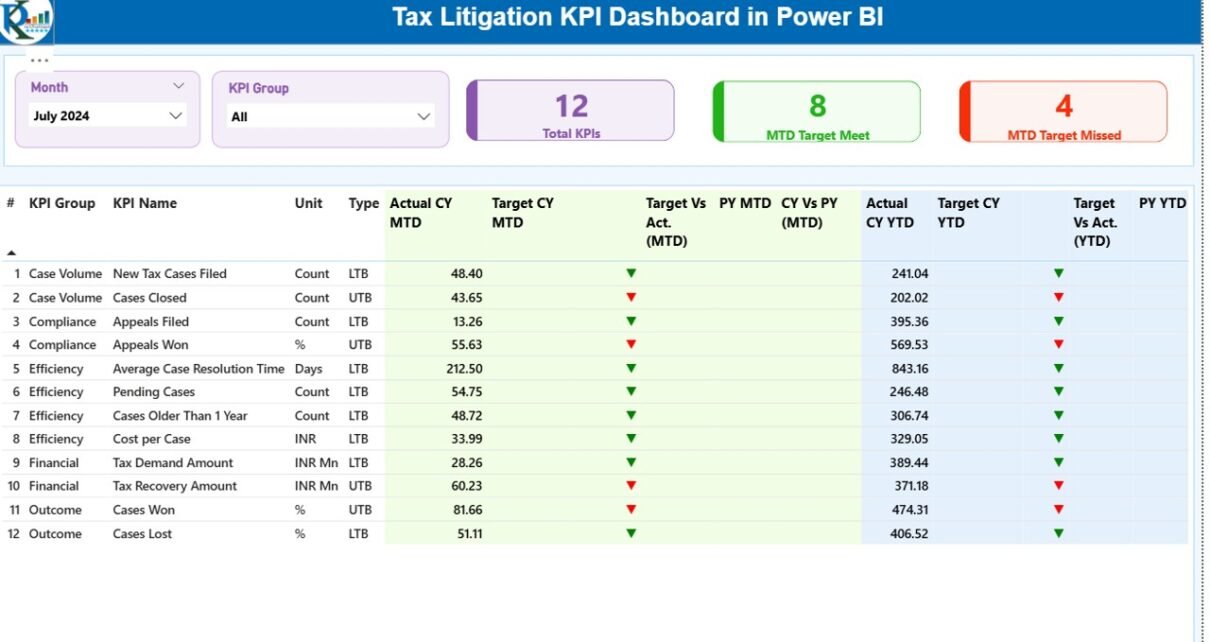
The Summary Page serves as the main overview of tax litigation performance.
Top Section – Filters and KPI Cards
At the top, the dashboard displays:
- Month slicer to select reporting period
- KPI Group slicer to filter categories
Additionally, three KPI cards show:
- Total KPIs count
- MTD Target Meet count
- MTD Target Missed count
These cards provide a quick performance snapshot.
Detailed KPI Table on the Summary Page
Below the cards, a detailed table displays critical KPI information:
- KPI Number – Sequence number of the KPI
- KPI Group – Category of the KPI
- KPI Name – Name of the KPI
- Unit – Unit of measurement
- Type – LTB (Lower the Better) or UTB (Upper the Better)
- Actual CY MTD – Current year actual MTD value
- Target CY MTD – Current year target MTD value
- MTD Icon – Red ▼ or Green ▲ to show performance
- Target vs Actual (MTD) – Actual / Target percentage
- PY MTD – Previous year MTD value
- CY vs PY (MTD) – Current vs Previous year comparison
- Actual CY YTD – Current year actual YTD value
- Target CY YTD – Current year target YTD value
- YTD Icon – Performance indicator for YTD
- Target vs Actual (YTD) – YTD Actual / Target percentage
- PY YTD – Previous year YTD value
- CY vs PY (YTD) – Year-over-year comparison
Because of this structure, users can analyze performance at a glance.
Click to buy Tax Litigation KPI Dashboard in Power BI
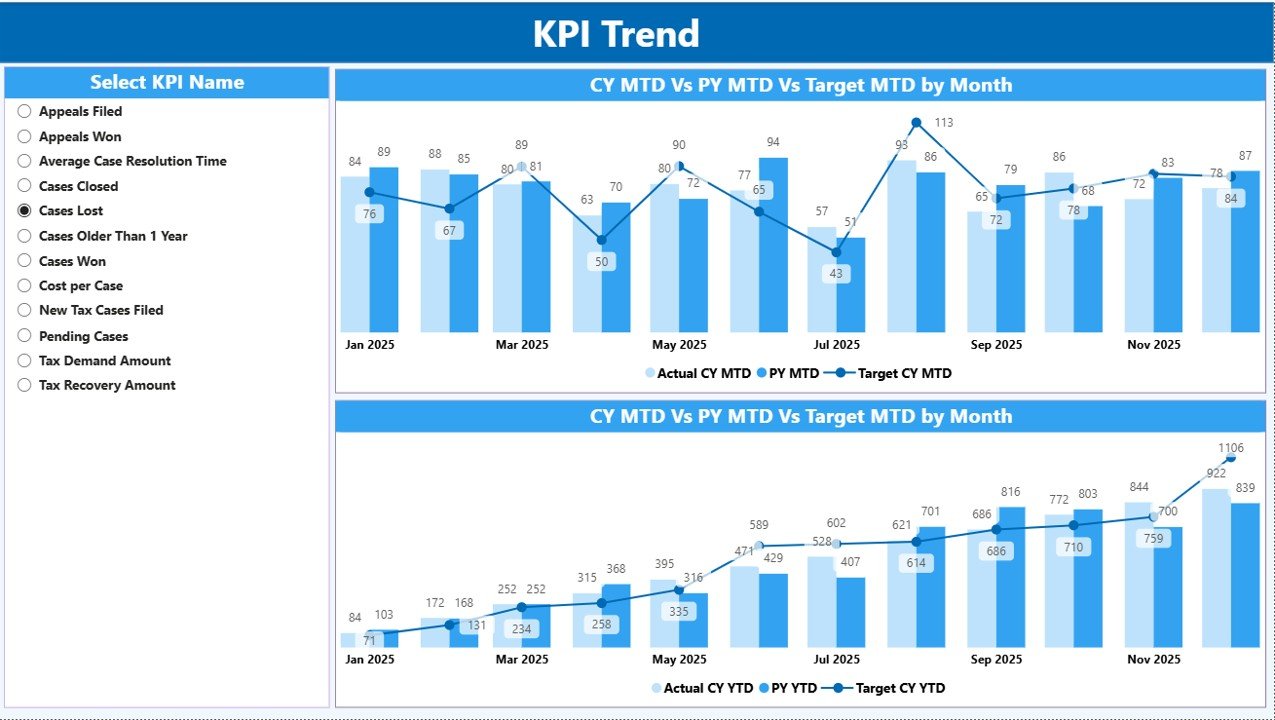
KPI Trend Page
The KPI Trend Page focuses on performance trends over time.
Key Highlights
- Two combo charts for MTD and YTD
- Comparison of Current Year Actual, Previous Year Actual, and Targets
- KPI Name slicer on the left
This page helps users identify patterns, growth, or decline across periods.
Click to buy Tax Litigation KPI Dashboard in Power BI
KPI Definition Page
Purpose of This Page
- Displays KPI Formula
- Explains KPI Definition
- Clarifies KPI Type (LTB or UTB)
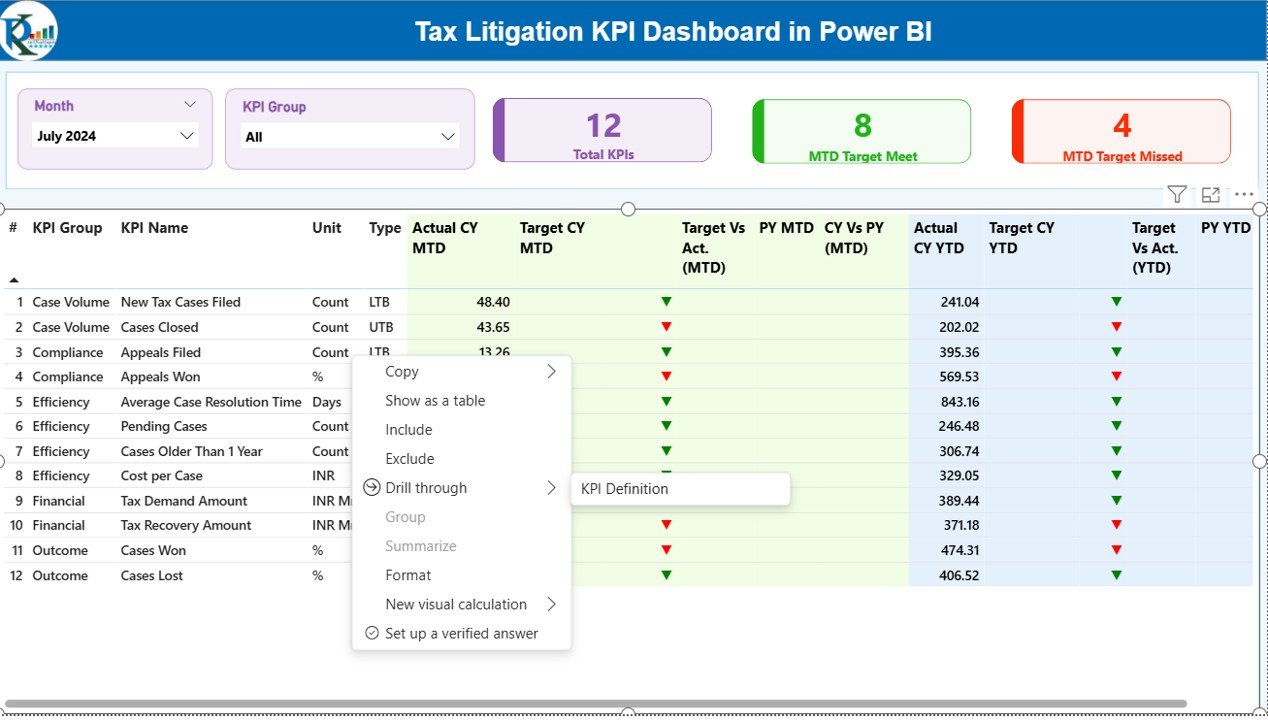
Although the page remains hidden, users can access it by drilling through from the Summary Page. The back button helps users return easily
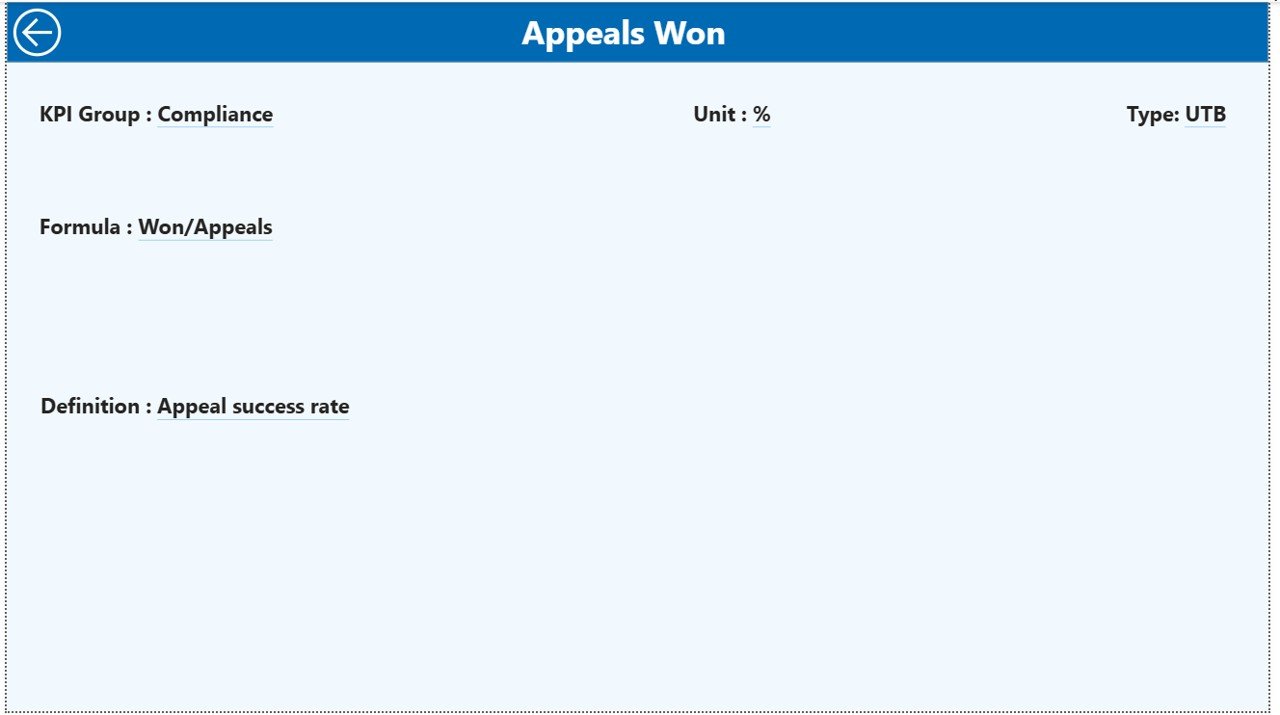
.Click to buy Tax Litigation KPI Dashboard in Power BI
What Excel Data Is Required for the Tax Litigation KPI Dashboard?
The dashboard uses an Excel file with three worksheets.
Input_Actual Sheet – How Do You Enter Actual Data?
In this sheet, users enter:
- KPI Name
- Month (first date of the month)
- MTD actual value
- YTD actual value
Because data entry remains simple, teams can update it monthly without errors.
Click to buy Tax Litigation KPI Dashboard in Power BI
Input_Target Sheet – How Do You Enter Target Data?
In this sheet, users enter:
- KPI Name
- Month (first date of the month)
- MTD target value
- YTD target value
Targets help measure performance against goals.
KPI Definition Sheet – Why Is KPI Definition Important?
This sheet defines each KPI clearly by capturing:
- KPI Number
- KPI Group
- KPI Name
- Unit
- Formula
- Definition
- Type (LTB or UTB)
Clear definitions ensure consistency and accurate analysis.
Advantages of a Tax Litigation KPI Dashboard in Power BI
Using a Tax Litigation KPI Dashboard in Power BI delivers multiple benefits.
Key Advantages
- Centralized tax litigation reporting
- Real-time MTD and YTD insights
- Clear target vs actual visibility
- Better risk identification
- Improved compliance monitoring
- Reduced manual reporting effort
- Faster decision-making
As a result, organizations improve both efficiency and control.
How Does This Dashboard Improve Decision-Making?
The dashboard transforms raw data into actionable insights. Because users can see trends, gaps, and comparisons instantly, they can:
- Prioritize high-risk cases
- Allocate resources effectively
- Improve litigation strategy
- Reduce penalties and delays
Therefore, decision-makers gain confidence in their actions.
Who Should Use a Tax Litigation KPI Dashboard in Power BI?
This dashboard suits multiple roles:
- Tax Managers
- Finance Leaders
- Compliance Officers
- Legal Teams
- Senior Management
Because the dashboard is user-friendly, both technical and non-technical users can benefit.
Best Practices for the Tax Litigation KPI Dashboard in Power BI
To get maximum value, organizations should follow these best practices.
Maintain Clean and Consistent Data
Always validate Excel inputs before refreshing the dashboard.
Update Data Regularly
Monthly updates ensure accurate MTD and YTD analysis.
Define KPIs Clearly
Clear KPI definitions avoid confusion and misinterpretation.
Use Slicers Effectively
Filter data by month and KPI group to focus analysis.
Monitor Trends, Not Just Numbers
Trend analysis helps identify long-term issues early.
Review Targets Periodically
Update targets when regulations or business conditions change.
How Does This Dashboard Compare to Manual Reporting?
Manual reporting requires time, effort, and repeated checks. In contrast, a Power BI dashboard:
- Automates calculations
- Reduces errors
- Saves time
- Improves accuracy
Therefore, organizations move from reactive to proactive management.
Conclusion: Why Should You Use a Tax Litigation KPI Dashboard in Power BI?
A Tax Litigation KPI Dashboard in Power BI provides a structured, automated, and insightful way to manage tax litigation performance. Because it combines Excel data with Power BI visuals, it offers clarity, speed, and accuracy.
By using this dashboard, organizations gain better control over litigation KPIs, improve compliance monitoring, and support smarter decisions. Ultimately, it transforms complex tax data into meaningful insights.
Frequently Asked Questions (FAQs)
What is the main purpose of a Tax Litigation KPI Dashboard in Power BI?
The main purpose is to track and analyze tax litigation KPIs in a centralized and interactive way.
Can non-technical users use this dashboard easily?
Yes, because the data source is Excel and the dashboard uses simple slicers and visuals.
How often should data be updated in the dashboard?
Organizations should update data monthly for accurate MTD and YTD reporting.
What does LTB and UTB mean in KPIs?
LTB means Lower the Better, while UTB means Upper the Better.
Can this dashboard support year-over-year analysis?
Yes, it compares current year and previous year performance for both MTD and YTD.
Does the dashboard support drill-through analysis?
Yes, users can drill through to the KPI Definition page for detailed explanations.
Can organizations customize KPIs in this dashboard?
Yes, users can modify KPIs easily by updating the KPI Definition sheet.
Visit our YouTube channel to learn step-by-step video tutorials
Watch the step-by-step video tutorial:
Click to buy Tax Litigation KPI Dashboard in Power BI