In today’s competitive market, companies must control every rupee they spend. However, procurement teams often struggle to track supplier costs, monitor budgets, and manage order delays. As a result, businesses face cost overruns, poor vendor performance, and long lead times.
So, how can you monitor total spend, budget variance, lead time, delayed orders, and regional performance in one interactive system?
You need a Procurement Spend Analysis Dashboard in Power BI.This powerful dashboard transforms raw procurement data into meaningful insights. Moreover, it helps procurement managers, finance teams, and leadership make faster and smarter decisions.
In this detailed guide, you will learn:
- What a Procurement Spend Analysis Dashboard in Power BI is
- Why businesses need it
- Detailed explanation of all 5 dashboard pages
- Key KPIs included
- Advantages of Procurement Spend Analysis Dashboard in Power BI
- Best Practices for the Procurement Spend Analysis Dashboard
- Frequently Asked Questions with Answers
Click to buy Procurement Spend Analysis Dashboard in Power BI
What Is a Procurement Spend Analysis Dashboard in Power BI?
A Procurement Spend Analysis Dashboard in Power BI is a ready-to-use business intelligence solution designed to track, analyze, and optimize procurement expenses.
It collects procurement data such as:
- Purchase Orders
- Budget Allocations
- Lead Time
- Department Spend
- Category Spend
- Regional Procurement
- Order Status
Then, it converts that data into visual reports using interactive charts and slicers.
As a result, you can:
- Track total procurement cost
- Compare budget vs actual spend
- Identify delayed orders
- Monitor average lead time
- Evaluate department-wise spending
- Analyze supplier performance
- Improve purchasing strategy
Therefore, instead of using multiple Excel files, you can use one smart Power BI dashboard.
Why Do Businesses Need a Procurement Spend Analysis Dashboard?
Procurement directly affects profit. Even small inefficiencies increase cost significantly. However, many organizations still rely on manual reports.
Because of that, they face:
- Budget overruns
- Poor supplier tracking
- Long lead times
- Delayed deliveries
- Lack of cost transparency
On the other hand, a Power BI dashboard solves these problems quickly.
Here’s Why It Matters:
- It provides real-time insights
- It improves cost control
- It reduces procurement delays
- It supports better vendor negotiation
- It increases operational efficiency
Therefore, companies that adopt spend analytics gain strong financial control.
Detailed Explanation of All 5 Dashboard Pages
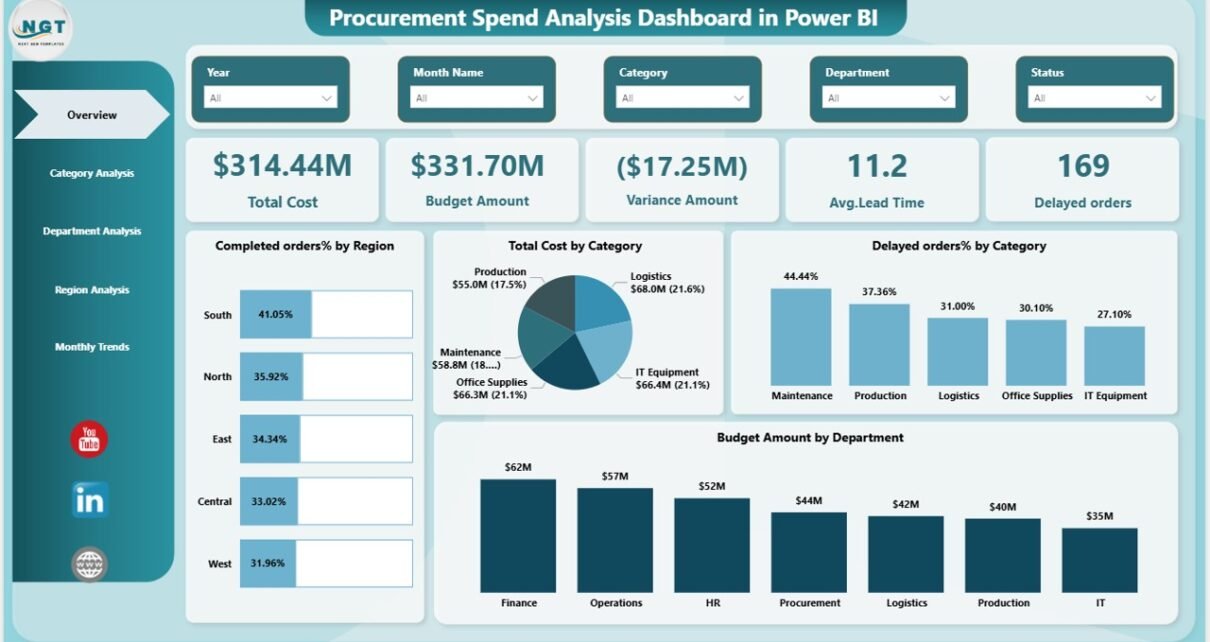
Overview Page – What Does It Show?
The Overview page works as the control center of the dashboard. It gives a quick snapshot of procurement performance.
KPI Cards Included:
- Total Cost – Shows total procurement spend
- Budget Amount – Displays allocated budget
- Variance Amount – Shows difference between budget and actual spend
- Average Lead Time – Indicates supplier delivery efficiency
- Delayed Orders – Counts late deliveries
Additionally, this page includes:
- Completed Orders % by Region
Because this page shows high-level metrics, management can immediately identify performance gaps.
For example:
- If variance is high, cost control needs attention.
- If lead time increases, supplier performance needs review.
- If delayed orders rise, procurement planning must improve.
Therefore, the Overview page supports quick decision-making.

Click to buy Procurement Spend Analysis Dashboard in Power BI
Category Analysis – Which Category Drives the Most Spend?
Procurement teams must understand category-level performance. Hence, this page focuses on category insights.
Charts Included:
- Average Lead Time by Category
- Completed Orders % by Category
- Pending Orders % by Category
- Budget Amount by Category
With this page, you can:
- Identify high-cost categories
- Detect slow-moving categories
- Monitor performance category-wise
- Improve sourcing strategy

Click to buy Procurement Spend Analysis Dashboard in Power BI
Department Analysis – Which Department Spends the Most?
Every department uses procurement differently. Therefore, this page highlights department-level insights.
Charts Included:
- Total Orders by Department
- Delayed Orders % by Department
- Average Lead Time by Department
- Total Cost by Department
Because of this analysis, management can:
- Compare department spending
- Control overspending departments
- Identify departments causing delays
- Allocate budget more efficiently

Click to buy Procurement Spend Analysis Dashboard in Power BI
Region Analysis – How Does Procurement Perform Across Regions?
Large organizations operate in multiple regions. Therefore, regional spend tracking becomes essential.
Charts Included:
- Completed Orders % by Region
- Total Orders by Region
- Delayed Orders % by Region
- Budget Amount and Total Cost by Region
This page helps you:
- Compare regional efficiency
- Detect cost-heavy regions
- Identify regions with supplier delays
- Improve logistics strategy

Click to buy Procurement Spend Analysis Dashboard in Power BI
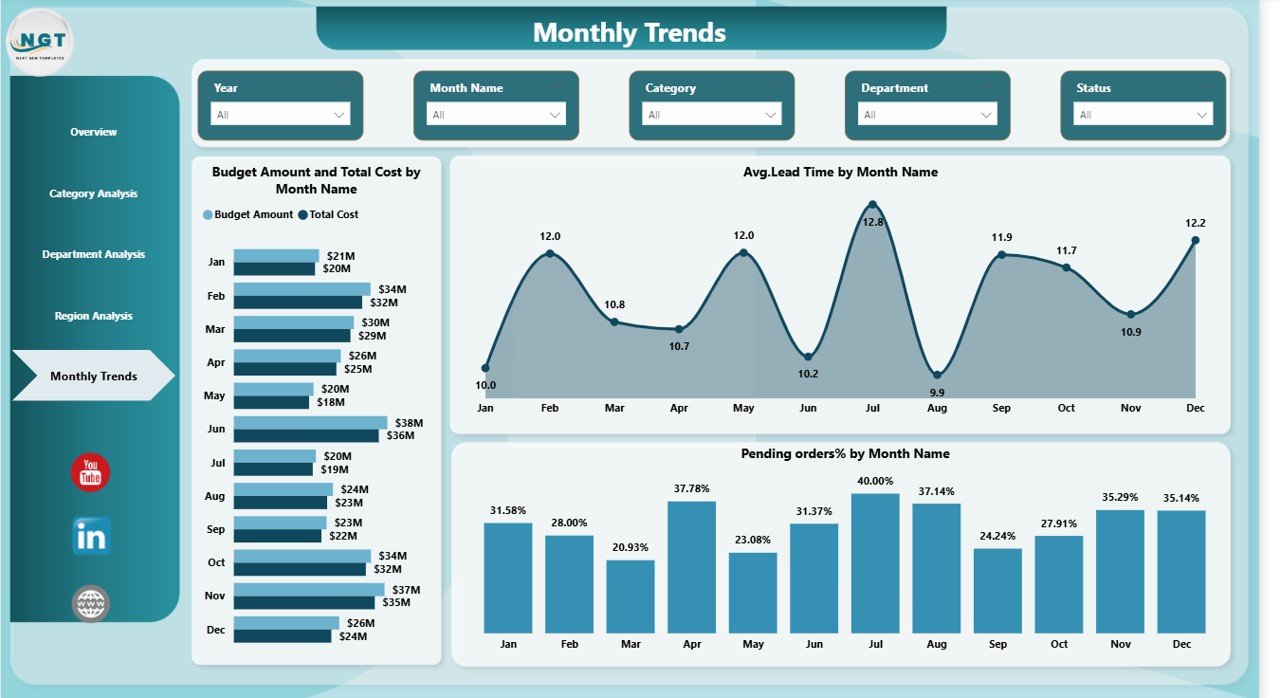
Monthly Trends – Is Procurement Improving Over Time?
Trend analysis reveals long-term performance.
Charts Included:
- Budget Amount and Total Cost by Month Name
- Average Lead Time by Month Name
- Pending Orders % by Month Name
With this page, you can:
- Track cost increase month by month
- Identify seasonal procurement patterns
- Monitor improvement in delivery timelines
- Forecast future spend
Key KPIs Included in the Dashboard
This dashboard includes powerful procurement KPIs such as:
- Total Cost
- Budget Amount
- Variance Amount
- Average Lead Time
- Delayed Orders %
- Completed Orders %
- Pending Orders %
- Total Orders
- Cost by Category
- Cost by Department
- Cost by Region
Because these KPIs cover cost, performance, and efficiency, they provide a complete procurement view.
Click to buy Procurement Spend Analysis Dashboard in Power BI
Advantages of Procurement Spend Analysis Dashboard in Power BI
Now let us explore the major benefits.
Better Cost Control
You can instantly compare budget vs actual spend. Therefore, you avoid overspending.
Improved Supplier Performance Monitoring
You can track delayed orders and lead time. As a result, supplier accountability improves.
Faster Decision Making
Since all data appears in one dashboard, management makes decisions quickly.
Increased Transparency
Department and region-wise tracking improves visibility.
Enhanced Strategic Planning
Monthly trends help forecast future procurement needs.
Improved Negotiation Power
When you know exact spend by category, you negotiate better with suppliers.
Reduced Procurement Risk
Early detection of delays prevents operational disruption.
How Does This Dashboard Improve Procurement Strategy?
This dashboard does not only show numbers. Instead, it changes procurement behavior.
Because it shows real-time data:
- Teams plan better
- Departments become accountable
- Vendors improve performance
- Finance gains cost visibility
- Leadership gains control
Consequently, procurement becomes a strategic function instead of an operational task.
Best Practices for the Procurement Spend Analysis Dashboard
To get maximum benefit, follow these best practices:
Maintain Clean Data
Always update procurement data regularly. Clean data ensures accurate reports.
Use Standard Categories
Keep category names consistent. Otherwise, analysis becomes confusing.
Review KPIs Monthly
Check variance, lead time, and delays every month.
Monitor High-Spend Departments
Focus on departments with high spending.
Analyze Trends Continuously
Do not review data only once. Instead, track patterns over time.
Integrate With ERP Systems
If possible, connect Power BI with your ERP for automatic updates.
Share Insights With Stakeholders
Discuss dashboard insights in monthly meetings.
Who Can Benefit From This Dashboard?
This dashboard helps:
- Procurement Managers
- Finance Teams
- Supply Chain Managers
- CFOs
- Operations Managers
- Business Owners
Because it simplifies data analysis, both technical and non-technical users can use it easily.
Why Choose Power BI for Procurement Spend Analysis?
Power BI offers:
- Interactive slicers
- Dynamic visuals
- Drill-through features
- Real-time updates
- Easy sharing
- Strong data modeling
Therefore, Power BI makes procurement analytics simple and powerful.
Conclusion
Procurement affects every business function. However, without proper tracking, companies lose money silently.
A Procurement Spend Analysis Dashboard in Power BI changes that.
It brings visibility, control, and intelligence into procurement operations.
Because it combines cost tracking, performance metrics, regional analysis, and monthly trends, it provides a complete 360-degree view.
Therefore, if you want to reduce cost, improve vendor performance, and control procurement risk, this dashboard becomes essential.
Frequently Asked Questions with Answers
- What data do I need for a Procurement Spend Analysis Dashboard?
You need purchase order data, budget data, supplier details, order status, department information, and dates.
- Can small businesses use this dashboard?
Yes. Small and medium businesses can use it easily. They can even customize KPIs based on their needs.
- How often should I update procurement data?
You should update data daily or weekly. However, monthly updates also work for smaller organizations.
- Can I connect this dashboard with ERP systems?
Yes. Power BI connects easily with ERP, Excel, SQL, and cloud systems.
- How does this dashboard reduce procurement cost?
It highlights overspending areas, delayed orders, and inefficient categories. Therefore, management takes corrective actions quickly.
- Does this dashboard require advanced technical knowledge?
No. Once set up, users can operate it easily using slicers and filters.
Visit our YouTube channel to learn step-by-step video tutorials
Watch the step-by-step video tutorial:
Click to buy Procurement Spend Analysis Dashboard in Power BI