Ceramic manufacturing demands accuracy, speed, and cost control. Production targets must align with market demand. Kiln efficiency must remain stable. Quality standards must stay consistent.Ceramic Manufacturing KPI Dashboard in Power BI Moreover, management must compare performance against targets and previous year numbers regularly.
Ceramic Manufacturing KPI Dashboard in Power BI However, many ceramic factories still depend on manual Excel reports. As a result, managers struggle to analyze real-time performance. They miss trend insights. They fail to identify weak KPIs quickly.
So, how can you monitor MTD and YTD production KPIs, compare actual vs target performance, and analyze previous year trends in one interactive system?
The answer is simple.
You need a Ceramic Manufacturing KPI Dashboard in Power BI.
In this complete guide, you will learn:
-
What a Ceramic Manufacturing KPI Dashboard in Power BI is
-
Why ceramic manufacturers need it
-
Detailed explanation of all 3 dashboard pages
-
Excel data structure used as source
-
Important KPIs for ceramic production
-
Advantages of Ceramic Manufacturing KPI Dashboard in Power BI
-
Best Practices for this dashboard
-
Frequently Asked Questions with Answers
Let us explore everything step by step.
Click to Purchases Ceramic Manufacturing KPI Dashboard in Power BI
What Is a Ceramic Manufacturing KPI Dashboard in Power BI?
A Ceramic Manufacturing KPI Dashboard in Power BI is a ready-to-use business intelligence solution designed to track manufacturing performance metrics in an interactive and visual way.
It captures data from an Excel file and transforms it into:
-
Dynamic reports
-
Visual KPI indicators
-
Trend charts
-
Drill-through insights
-
Target vs Actual comparisons
Unlike static Excel sheets, Power BI allows you to filter, slice, and drill into data instantly.
Therefore, plant managers, finance teams, and operations leaders can make faster and smarter decisions.
Why Do Ceramic Manufacturers Need a Power BI KPI Dashboard?
Ceramic manufacturing includes multiple operational processes:
-
Raw material preparation
-
Forming and shaping
-
Kiln firing
-
Quality inspection
-
Packaging and dispatch
If you do not track KPIs effectively, you may face:
-
High defect rates
-
Increased fuel cost
-
Low machine utilization
-
Poor target achievement
-
Revenue fluctuations
Additionally, comparing Current Year (CY) with Previous Year (PY) performance helps measure growth.
Therefore, a Power BI dashboard improves:
-
Performance visibility
-
Operational control
-
Financial transparency
-
Strategic decision-making
What Are the Key Features of the Ceramic Manufacturing KPI Dashboard in Power BI?
This dashboard contains 3 interactive pages in the Power BI Desktop application.
Click to Purchases Ceramic Manufacturing KPI Dashboard in Power BI
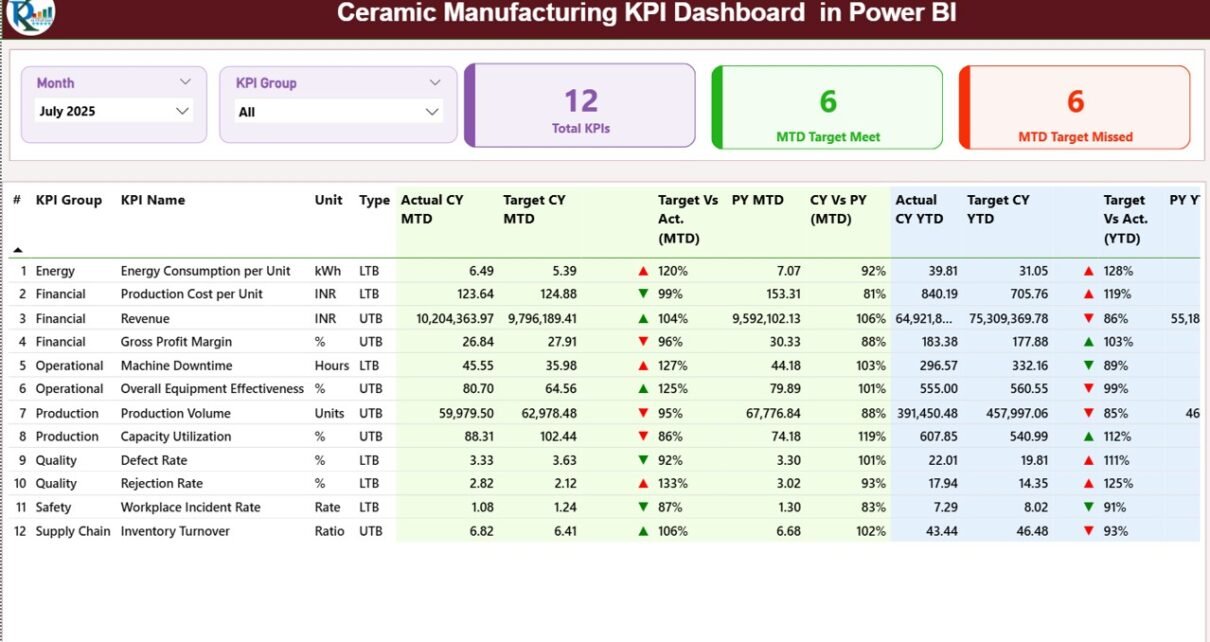
1️⃣ Summary Page – Central Performance Overview
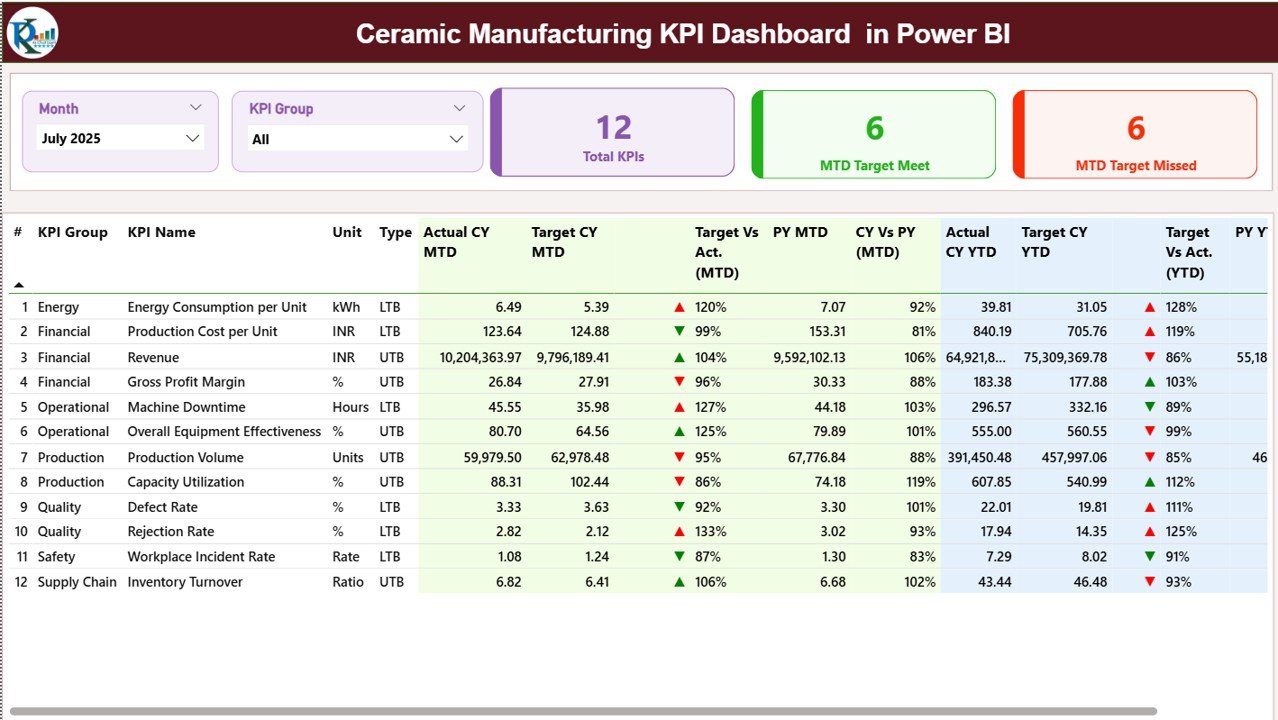
The Summary Page acts as the main dashboard interface.
Top Slicers
At the top, you will find:
-
Month slicer
-
KPI Group slicer
These slicers allow you to filter KPIs dynamically.
KPI Cards
The dashboard displays three KPI cards:
-
Total KPIs Count
-
MTD Target Meet Count
-
MTD Target Missed Count
Therefore, you can quickly evaluate overall performance status.
Detailed KPI Table
Below the cards, the dashboard shows a detailed KPI table with the following columns:
🔹 KPI Number
Sequence number of the KPI.
🔹 KPI Group
Category of KPI such as Production, Quality, Financial, or Cost.
🔹 KPI Name
Name of the KPI.
🔹 Unit
Unit of measurement.
🔹 Type
Indicates whether KPI is:
-
LTB (Lower the Better)
-
UTB (Upper the Better)
MTD Analysis Columns
-
Actual CY MTD
-
Target CY MTD
-
MTD Icon (▲ green / ▼ red)
-
Target Vs Act. (MTD %)
-
PY MTD
-
CY Vs PY (MTD %)
The dashboard calculates:
-
Target vs Actual (MTD) = Actual ÷ Target
-
CY vs PY (MTD) = Current MTD ÷ Previous Year MTD
Icons instantly show whether performance meets or misses the target.
YTD Analysis Columns
Similarly, the dashboard shows:
-
Actual CY YTD
-
Target CY YTD
-
YTD Icon
-
Target Vs Act. (YTD %)
-
PY YTD
-
CY Vs PY (YTD %)
Therefore, management can evaluate both short-term and cumulative performance.
Click to Purchases Ceramic Manufacturing KPI Dashboard in Power BI
2️⃣ KPI Trend Page – Performance Over Time
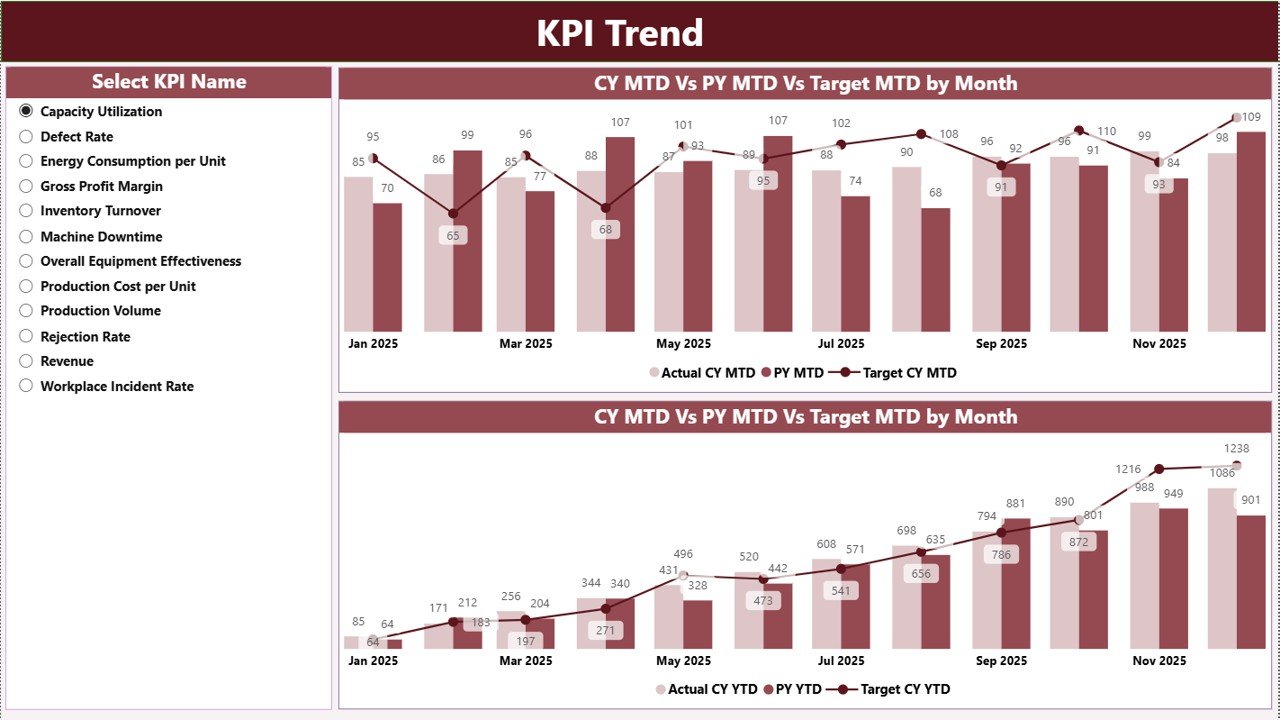
The KPI Trend page provides visual analysis.
Slicer
On the left side, you can select the KPI name.
Combo Charts
The page displays two combo charts:
-
MTD Trend Chart
-
YTD Trend Chart
Each chart shows:
-
Current Year Actual
-
Previous Year Actual
-
Target Values
Therefore, you can identify growth trends, seasonal changes, and performance gaps easily.
For example, if rejection rate increases in specific months, you can analyze production conditions.
Click to Purchases Ceramic Manufacturing KPI Dashboard in Power BI
3️⃣ KPI Definition Page – Drill-Through Insights
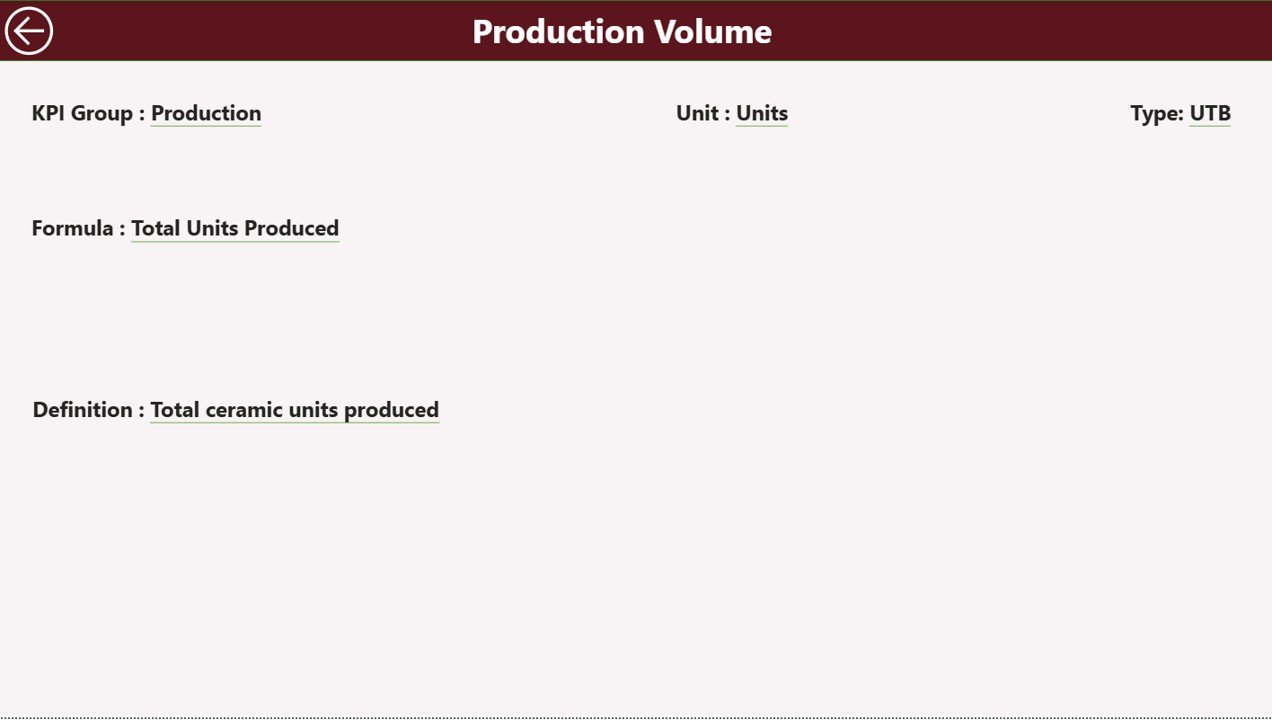
The KPI Definition page remains hidden by default.
From the Summary page, you can drill through to view:
-
KPI Formula
-
KPI Definition
-
KPI Group
-
Unit
-
Type
A Back button on the top left corner helps you return to the main page easily.
Thus, the dashboard maintains clarity while providing deep insights when needed.
Excel Data Source Structure
This Power BI dashboard uses an Excel file as a data source.
You need to fill three worksheets.
1️⃣ Input_Actual Sheet
In this sheet, enter:
-
KPI Name
-
Month (first date of month)
-
MTD Actual number
-
YTD Actual number
2️⃣ Input_Target Sheet
In this sheet, enter:
-
KPI Name
-
Month
-
MTD Target
-
YTD Target
3️⃣ KPI Definition Sheet
Here, you enter:
-
KPI Number
-
KPI Group
-
KPI Name
-
Unit
-
Formula
-
Definition
-
Type (LTB or UTB)
Once you update Excel data and refresh Power BI, the dashboard updates automatically.
Click to Purchases Ceramic Manufacturing KPI Dashboard in Power BI
Important KPIs for Ceramic Manufacturing
Ceramic factories must monitor KPIs across different areas.
🔹 Production KPIs
-
Production Volume
-
Machine Utilization Rate
-
Downtime Percentage
-
Capacity Utilization
🔹 Quality KPIs
-
Rejection Rate
-
Defect Percentage
-
Inspection Pass Rate
🔹 Cost KPIs
-
Fuel Cost per Unit
-
Raw Material Cost
-
Production Cost per Unit
🔹 Financial KPIs
-
Revenue
-
Gross Profit Margin
-
Sales Growth
-
Inventory Turnover
Tracking these KPIs ensures balanced performance management.
Click to Purchases Ceramic Manufacturing KPI Dashboard in Power BI
Advantages of Ceramic Manufacturing KPI Dashboard in Power BI
Using Power BI offers powerful advantages.
1️⃣ Interactive Filtering
You can filter by month and KPI group instantly.
2️⃣ Visual Performance Indicators
Icons and percentage comparisons simplify evaluation.
3️⃣ Real-Time Refresh
Update Excel data and refresh dashboard instantly.
4️⃣ Drill-Through Capability
Access KPI formulas and definitions quickly.
5️⃣ Better Strategic Planning
Trend charts support long-term decision-making.
6️⃣ Professional Reporting
Present visually appealing reports to stakeholders.
Click to Purchases Ceramic Manufacturing KPI Dashboard in Power BI
Best Practices for the Ceramic Manufacturing KPI Dashboard in Power BI
To maximize results, follow these best practices.
✔ Maintain Clean Excel Data
Ensure consistent KPI names and accurate entries.
✔ Refresh Dashboard Regularly
Refresh Power BI after updating data.
✔ Review MTD and YTD Together
Do not focus on one metric only.
✔ Analyze Negative Trends Immediately
Investigate KPIs that consistently miss targets.
✔ Train Team Members
Ensure managers understand KPI definitions and dashboard usage.
✔ Use KPI Group Filtering
Review each department separately for better clarity.
How Does This Dashboard Improve Manufacturing Performance?
When you monitor KPIs through Power BI:
-
You detect inefficiencies early
-
You improve cost control
-
You enhance production quality
-
You increase accountability
-
You improve profitability
Consequently, your ceramic manufacturing process becomes data-driven and competitive.
Conclusion
Ceramic manufacturing requires strong monitoring and continuous improvement. Without structured KPI tracking, inefficiencies grow unnoticed.
The Ceramic Manufacturing KPI Dashboard in Power BI provides:
-
MTD and YTD comparison
-
Target vs Actual performance
-
Current vs Previous Year analysis
-
Interactive slicers
-
Drill-through KPI insights
Instead of relying on static reports, you can use one interactive Power BI dashboard to manage performance effectively.
If you want to improve production efficiency, reduce cost, and enhance profitability, this ready-to-use dashboard offers a powerful and practical solution.
Click to Purchases Ceramic Manufacturing KPI Dashboard in Power BI
Frequently Asked Questions with Answers
1. What is a Ceramic Manufacturing KPI Dashboard in Power BI?
It is an interactive Power BI report designed to monitor production, cost, and financial KPIs.
2. Does it use Excel as a data source?
Yes. The dashboard uses structured Excel sheets for Actual, Target, and KPI Definition data.
3. Can I customize KPIs?
Yes. You can modify KPI definitions and Excel inputs easily.
4. Does it support MTD and YTD tracking?
Yes. It tracks both Month-to-Date and Year-to-Date performance.
5. Do I need advanced Power BI skills?
No. Basic knowledge of Power BI is enough to use and refresh the dashboard.
Click to Purchases Ceramic Manufacturing KPI Dashboard in Power BI
Visit our YouTube channel to learn step-by-step video tutorials