Rural development drives economic growth, improves livelihoods, and strengthens communities. However, many development teams still track progress in scattered spreadsheets. As a result, leaders struggle to monitor targets, compare yearly progress, and make timely decisions.
So, how can government bodies, NGOs, and development agencies track rural performance in one powerful system?
The answer is simple.
You need a Rural Development KPI Dashboard in Excel.
This ready-to-use Excel template helps you monitor key performance indicators (KPIs) in one centralized and interactive dashboard. Moreover, it allows you to compare MTD (Month-to-Date), YTD (Year-to-Date), Target, and Previous Year data instantly. Therefore, you gain full visibility over rural initiatives without complex tools.
In this complete guide, you will learn:
-
What a Rural Development KPI Dashboard in Excel is
-
Why rural development projects need it
-
A detailed explanation of all 7 worksheets
-
Key KPIs you can track
-
Advantages of Rural Development KPI Dashboard in Excel
-
Best Practices for the Rural Development KPI Dashboard
-
Frequently Asked Questions with Answers
Let us explore everything step by step.
Click to Purchases Rural Development KPI Dashboard in Excel
What Is a Rural Development KPI Dashboard in Excel?
A Rural Development KPI Dashboard in Excel is an interactive reporting tool that helps organizations track development indicators in rural areas.
It converts raw data into:
-
Performance summaries
-
Target comparisons
-
Trend charts
-
Conditional indicators
-
Monthly and yearly analysis
Instead of reviewing long reports, you can simply select a month and instantly view results. Therefore, you save time and improve clarity.
Why Do Rural Development Projects Need a KPI Dashboard?
Rural programs involve multiple departments, budgets, and timelines. Consequently, monitoring them manually becomes difficult.
Here are some common challenges:
-
Delayed reporting
-
No monthly comparison
-
Difficulty tracking YTD progress
-
Lack of trend visibility
-
Confusion between target and actual values
However, when you use a KPI dashboard, you solve these issues immediately. You can compare Target vs Actual, PY vs Actual, and analyze trends without delay.
Key Features of Rural Development KPI Dashboard in Excel
This dashboard contains 7 well-structured worksheets. Each sheet plays a specific role. Let us understand them in detail.
1️⃣ Home Sheet – Easy Navigation Center
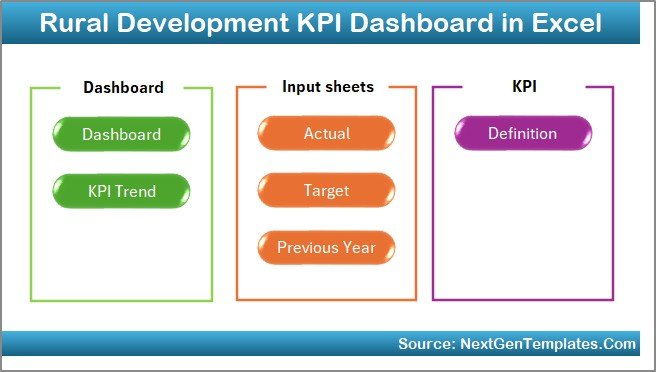
The Home Sheet works as an index page.
Here, you get:
-
6 navigation buttons
-
Quick access to each sheet
-
Clean layout for easy movement
Therefore, users can move between sheets without confusion. Even beginners can navigate the dashboard easily.
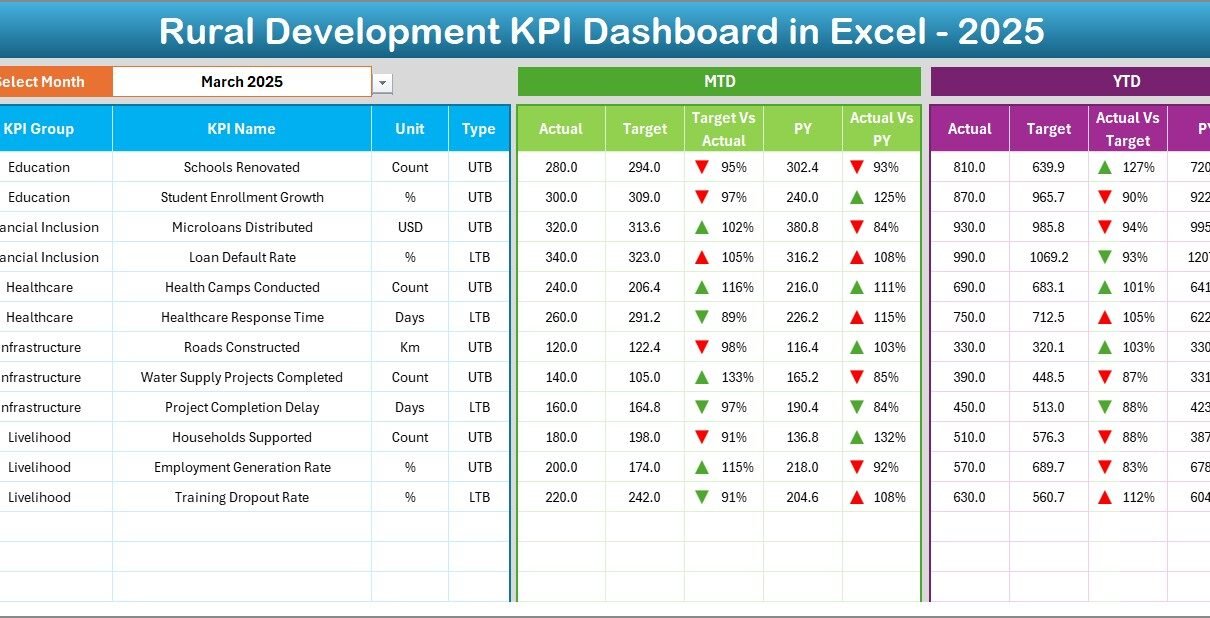
2️⃣ Dashboard Sheet – Main Performance Overview
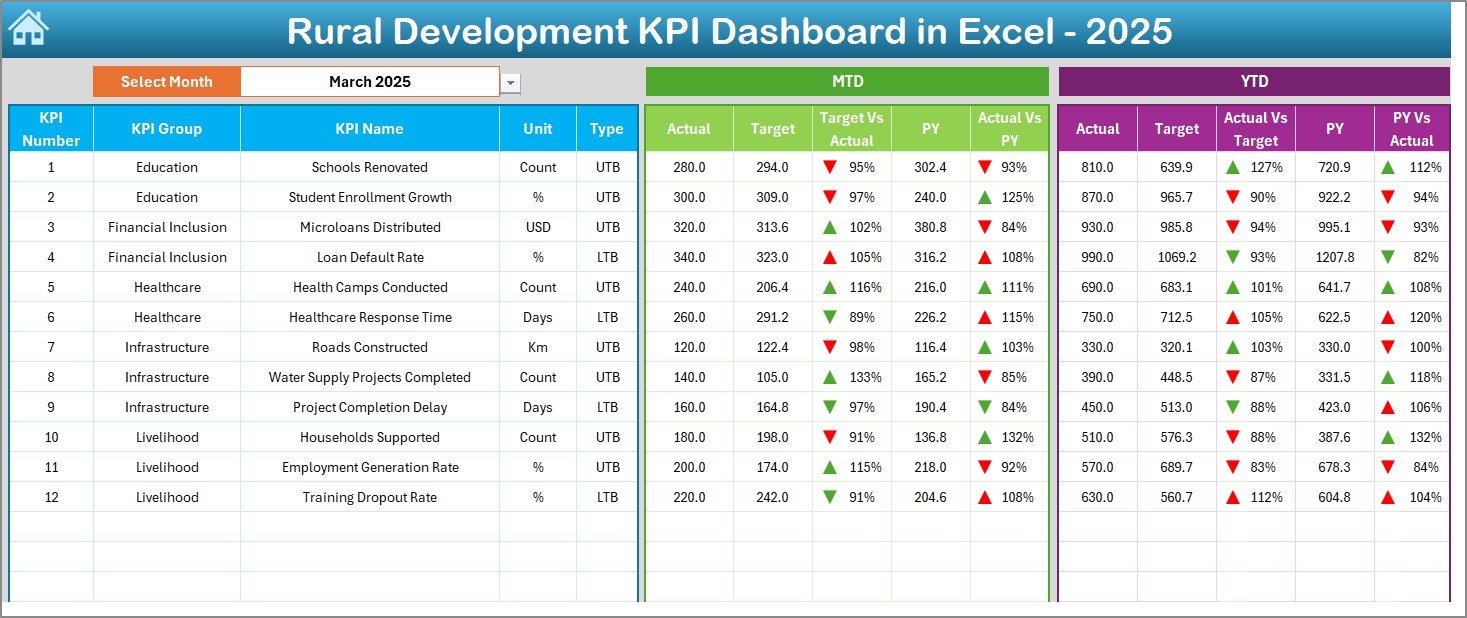
The Dashboard Sheet serves as the heart of the template.
On cell D3, you can select the Month from a drop-down. Once you select the month, the entire dashboard updates automatically.
Click to Purchases Rural Development KPI Dashboard in Excel
What Does This Sheet Show?
You can view:
-
MTD Actual
-
MTD Target
-
MTD Previous Year
-
Target vs Actual (with up/down arrows)
-
PY vs Actual (with conditional arrows)
In addition, you can analyze:
-
YTD Actual
-
YTD Target
-
YTD Previous Year
-
YTD Target vs Actual
-
YTD PY vs Actual
Because of conditional formatting arrows, you instantly know whether performance improves or declines. Therefore, decision-making becomes faster.
3️⃣ KPI Trend Sheet – Deep Performance Analysis
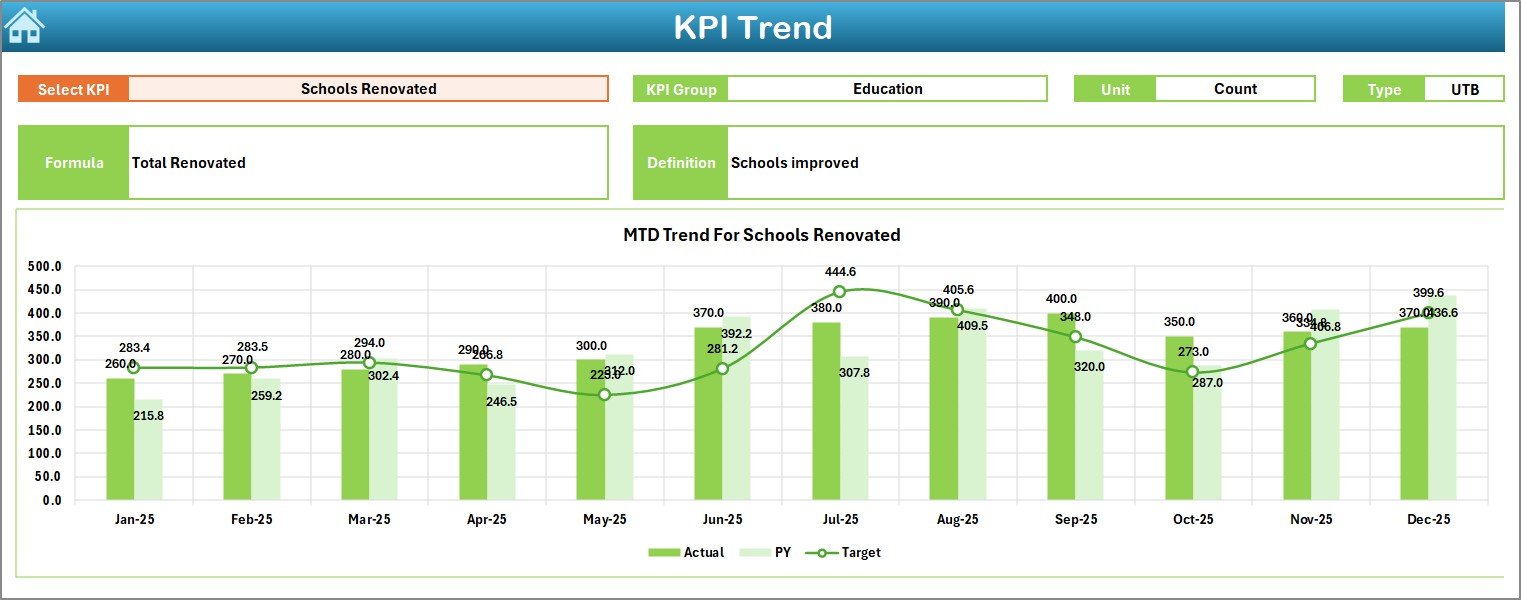
The KPI Trend Sheet helps you analyze a specific KPI in detail.
On cell C3, you can select a KPI name from the drop-down list.
Once selected, the sheet displays:
-
KPI Group
-
Unit of KPI
-
Type (Lower the Better / Upper the Better)
-
Formula
-
Definition
Moreover, it shows:
-
MTD Trend Chart (Actual vs Target vs PY)
-
YTD Trend Chart (Actual vs Target vs PY)
As a result, you can track patterns, identify seasonal changes, and detect performance gaps quickly.
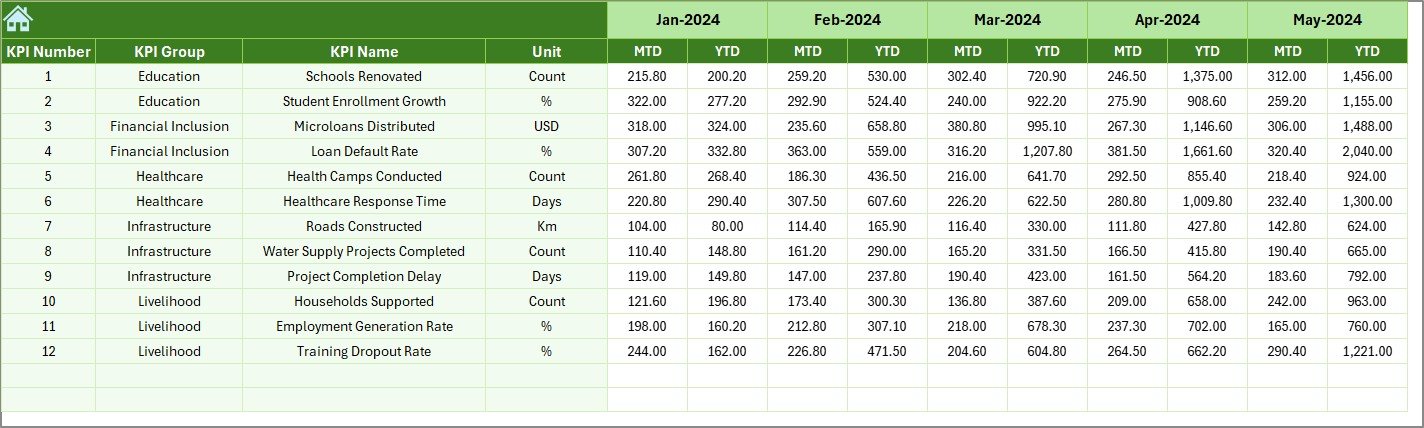
4️⃣ Actual Numbers Input Sheet – Data Entry Area
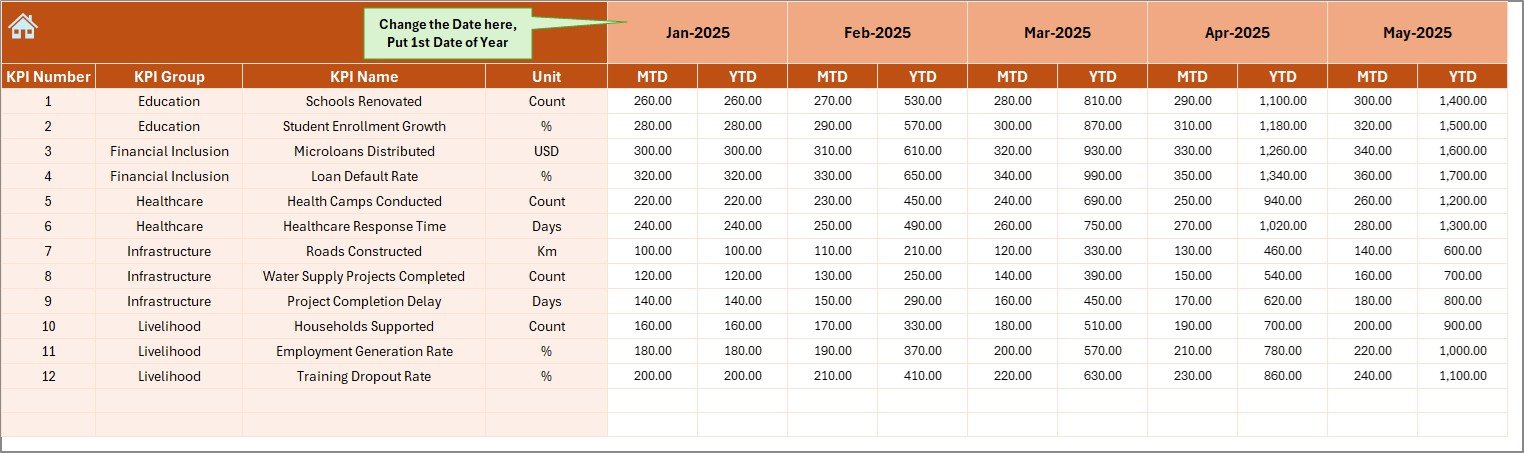
This sheet allows you to enter actual performance data.
On cell E1, you can define the starting month of the year. After that, you simply enter MTD and YTD actual values for each KPI.
Because the dashboard pulls data from this sheet, accuracy remains critical. Therefore, always update this sheet monthly.
5️⃣ Target Sheet – Goal Setting Control Panel
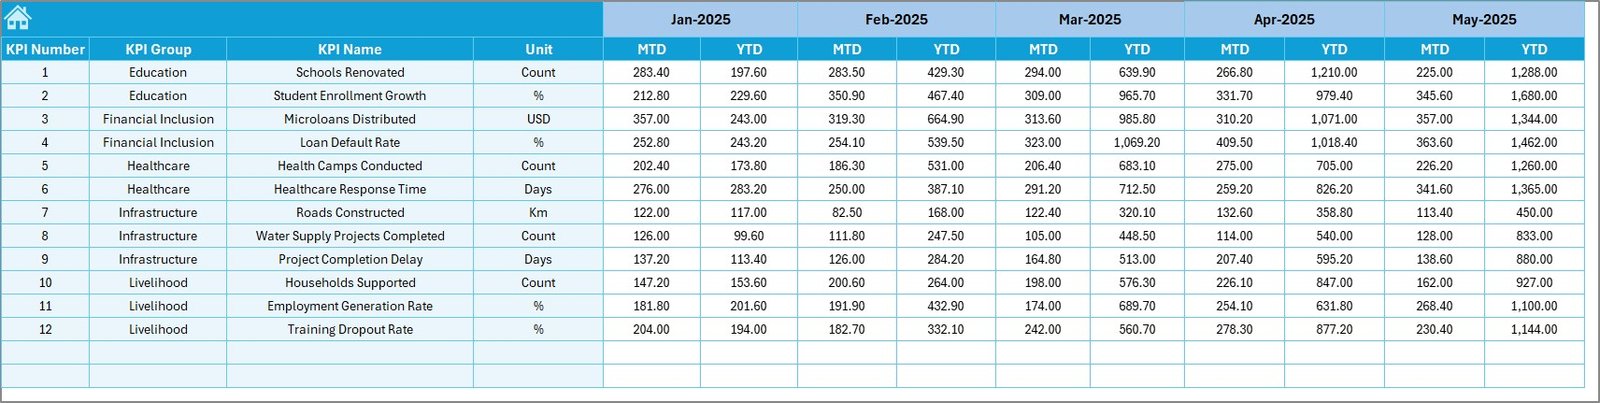
In this sheet, you enter:
-
Monthly MTD Targets
-
Monthly YTD Targets
Targets define your expectations. Hence, correct input ensures accurate performance comparison.
6️⃣ Previous Year Number Sheet – Historical Comparison
Here, you enter last year’s numbers.
You add:
-
Previous Year MTD
-
Previous Year YTD
Therefore, the dashboard can compare current progress against historical performance. This comparison helps you evaluate improvement year over year.
Click to Purchases Rural Development KPI Dashboard in Excel
7️⃣ KPI Definition Sheet – KPI Documentation Center
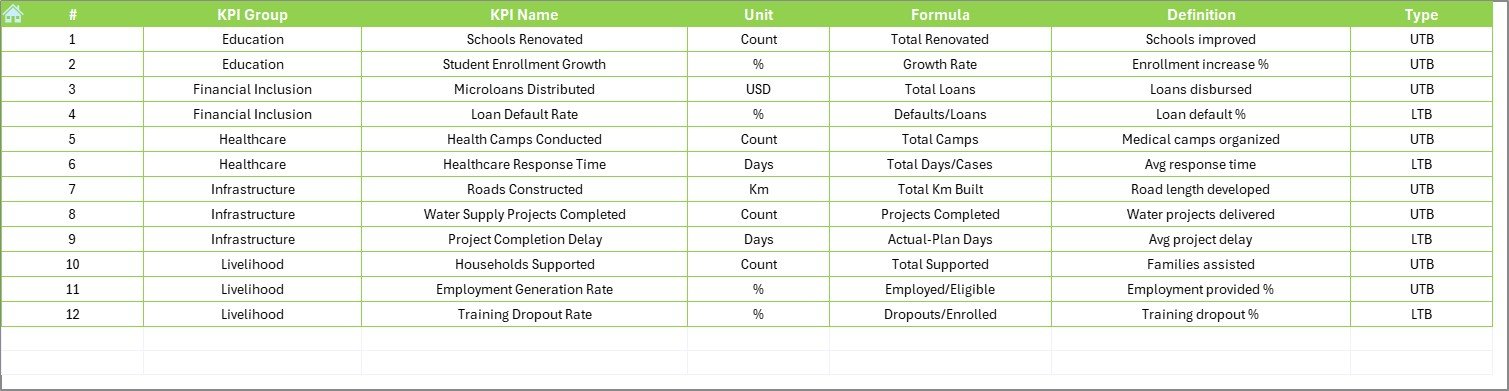
This sheet defines every KPI clearly.
You enter:
-
KPI Name
-
KPI Group
-
Unit
-
Formula
-
Definition
Because of this documentation, every user understands what each KPI means. Therefore, confusion reduces significantly.
What KPIs Can You Track in Rural Development?
You can track various rural indicators. For example:
Infrastructure KPIs
-
Road construction completion %
-
Electrification coverage
-
Water supply access
Agriculture KPIs
-
Crop productivity rate
-
Irrigation coverage %
-
Farmer income growth
Education KPIs
-
School enrollment rate
-
Literacy improvement %
-
Dropout rate
Healthcare KPIs
-
Vaccination coverage
-
Maternal health rate
-
Health camp participation
Employment KPIs
-
Rural employment rate
-
Skill training completion %
-
Self-help group formation
Because the template supports unlimited KPI entries, you can customize it for any rural program.
Advantages of Rural Development KPI Dashboard in Excel
Using this dashboard offers several benefits.
1. Centralized Monitoring
You can track all KPIs in one place. Therefore, you avoid multiple spreadsheets.
2. Real-Time Month Selection
You can select a month in cell D3. Immediately, all numbers update.
3. Clear Target Comparison
You see Target vs Actual with visual arrows. Hence, you quickly identify gaps.
4. Historical Year Comparison
You compare PY vs Actual easily. Therefore, you understand growth trends.
5. Data Transparency
Because KPI definitions remain documented, everyone understands the metrics.
6. Easy Customization
You can modify KPIs, formulas, and targets without technical knowledge.
7. Cost-Effective Solution
Excel works on almost every computer. Therefore, you avoid expensive software.
How Does the Rural Development KPI Dashboard Improve Decision-Making?
Click to Purchases Rural Development KPI Dashboard in Excel
When leaders access structured data:
-
They identify weak-performing areas
-
They reallocate budgets effectively
-
They prioritize urgent rural issues
-
They set realistic targets
Moreover, they act faster because the dashboard presents visual insights instantly.
Best Practices for the Rural Development KPI Dashboard
To maximize results, follow these best practices.
1. Update Data Monthly
Always enter actual numbers at the end of each month.
2. Review KPI Definitions
Ensure KPI formulas match your rural program objectives.
3. Validate Data Accuracy
Cross-check numbers before finalizing reports.
4. Use Trend Analysis
Do not focus only on one month. Instead, analyze trends.
5. Train Team Members
Ensure all team members understand how to update sheets properly.
6. Keep Backup Copies
Always save a backup before making structural changes.
7. Align KPIs with Government Goals
Ensure indicators match policy objectives.
Who Can Benefit from Rural Development KPI Dashboard in Excel?
This dashboard helps:
-
Government rural departments
-
NGOs
-
Development agencies
-
District administration offices
-
Agricultural boards
-
Social welfare organizations
-
Community development programs
Because the template remains flexible, anyone managing rural KPIs can use it.
How to Use the Rural Development KPI Dashboard Step by Step?
Follow these steps:
-
Enter KPI details in KPI Definition sheet
-
Input starting month in Actual Numbers sheet
-
Add Actual numbers
-
Enter Target values
-
Add Previous Year data
-
Go to Dashboard sheet
-
Select month from D3
-
Analyze results
Within minutes, you can generate professional KPI reports.
Conclusion
Rural development requires structured monitoring. Without clear data, leaders cannot measure progress effectively. However, with the Rural Development KPI Dashboard in Excel, you gain full control over performance tracking.
You can compare MTD, YTD, Target, and Previous Year values instantly. You can analyze trends. You can document KPIs clearly. Most importantly, you can make informed decisions faster.
If you want better transparency, stronger accountability, and improved rural outcomes, this dashboard provides the perfect solution.
Frequently Asked Questions with Answers
1. Can I customize KPIs in this dashboard?
Yes, you can fully customize KPI names, formulas, groups, and definitions.
2. Do I need advanced Excel knowledge?
No. Basic Excel knowledge allows you to use this template easily.
3. Can I add more KPIs?
Yes, you can expand the KPI Definition sheet and update formulas accordingly.
4. Does the dashboard support yearly comparison?
Yes, it compares MTD and YTD with Previous Year values.
5. Can NGOs use this template?
Yes. NGOs, government agencies, and development bodies can use it.
6. How often should I update data?
You should update data monthly for accurate reporting.
7. Can I use it for district-level monitoring?
Yes. You can customize KPIs for district-level rural programs.
Visit our YouTube channel to learn step-by-step video tutorials