The rubber industry runs on precision, cost control, and production efficiency. However, many rubber manufacturers still depend on scattered spreadsheets. As a result, leaders struggle to monitor plant performance, labor costs, raw material usage, and maintenance expenses in one place.
So, how do you track revenue, cost, maintenance, and production performance in a single structured system?
The answer is simple.
Click to Purchases Rubber Industry Dashboard in Excel
You need a Rubber Industry Dashboard in Excel.
This ready-to-use Excel dashboard gives you complete visibility into plant operations. Moreover, it converts raw data into interactive charts, KPI cards, and slicer-based analysis. Instead of manually checking reports, you can filter and analyze insights instantly.
In this detailed guide, you will learn:
-
What a Rubber Industry Dashboard in Excel is
-
Why rubber manufacturers need it
-
A complete explanation of all 5 dashboard pages
-
Key metrics you can track
-
Advantages of Rubber Industry Dashboard in Excel
-
Best practices to use it effectively
-
Frequently asked questions with answers
Let’s explore everything step by step.
What Is a Rubber Industry Dashboard in Excel?
A Rubber Industry Dashboard in Excel is an interactive reporting tool that helps manufacturers track revenue, maintenance costs, labor expenses, and raw material consumption.
Instead of using multiple sheets and manual summaries, this dashboard centralizes all key data into one structured system. Furthermore, it provides slicers, KPI cards, and visual charts that simplify complex operational data.
You can monitor:
-
Machine maintenance percentage
-
Revenue by plant and product type
-
Raw material cost trends
-
Labor cost by shift
-
Total cost by quality rating
Therefore, you gain better control over operations and profitability.
Why Does the Rubber Industry Need a Dashboard?
Rubber manufacturing involves:
-
Multiple plants
-
Different product types
-
Various shifts
-
High raw material cost
-
Frequent machine maintenance
However, when managers track data manually, errors increase. Moreover, decision-making slows down.
A dashboard solves these challenges because:
-
It centralizes data
-
It improves visibility
-
It highlights cost leakage
-
It tracks plant performance
-
It supports faster decisions
As a result, leadership teams act quickly and confidently.
Key Features of Rubber Industry Dashboard in Excel
This ready-to-use Excel dashboard includes a Page Navigator on the left side, which allows smooth navigation across all analytical pages. Additionally, slicers on the right side help filter data instantly.
The dashboard contains 5 analytical pages plus support and data sheets.
Let’s review each page in detail.
1. Overview Page – What Does the Summary Show?
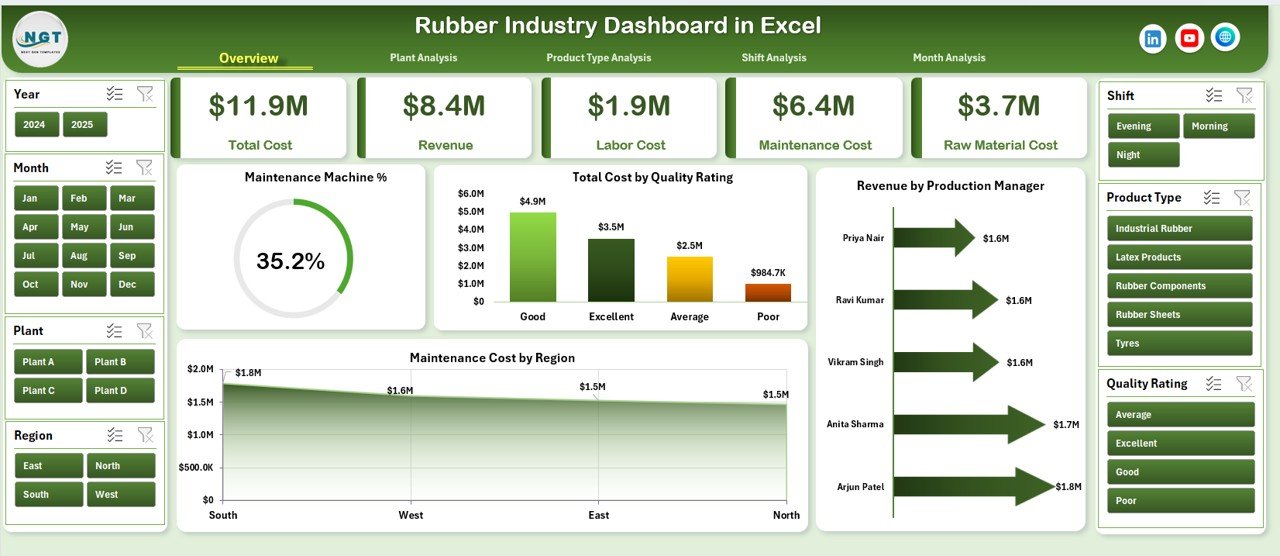
The Overview page acts as the command center. It presents high-level KPIs that help leaders assess overall performance immediately.
KPI Cards
-
Maintenance Machine %
-
Total Cost
-
Total Revenue
-
Maintenance Cost
These cards provide instant clarity. Therefore, managers understand performance within seconds.
Charts on Overview Page
-
Maintenance Machine % – Tracks machine uptime and efficiency
-
Total Cost by Quality Rating – Shows cost impact of product quality
-
Revenue by Production Manager – Highlights top-performing managers
-
Maintenance Cost by Region – Identifies high-expense regions
Because this page summarizes performance, it supports executive-level decisions.
2. Plant Analysis – How Does Each Plant Perform?
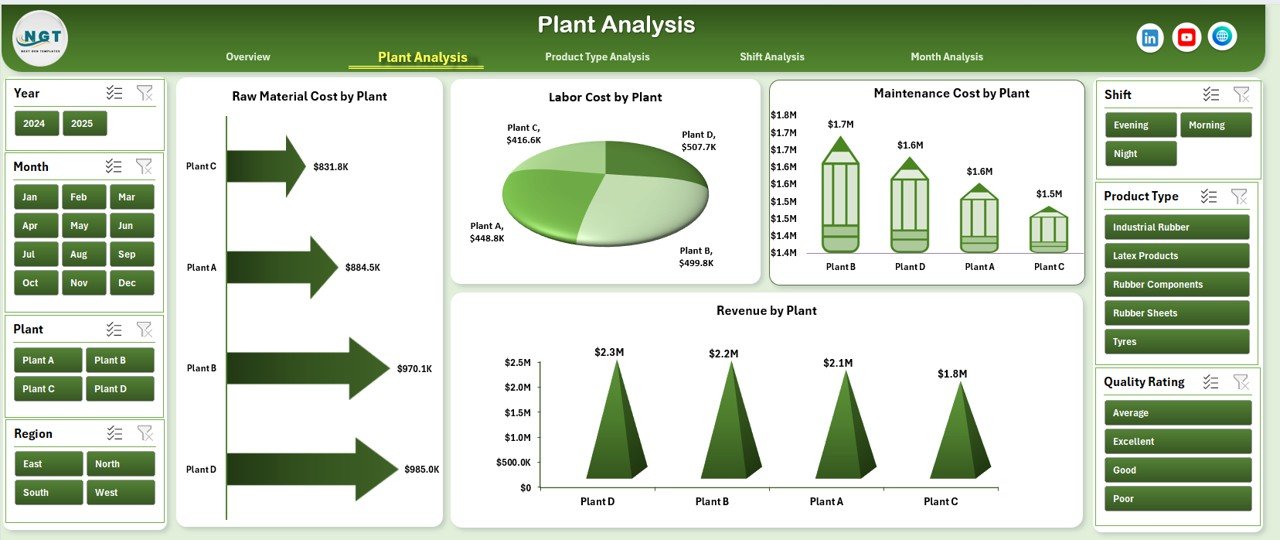
The Plant Analysis page focuses on location-wise performance.
Charts Included
-
Revenue by Plant
-
Maintenance Cost by Plant
-
Labor Cost by Plant
-
Raw Material Cost by Plant
This page helps management:
-
Compare plant profitability
-
Identify cost-heavy plants
-
Control maintenance expenses
-
Optimize resource allocation
For example, if Plant A shows high labor cost but low revenue, managers can investigate immediately.
3. Product Type Analysis – Which Products Drive Profit?
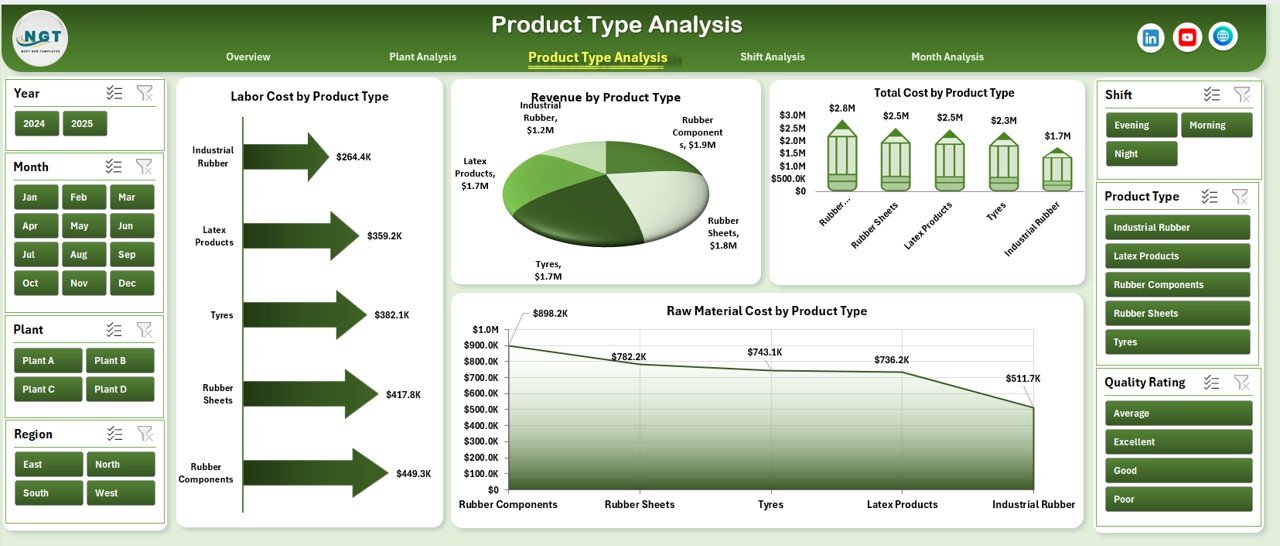
Rubber manufacturers produce different product types such as:
-
Industrial rubber sheets
-
Automotive rubber parts
-
Rubber seals
-
Rubber hoses
This page analyzes performance by product category.
Charts Included
-
Labor Cost by Product Type
-
Revenue by Product Type
-
Total Cost by Product Type
-
Raw Material Cost by Product Type
Therefore, decision-makers can:
-
Identify profitable product lines
-
Reduce cost-heavy products
-
Improve pricing strategy
-
Control raw material usage
As a result, product-level decisions become data-driven.
4. Shift Analysis – Which Shift Performs Better?
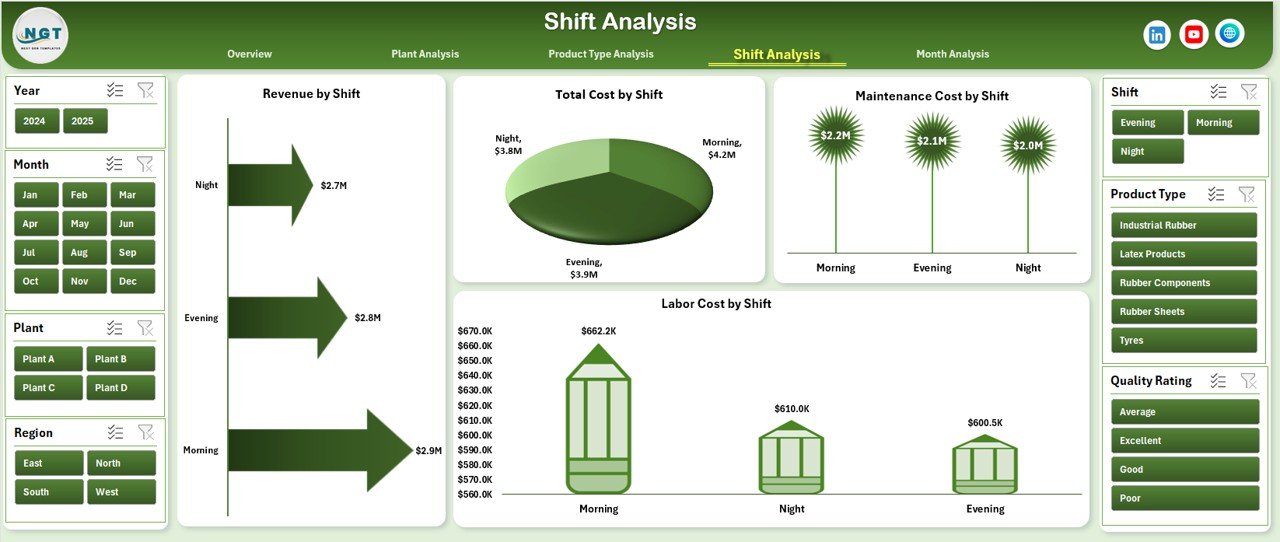
Most rubber plants operate in multiple shifts:
-
Morning Shift
-
Evening Shift
-
Night Shift
However, productivity often varies across shifts.
This page tracks shift-wise performance.
Charts Included
-
Labor Cost by Shift
-
Revenue by Shift
-
Total Cost by Shift
-
Raw Material Cost by Shift
If the night shift shows higher raw material waste, management can act quickly. Moreover, this analysis improves workforce planning and cost control.
5. Month Analysis – How Does Performance Change Over Time?
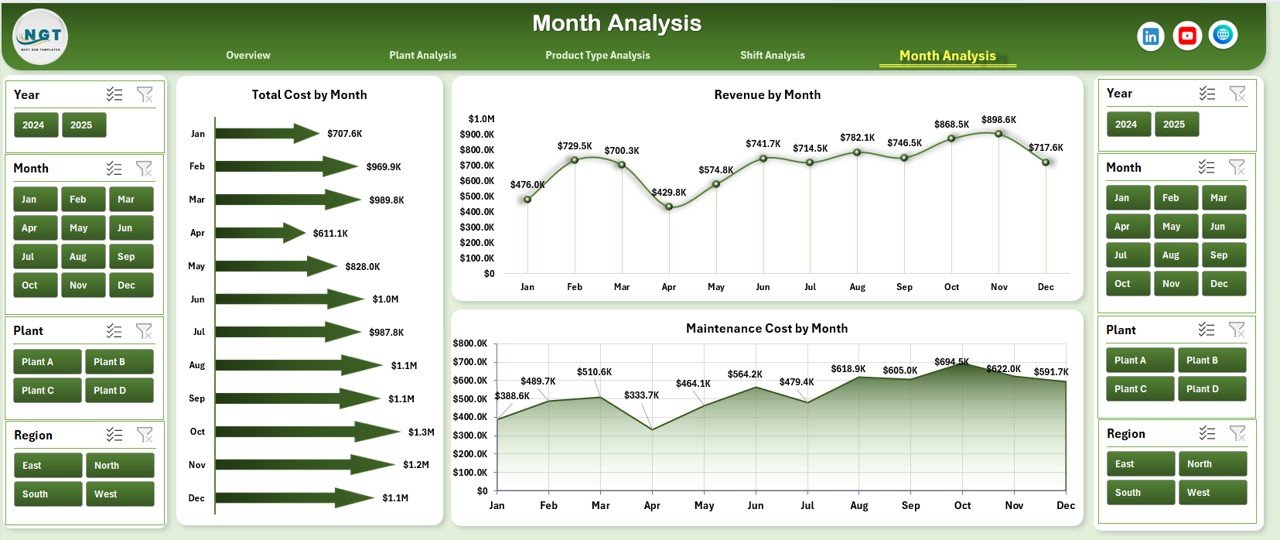
The Month Analysis page tracks trends.
Click to Purchases Rubber Industry Dashboard in Excel
Charts Included
-
Revenue by Month
-
Total Cost by Month
-
Raw Material Cost by Month
This page helps answer:
-
Does revenue grow consistently?
-
Do raw material costs increase seasonally?
-
Does maintenance cost spike in certain months?
Because trend analysis supports forecasting, it strengthens planning.
Support Sheet – What Does It Do?
The Support Sheet stores:
-
Unique plant list
-
Product types
-
Shift names
-
Region names
-
Production manager list
This sheet helps create drop-down filters and slicers. Therefore, it improves dashboard accuracy.
Data Sheet – Where Do You Enter Data?
The Data Sheet captures raw information such as:
-
Plant Name
-
Product Type
-
Shift
-
Region
-
Revenue
-
Labor Cost
-
Raw Material Cost
-
Maintenance Cost
-
Quality Rating
You only need to update this sheet. After that, the dashboard refreshes automatically.
What KPIs Can You Track in the Rubber Industry Dashboard?
You can monitor:
-
Maintenance Machine %
-
Revenue Growth
-
Total Production Cost
-
Labor Cost Ratio
-
Raw Material Cost Percentage
-
Plant-wise Profitability
-
Product-wise Margin
-
Shift Efficiency
Because these KPIs influence profitability, tracking them ensures financial stability.
Advantages of Rubber Industry Dashboard in Excel
Using this dashboard offers several benefits.
1. Centralized Data Control
You track everything in one file.
2. Real-Time Insights
You update data and see instant results.
3. Cost Optimization
You identify high-cost areas quickly.
4. Better Plant Management
You compare plant performance easily.
5. Improved Maintenance Planning
You monitor machine efficiency effectively.
6. Enhanced Decision-Making
You rely on data instead of assumptions.
7. Increased Profitability
You control cost and improve margins.
How Does This Dashboard Improve Profit Margins?
Click to Purchases Rubber Industry Dashboard in Excel
This dashboard increases profit because:
-
It reduces raw material waste.
-
It highlights labor inefficiencies.
-
It tracks maintenance expenses.
-
It improves production planning.
Therefore, managers focus on profitable operations.
Best Practices for the Rubber Industry Dashboard in Excel
To maximize results, follow these best practices.
1. Update Data Daily
Regular updates improve accuracy.
2. Maintain Clean Data
Avoid blank rows and incorrect entries.
3. Standardize Naming
Keep plant and product names consistent.
4. Review KPIs Weekly
Conduct weekly performance reviews.
5. Monitor Cost Ratios
Track labor and raw material percentage regularly.
6. Analyze Trends Monthly
Use month analysis to detect patterns.
7. Train Your Team
Ensure managers understand dashboard usage.
When you follow these practices, you increase efficiency and reliability.
Who Can Use Rubber Industry Dashboard in Excel?
This dashboard benefits:
-
Plant Managers
-
Production Managers
-
Operations Heads
-
Cost Controllers
-
Maintenance Supervisors
-
Business Owners
Whether you run a small plant or a large manufacturing unit, this dashboard simplifies monitoring.
Why Choose Excel for the Rubber Industry Dashboard?
Many companies prefer Excel because:
-
It offers flexibility
-
It supports pivot tables and slicers
-
It requires no complex setup
-
It works offline
-
It integrates easily with ERP exports
Moreover, Excel allows customization according to business needs.
How to Implement the Rubber Industry Dashboard?
Click to Purchases Rubber Industry Dashboard in Excel
Follow these steps:
-
Download the dashboard file.
-
Enter historical production data in the Data Sheet.
-
Verify plant, shift, and product names.
-
Refresh pivot tables.
-
Review insights.
Within minutes, you can start analyzing performance.
Conclusion – Is Rubber Industry Dashboard in Excel Worth It?
Absolutely.
Rubber manufacturing demands precision and cost control. However, manual tracking limits visibility. Therefore, you need a structured system that simplifies performance monitoring.
The Rubber Industry Dashboard in Excel delivers:
-
Clear visualization
-
Cost tracking
-
Plant comparison
-
Shift analysis
-
Trend monitoring
As a result, you improve efficiency, reduce waste, and increase profitability.
If you want smarter manufacturing decisions, this dashboard provides the solution.
Frequently Asked Questions with Answers
1. What software do I need to use this dashboard?
You need Microsoft Excel. The dashboard works smoothly in Excel desktop versions.
2. Can I customize the dashboard?
Yes. You can modify charts, add KPIs, or change layouts easily.
3. Does it support multiple plants?
Yes. You can add unlimited plants in the data sheet.
4. Can I track new product types?
Yes. Simply add new product categories in the data sheet and support sheet.
5. Does it calculate profit automatically?
Yes. The dashboard calculates revenue and cost comparisons automatically.
6. How often should I update the data?
You should update data daily or weekly for best results.
7. Is this dashboard suitable for small manufacturers?
Yes. Small and medium rubber businesses can use it effectively.
8. Can I integrate ERP data?
Yes. You can import ERP-exported Excel files into the data sheet.
Visit our YouTube channel to learn step-by-step video tutorials