In today’s fast-growing energy industry, battery manufacturing companies must maintain high production quality, operational efficiency, and cost control. As electric vehicles, renewable energy storage, and portable electronics continue to expand, manufacturers face increasing pressure to track performance accurately and make faster decisions.
However, many organizations still rely on disconnected spreadsheets and manual reporting. As a result, teams struggle to monitor production efficiency, quality metrics, and operational targets in real time. Consequently, decision-makers often miss performance gaps that directly impact productivity and profitability.So, how can battery manufacturers track KPIs efficiently without investing in expensive software?The answer is simple — Battery Manufacturing KPI Dashboard in Excel.This article explains everything you need to know about building and using a Battery Manufacturing KPI Dashboard in Excel. Moreover, you will learn its features, benefits, implementation steps, best practices, and frequently asked questions.
Click to buy Battery Manufacturing KPI Dashboard in Excel
What Is a Battery Manufacturing KPI Dashboard in Excel?
A Battery Manufacturing KPI Dashboard in Excel is an interactive performance monitoring tool designed to track key manufacturing metrics using structured data visualization.
Instead of reviewing multiple reports, managers can analyze all operational KPIs in one centralized dashboard. Therefore, teams gain instant visibility into production efficiency, quality performance, and target achievement.
Excel transforms raw manufacturing data into meaningful insights through:
- KPI scorecards
- Trend analysis charts
- Target vs Actual comparisons
- Monthly and yearly performance tracking
- Conditional performance indicators
As a result, organizations improve operational control while reducing reporting time.
Why Do Battery Manufacturing Companies Need KPI Dashboards?
Battery production involves multiple complex processes such as electrode preparation, cell assembly, testing, packaging, and quality validation. Because each stage affects final performance, companies must continuously measure operational metrics.
Without KPI monitoring:
- Production delays increase
- Quality issues remain unnoticed
- Costs rise unexpectedly
- Decision-making slows down
On the other hand, a KPI dashboard provides clear visibility into performance trends. Therefore, managers identify issues early and take corrective action quickly.
What KPIs Should Battery Manufacturers Track?
Although KPI selection varies by organization, most battery manufacturing operations focus on efficiency, quality, cost, and delivery metrics.
Production KPIs
- Production Volume
- Capacity Utilization
- Cycle Time
- Equipment Efficiency (OEE)
Quality KPIs
- Defect Rate
- Yield Percentage
- Scrap Rate
- Rework Percentage
Operational KPIs
- Downtime Hours
- Energy Consumption
- Maintenance Compliance
- Labor Productivity
Financial KPIs
- Cost per Unit
- Production Cost Variance
- Inventory Turnover
Because these KPIs influence profitability directly, companies must monitor them consistently.
Key Features of the Battery Manufacturing KPI Dashboard in Excel
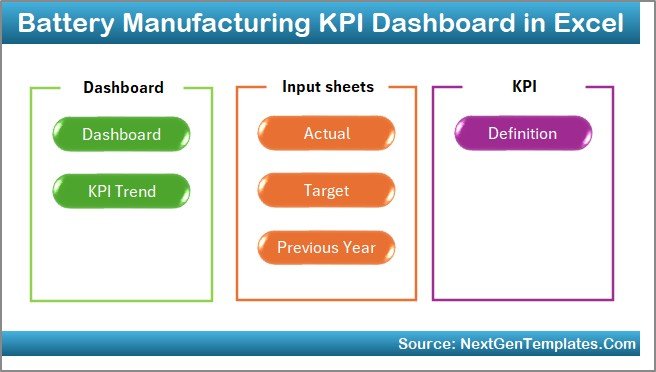
This dashboard includes seven structured worksheets, each designed for a specific purpose. Together, they create a complete performance management system.
Summary Page – Easy Navigation Center
The Summary Page works as an index sheet.
Here, users find six navigation buttons that allow quick access to different sheets. Therefore, users move across the dashboard without searching manually.
Key benefits include:
- Faster navigation
- User-friendly design
- Organized workflow structure
Click to buy Battery Manufacturing KPI Dashboard in Excel
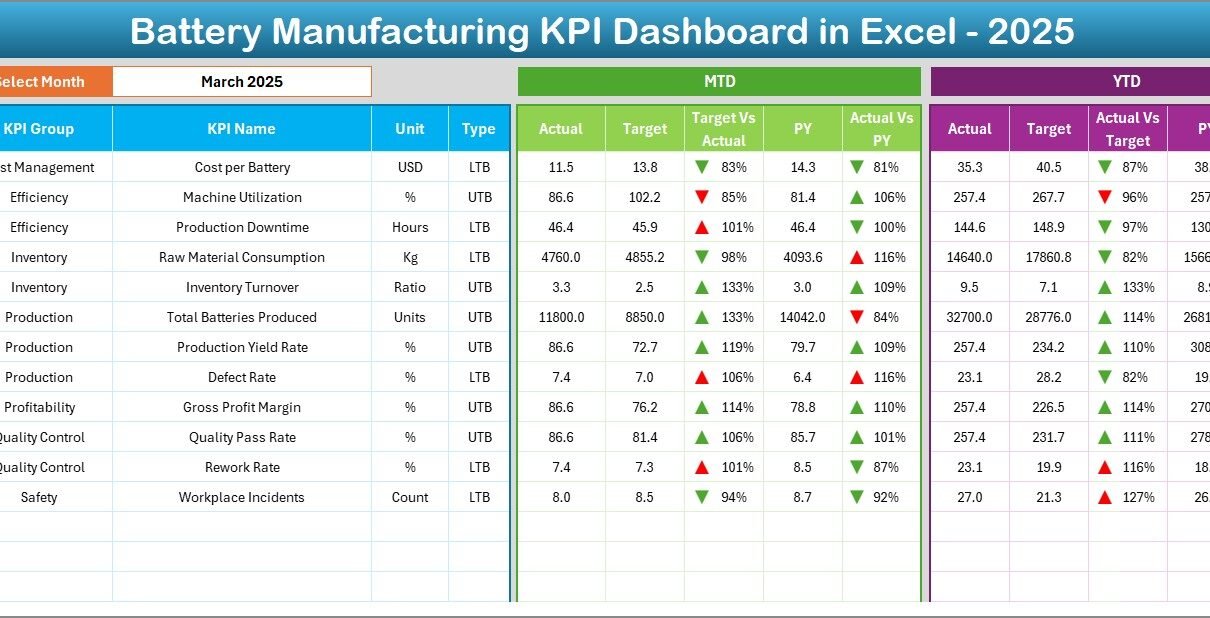
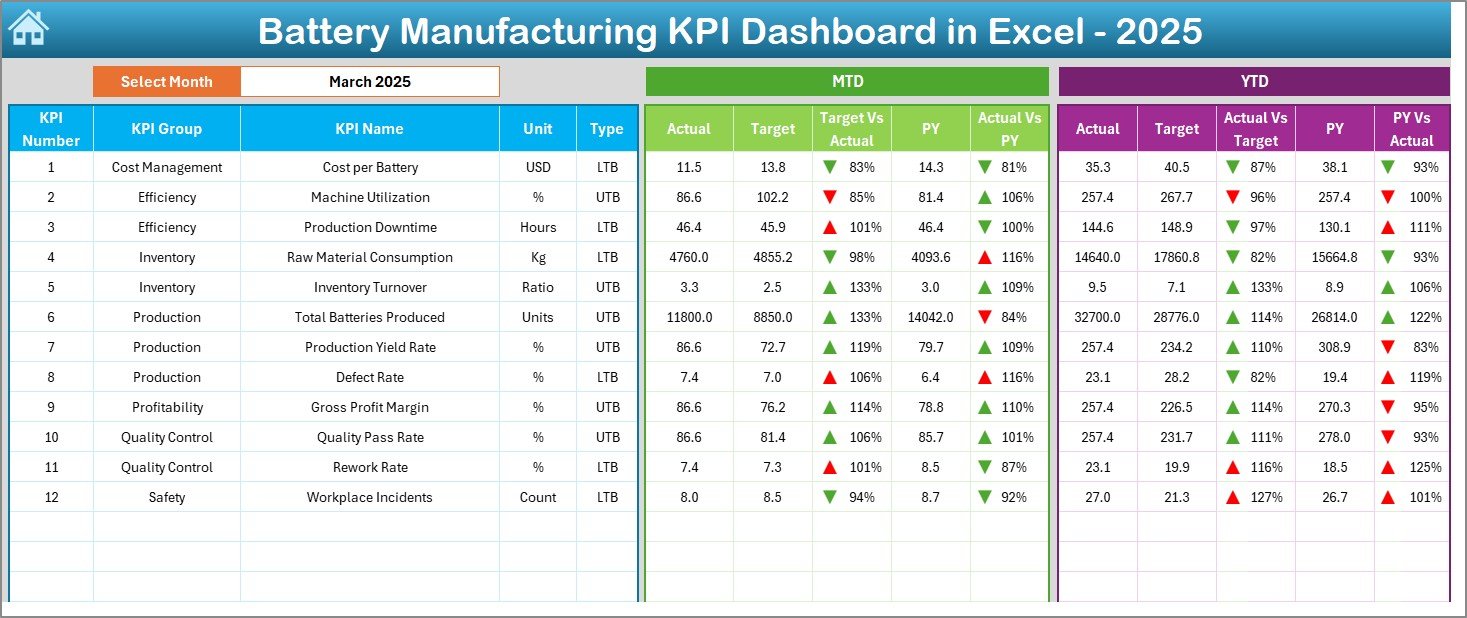
Dashboard Sheet – Central Performance View
The Dashboard Sheet serves as the main analysis page.
Here, users see consolidated KPI performance for the selected month. On cell D3, a drop-down menu allows users to choose the reporting month. Immediately, the entire dashboard updates automatically.
Metrics Displayed:
- MTD Actual vs Target
- Previous Year vs Actual
- YTD Performance comparison
- Conditional formatting arrows for performance trends
Because visual indicators highlight improvement or decline, managers instantly understand performance status.
Click to buy Battery Manufacturing KPI Dashboard in Excel
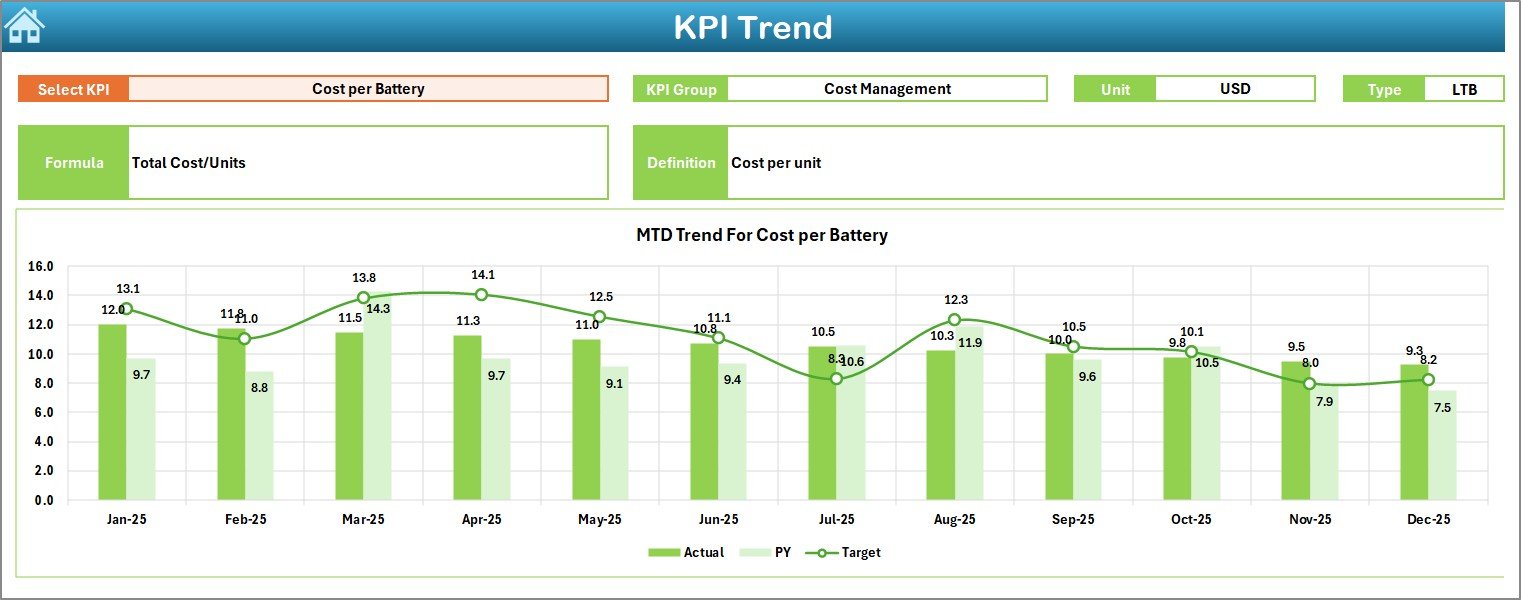
Trend Sheet – KPI Performance Analysis
The Trend Sheet provides detailed KPI insights.
Users select a KPI from the dropdown in cell C3. After selection, the sheet displays:
- KPI Group
- KPI Unit
- KPI Type (Lower the Better / Upper the Better)
- KPI Formula
- KPI Definition
Additionally, the sheet shows:
- MTD trend charts
- YTD trend charts
- Actual vs Target vs Previous Year comparisons
Therefore, decision-makers analyze performance trends instead of relying on single data points.
Click to buy Battery Manufacturing KPI Dashboard in Excel
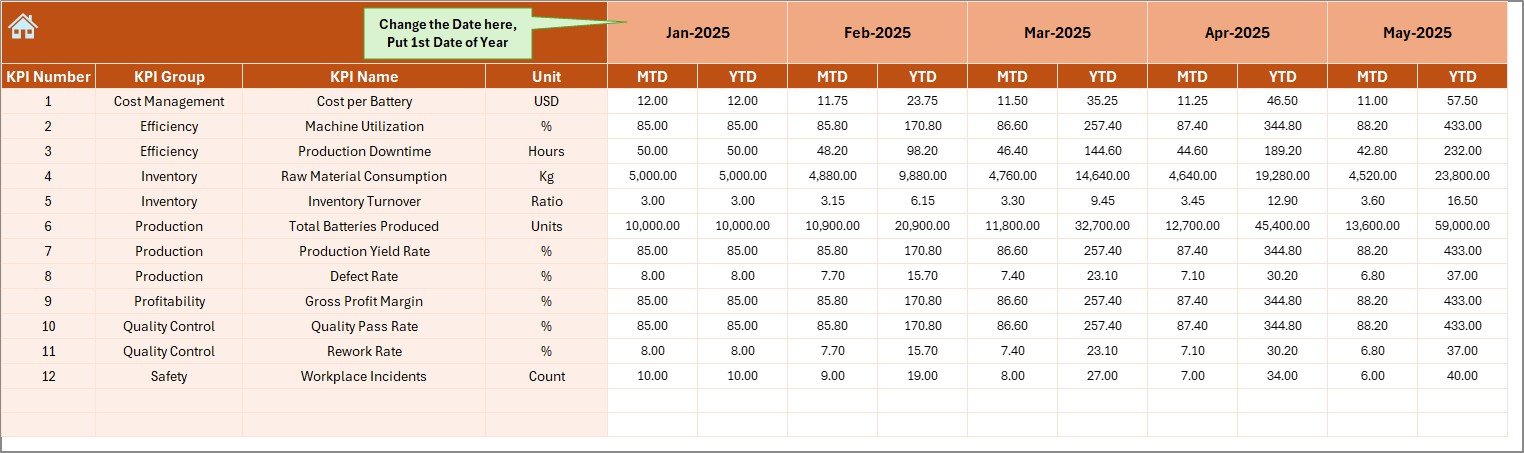
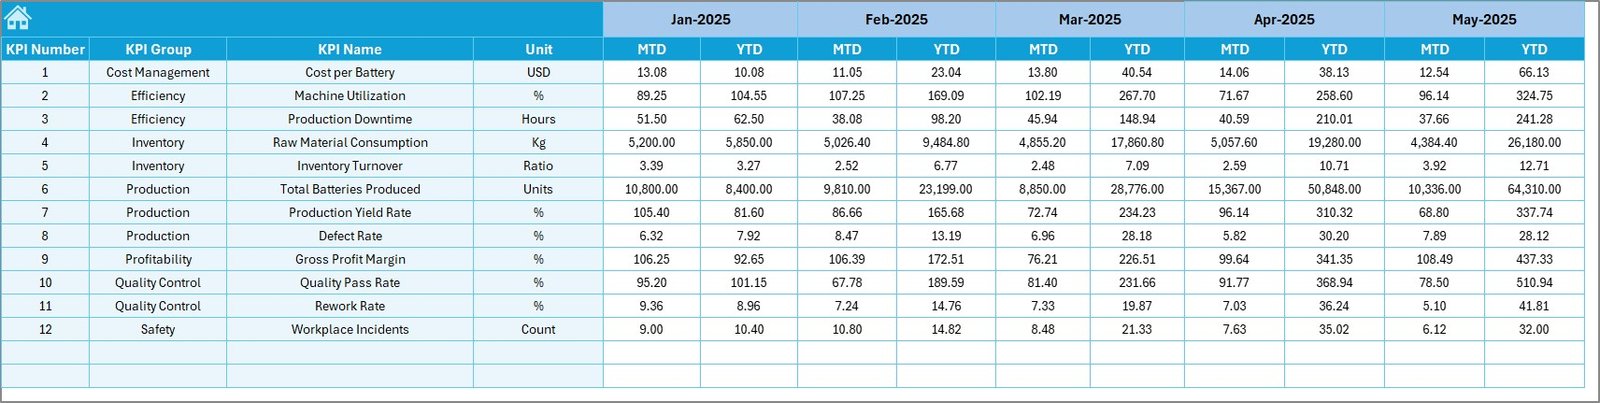
Actual Numbers Input Sheet – Data Entry Area
This sheet acts as the primary data input section.
Users enter actual KPI values for both:
- Month-to-Date (MTD)
- Year-to-Date (YTD)
The reporting period starts by entering the first month of the year in cell E1.
Because structured input ensures consistency, calculation errors reduce significantly.
Click to buy Battery Manufacturing KPI Dashboard in Excel
Target Sheet – Performance Planning
The Target Sheet stores KPI targets.
Users enter monthly targets for each KPI for both MTD and YTD values.
As a result:
- Performance expectations remain clear
- Managers track goal achievement easily
- Teams align operations with business objectives
Click to buy Battery Manufacturing KPI Dashboard in Excel
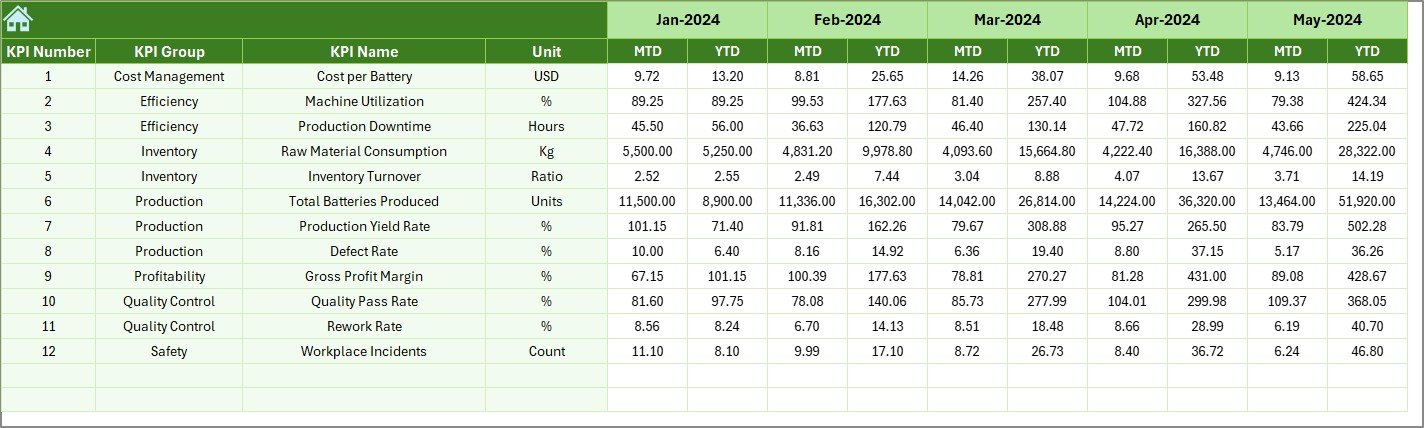
Previous Year Numbers Sheet – Historical Benchmarking
Historical comparison plays a crucial role in manufacturing improvement.
In this sheet, users enter previous year performance data. Consequently, the dashboard compares:
- Current performance vs last year
- Growth trends
- Performance improvement rates
Therefore, organizations evaluate progress accurately.
Click to buy Battery Manufacturing KPI Dashboard in Excel
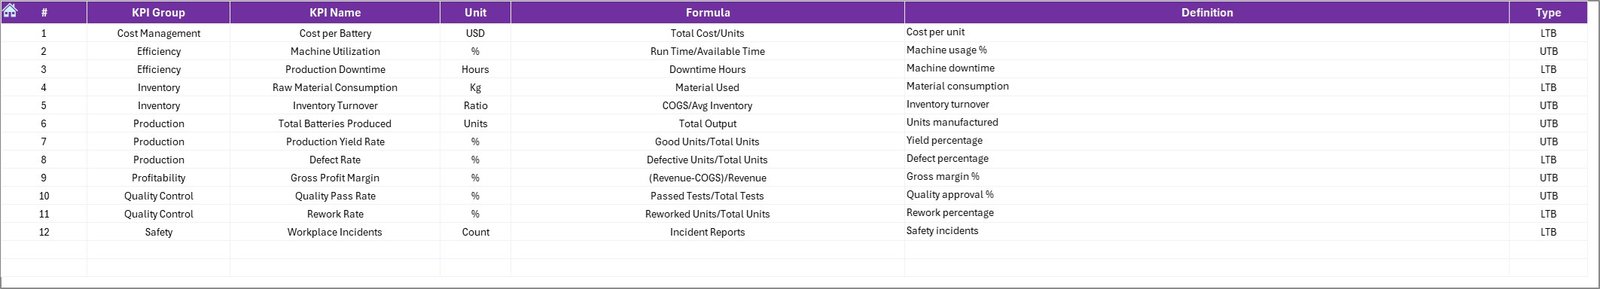
KPI Definition Sheet – KPI Documentation
This sheet works as a KPI dictionary.
Users define:
- KPI Name
- KPI Group
- Unit
- Formula
- KPI Definition
Because everyone follows standardized definitions, confusion reduces across departments.
Click to buy Battery Manufacturing KPI Dashboard in Excel
How Does the Dashboard Work Step by Step?
Many users ask: Is this dashboard difficult to use?
Actually, the process remains simple.
Step 1: Define KPIs
First, enter KPI details in the KPI Definition sheet.
Step 2: Input Targets
Next, add monthly targets in the Target sheet.
Step 3: Enter Actual Data
Then, record actual production values in the Actual Numbers Input sheet.
Step 4: Add Previous Year Data
After that, input historical data for comparison.
Step 5: Select Reporting Month
Finally, choose a month from the Dashboard dropdown.
Immediately, Excel updates all visuals automatically.
Advantages of Battery Manufacturing KPI Dashboard in Excel
Organizations gain multiple operational benefits after implementing this dashboard.
Improved Decision Making
Managers access real-time insights. Therefore, they make faster operational decisions.
Better Production Control
Teams monitor performance continuously. As a result, they reduce production inefficiencies.
Clear Performance Visibility
Visual indicators simplify complex data analysis.
Cost Optimization
Companies identify waste areas quickly and control manufacturing costs.
Historical Performance Comparison
Year-over-year comparison highlights improvement opportunities.
Easy Implementation
Since Excel remains widely available, companies avoid expensive software investments.
How Does This Dashboard Improve Manufacturing Efficiency?
Efficiency improves because the dashboard connects planning and execution.
For example:
- Production managers track utilization daily.
- Quality teams monitor defect trends.
- Leadership reviews performance summaries instantly.
Consequently, departments collaborate more effectively.
Moreover, automated calculations eliminate manual reporting effort. Therefore, teams focus on improvement instead of data preparation.
Best Practices for the Battery Manufacturing KPI Dashboard in Excel
To achieve maximum value, organizations should follow proven best practices.
- Select Meaningful KPIs
Choose metrics directly linked to production goals.
- Update Data Regularly
Enter data consistently every month. Otherwise, trends become inaccurate.
- Maintain Data Accuracy
Validate inputs before updating dashboards.
- Use Standard KPI Definitions
Ensure every department understands KPI formulas.
- Review Trends Instead of Single Values
Always analyze trends rather than isolated numbers.
- Limit KPI Overload
Too many KPIs reduce clarity. Therefore, focus on critical metrics.
- Conduct Monthly Performance Reviews
Use dashboard insights during management meetings.
Who Can Benefit from This Dashboard?
This dashboard supports multiple roles within battery manufacturing organizations.
- Production Managers
- Plant Heads
- Quality Control Teams
- Operations Analysts
- Maintenance Managers
- Business Executives
Because each role views performance differently, the dashboard provides flexible insights for everyone.
Why Choose Excel for KPI Dashboards?
Many companies wonder whether Excel still remains relevant compared to modern BI tools.
Interestingly, Excel offers powerful advantages:
- Easy customization
- No additional software cost
- Familiar interface
- Flexible formulas
- Quick deployment
Therefore, small and medium manufacturers prefer Excel dashboards for operational tracking.
Future Scope of KPI Dashboards in Battery Manufacturing
As battery technology evolves, KPI dashboards will become even more critical.
Future dashboards may include:
- Automated data integration
- IoT production monitoring
- Predictive maintenance analytics
- AI-based performance forecasting
However, Excel dashboards still serve as the foundation for structured performance monitoring.
Conclusion
Battery manufacturing requires precision, efficiency, and continuous monitoring. Without structured KPI tracking, organizations struggle to maintain operational excellence.
The Battery Manufacturing KPI Dashboard in Excel provides a practical and powerful solution. It centralizes performance data, simplifies analysis, and enables faster decision-making.
Moreover, its structured worksheets — including dashboard views, trend analysis, input sheets, and KPI definitions — create a complete performance management framework.
Therefore, organizations that adopt KPI dashboards gain better visibility, improved efficiency, and stronger operational control.
In a competitive energy market, data-driven decision-making no longer remains optional. Instead, it becomes essential for sustainable growth.
Frequently Asked Questions (FAQs)
- What is a Battery Manufacturing KPI Dashboard?
It is an Excel-based tool that tracks production, quality, and operational KPIs using visual dashboards and performance comparisons.
- Can beginners use this dashboard?
Yes. The dashboard uses structured input sheets and dropdown selections, so beginners can operate it easily.
- What is MTD and YTD in the dashboard?
- MTD (Month-to-Date): Performance within the selected month.
- YTD (Year-to-Date): Performance accumulated since the beginning of the year.
- Why compare with previous year data?
Previous year comparison helps organizations measure growth and performance improvement.
- How often should the dashboard be updated?
Organizations should update data monthly or weekly depending on reporting requirements.
- Can companies customize KPIs?
Yes. Users can modify KPI definitions, formulas, and targets based on operational needs.
- Is Excel suitable for manufacturing analytics?
Yes. Excel provides flexible analysis, automation, and visualization features ideal for KPI tracking.
- Does the dashboard require advanced Excel skills?
No. Basic Excel knowledge is enough to operate the dashboard effectively.
Visit our YouTube channel to learn step-by-step video tutorials
Watch the step-by-step video tutorial:
Click to buy Battery Manufacturing KPI Dashboard in Excel