Managing nuclear energy operations demands accuracy, safety, and continuous performance monitoring. However, many power plants still rely on scattered spreadsheets and manual tracking. As a result, decision-makers struggle to monitor performance, detect risks, and improve efficiency on time.Therefore, organizations need a structured and dynamic reporting system. The Nuclear Energy Operations KPI Dashboard in Excel solves this problem effectively. It helps operations teams track key performance indicators (KPIs), compare targets, analyze trends, and improve safety and productivity using one centralized Excel dashboard.
In this detailed guide, you will learn everything about the Nuclear Energy Operations KPI Dashboard in Excel, including its structure, features, benefits, best practices, and frequently asked questions.
What Is a Nuclear Energy Operations KPI Dashboard in Excel?
A Nuclear Energy Operations KPI Dashboard in Excel is a ready-to-use performance monitoring tool that tracks operational, safety, maintenance, and efficiency KPIs in nuclear power plants.
Instead of reviewing multiple reports, managers can:
- Monitor monthly performance
- Compare actual vs target results
- Analyze year-to-date trends
- Review previous year comparisons
- Evaluate KPI definitions and formulas
Consequently, leadership teams gain clear visibility into plant performance and can make data-driven decisions quickly.
Why Do Nuclear Energy Operations Need a KPI Dashboard?
Nuclear power plants operate in a highly regulated and safety-focused environment. Therefore, tracking KPIs becomes essential.
Without structured monitoring:
- Safety risks may increase
- Equipment downtime may go unnoticed
- Regulatory compliance gaps may appear
- Efficiency losses may reduce profitability
However, when teams use a KPI dashboard:
- They track performance in real time
- They identify gaps quickly
- They improve accountability
- They enhance decision-making
As a result, the organization improves operational stability and safety standards.
Key Features of the Nuclear Energy Operations KPI Dashboard in Excel
This dashboard contains 7 structured worksheets, and each sheet plays an important role in performance management.
Summary Page – The Control Center
The Summary Page works as an index sheet.
Here, you get:
- 6 navigation buttons
- Quick access to all sheets
- Smooth movement across the dashboard
Therefore, users can navigate easily without wasting time.
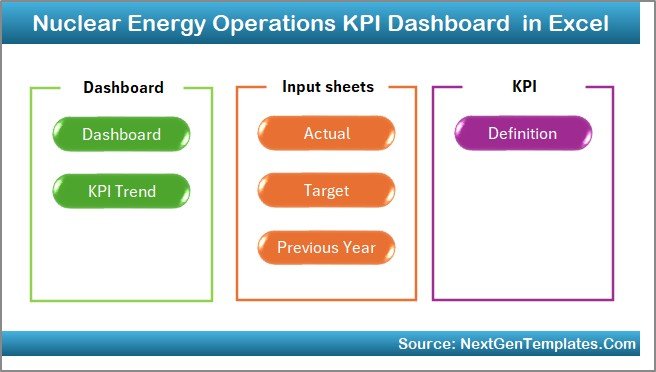
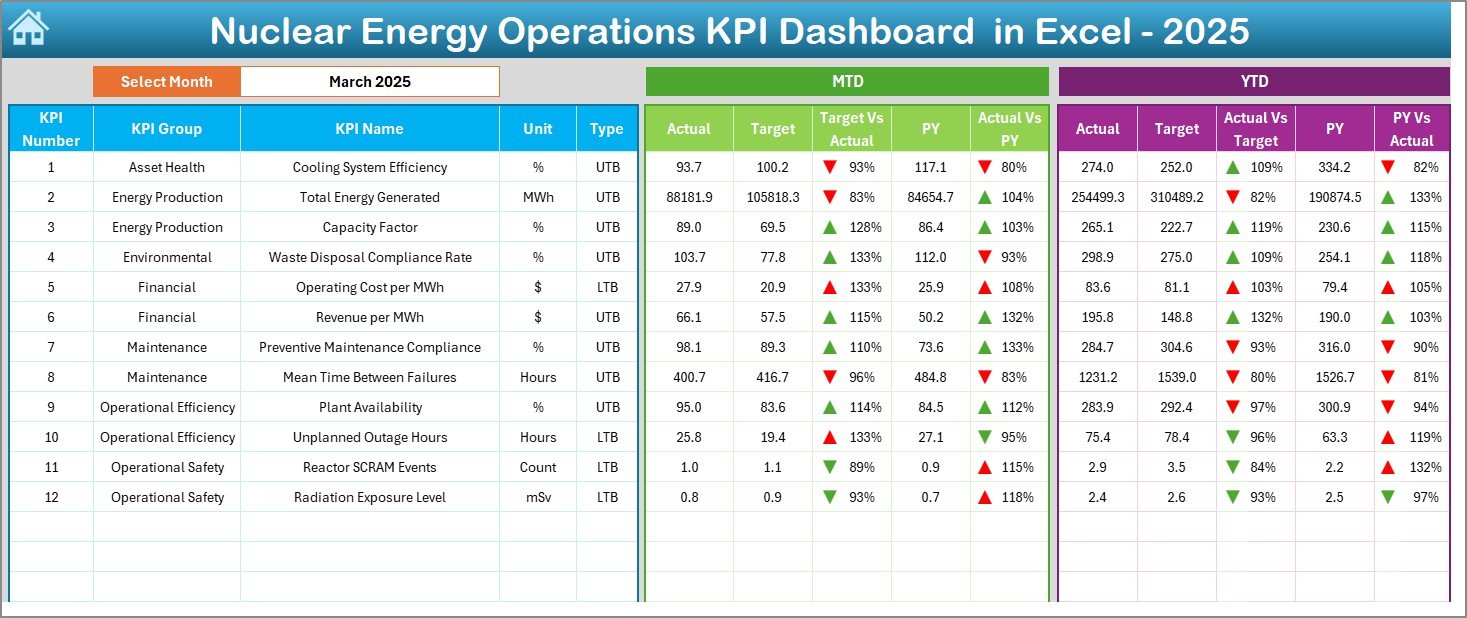
Dashboard Sheet – The Main Performance View
The Dashboard Sheet serves as the core of the system.
Month Selection Feature
On cell D3, you can select the month from a drop-down list. Once you change the month:
- All numbers update automatically
- Charts refresh instantly
- KPI comparisons adjust dynamically
This feature allows managers to review performance month by month.
MTD and YTD Performance Tracking
The dashboard displays:
- MTD Actual
- MTD Target
- MTD Previous Year
- Target vs Actual comparison
- Previous Year vs Actual comparison
Additionally, it shows:
- YTD Actual
- YTD Target
- YTD Previous Year
- YTD comparisons
Moreover, the dashboard uses conditional formatting with up and down arrows. Therefore, managers instantly identify positive or negative performance trends.
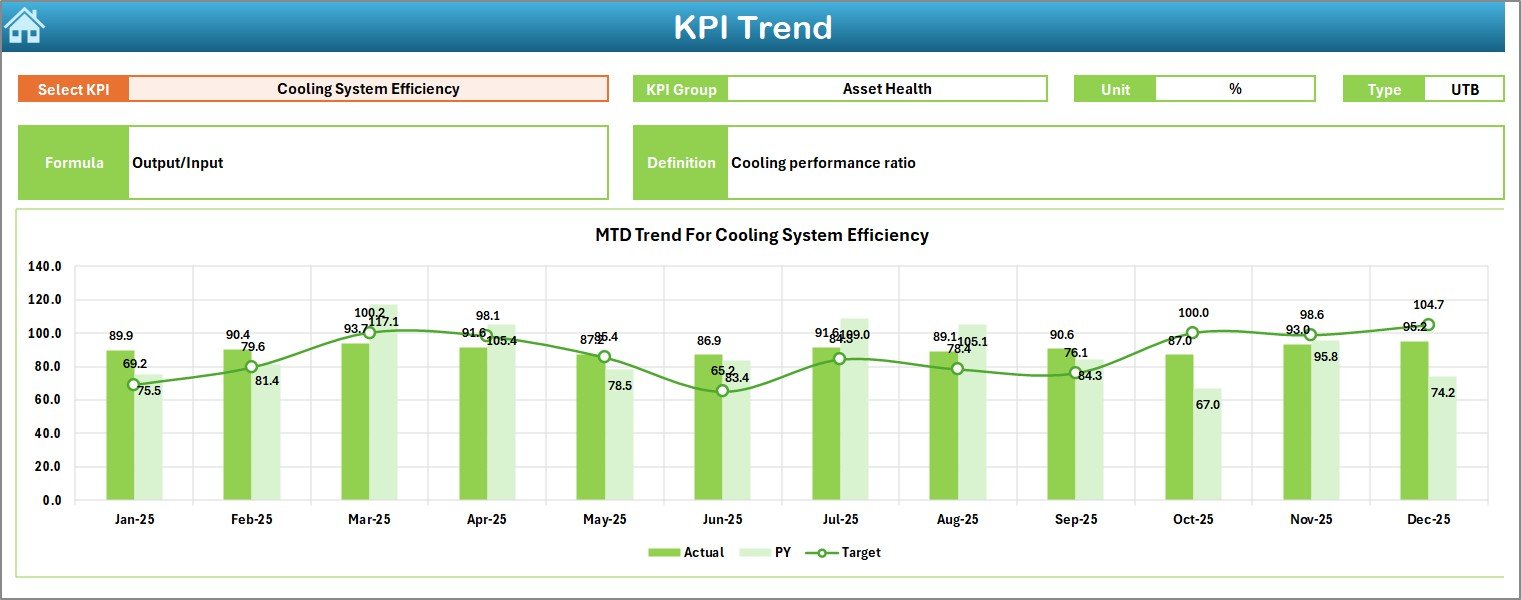
Trend Sheet – KPI Deep Analysis
The Trend Sheet allows deeper analysis.
On cell C3, you can select a KPI from the drop-down list.
Once selected, the sheet displays:
- KPI Group
- Unit of Measurement
- Type of KPI (Lower is Better / Higher is Better)
- Formula
- KPI Definition
Furthermore, it shows:
- MTD trend chart (Actual vs Target vs Previous Year)
- YTD trend chart (Actual vs Target vs Previous Year)
Therefore, management can understand not only the numbers but also the meaning behind each KPI.
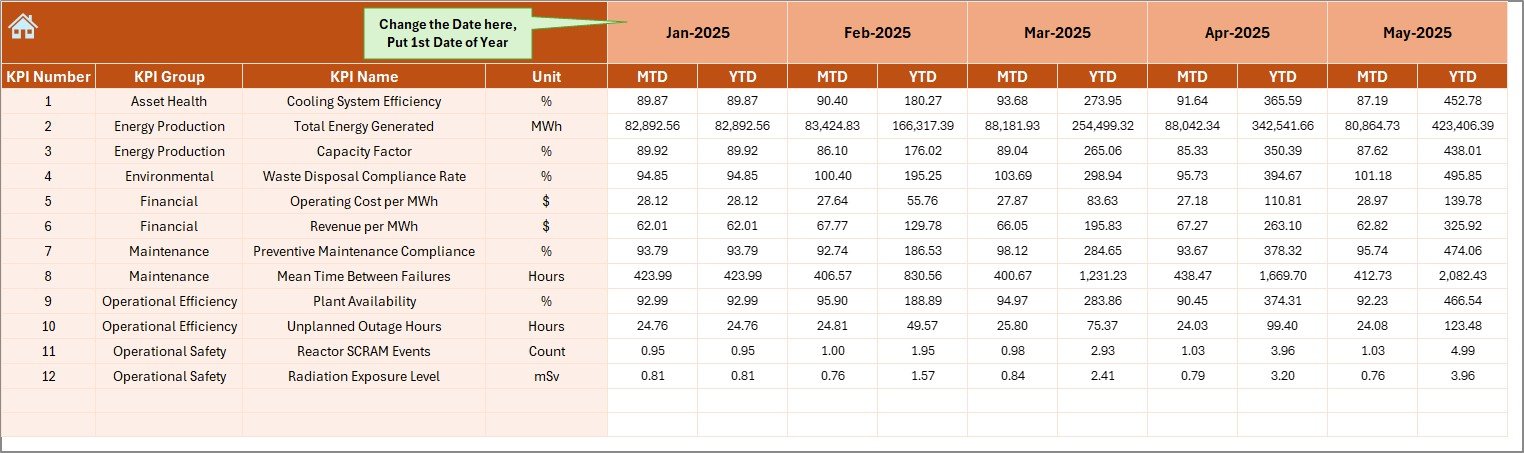
Actual Numbers Input Sheet – Data Entry Panel
This sheet allows you to input actual performance numbers.
You can:
- Change the starting month in cell E1
- Enter MTD and YTD actual data
- Update monthly performance figures
As a result, the dashboard updates automatically.
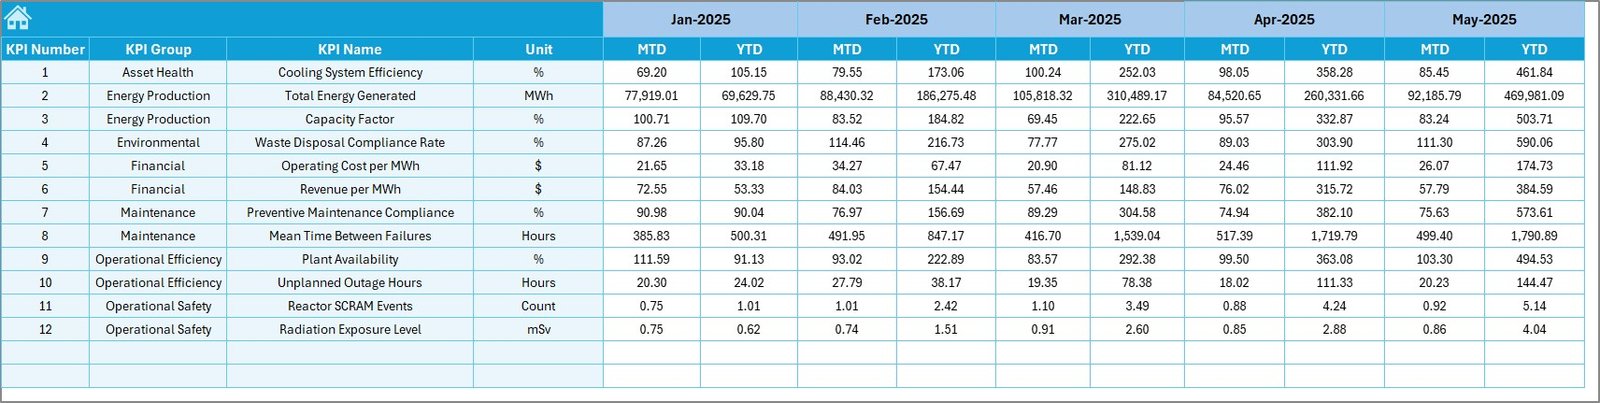
Target Sheet – Performance Goals
In this sheet, you enter:
- Monthly MTD target values
- YTD target values for each KPI
Therefore, managers can compare actual performance against defined goals.
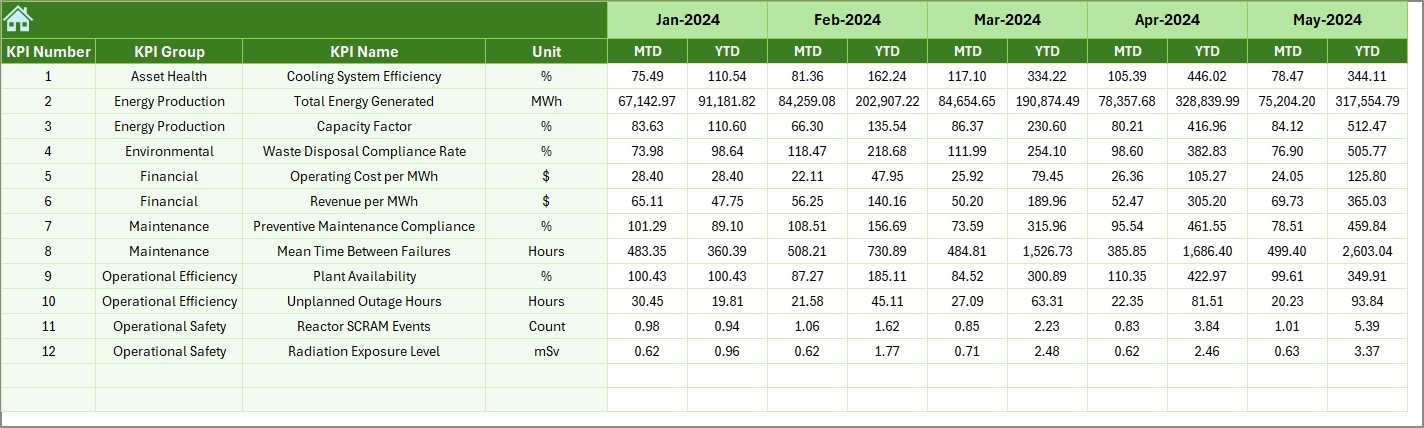
Previous Year Number Sheet – Historical Comparison
Here, you enter previous year data.
Once entered:
- The dashboard compares current vs previous year
- Trend analysis becomes more meaningful
Consequently, leadership teams identify long-term improvements or declines.
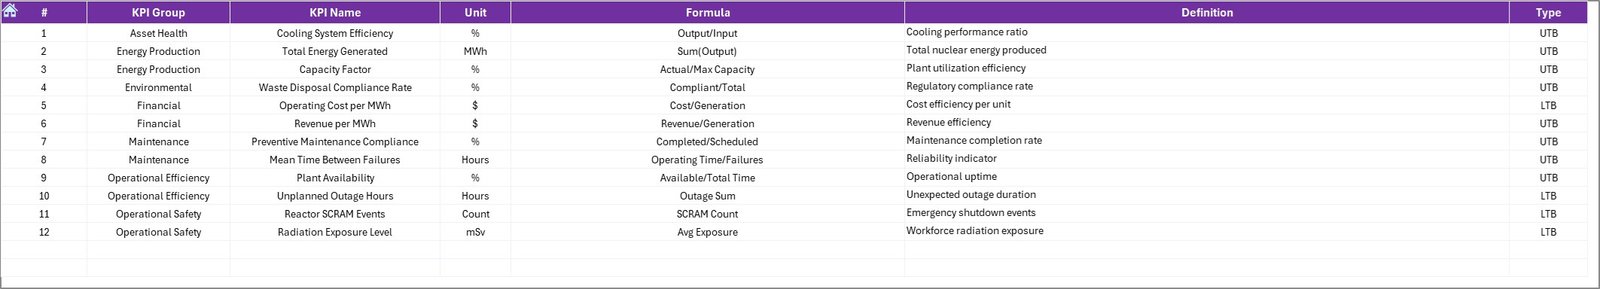
KPI Definition Sheet – KPI Documentation
This sheet stores:
- KPI Name
- KPI Group
- Unit
- Formula
- KPI Definition
Therefore, the dashboard maintains clarity and avoids confusion about KPI calculations.
What KPIs Can You Track in a Nuclear Energy Operations Dashboard?
You can customize the dashboard to track:
Safety KPIs
- Radiation exposure levels
- Safety incident frequency rate
- Lost time injury rate
- Regulatory compliance score
Operational KPIs
- Plant capacity factor
- Energy generation (MWh)
- Unplanned outage hours
- Reactor availability rate
Maintenance KPIs
- Preventive maintenance compliance
- Equipment downtime
- Maintenance backlog
- Work order completion rate
Financial KPIs
- Cost per MWh
- Operational expenditure
- Budget variance
- Revenue per unit
Thus, the dashboard supports complete operational control.
Advantages of Nuclear Energy Operations KPI Dashboard in Excel
- Improves Safety Monitoring
First, the dashboard highlights safety KPIs clearly. Therefore, teams respond quickly to safety deviations.
- Enhances Decision-Making
Because leaders see MTD and YTD comparisons instantly, they take faster actions.
- Increases Accountability
When teams track KPIs monthly, performance responsibility becomes clear.
- Saves Reporting Time
Instead of manual reports, managers use one structured dashboard. As a result, they save hours every month.
- Supports Compliance
Since nuclear operations require strict compliance, structured KPI tracking helps meet regulatory standards.
- Provides Historical Insights
With previous year comparison, teams understand long-term performance trends.
How Does This Dashboard Improve Operational Efficiency?
The dashboard improves efficiency in several ways.
First, it reduces data confusion.
Second, it centralizes all KPIs.
Third, it simplifies monthly reporting.
Moreover, managers detect performance gaps immediately.
Therefore, teams take corrective action faster.
Consequently, operational efficiency improves consistently.
How to Use the Nuclear Energy Operations KPI Dashboard in Excel?
Follow these steps:
- Open the Summary Page.
- Navigate to the KPI Definition Sheet.
- Enter KPI details and formulas.
- Enter monthly target values in the Target Sheet.
- Input actual values in the Actual Numbers Sheet.
- Enter previous year numbers.
- Go to the Dashboard Sheet and select the month in D3.
- Review MTD and YTD results.
- Use the Trend Sheet for detailed analysis.
Therefore, you can set up the dashboard quickly.
Best Practices for the Nuclear Energy Operations KPI Dashboard
- Define Clear KPIs
Always define measurable and realistic KPIs.
- Update Data Monthly
Enter data on time to maintain accuracy.
- Review Trends Regularly
Do not wait until year-end. Instead, review trends monthly.
- Involve Operations Teams
Encourage department heads to review KPI results regularly.
- Use Visual Indicators Effectively
Pay attention to conditional formatting arrows. They signal performance direction instantly.
- Align KPIs with Regulatory Standards
Make sure your KPIs support compliance requirements.
Who Can Use This Dashboard?
- Nuclear power plant managers
- Operations supervisors
- Safety officers
- Maintenance heads
- Regulatory compliance teams
- Energy sector analysts
Thus, the dashboard supports multiple stakeholders.
Conclusion
Nuclear energy operations require precision, safety control, and continuous monitoring. Therefore, organizations must use structured performance tracking systems.
The Nuclear Energy Operations KPI Dashboard in Excel provides a simple yet powerful solution. It centralizes KPIs, compares performance, tracks trends, and improves accountability.
Moreover, it helps teams detect risks early and improve operational efficiency consistently.
If your organization wants better control over safety, efficiency, and compliance, this dashboard offers the right foundation.
Frequently Asked Questions with Answers
- What is the purpose of a Nuclear Energy Operations KPI Dashboard?
It helps track operational, safety, and financial KPIs in one centralized Excel file.
- Can I customize KPIs in this dashboard?
Yes. You can add, edit, or modify KPIs in the KPI Definition Sheet.
- Does the dashboard update automatically?
Yes. Once you enter data in input sheets, the dashboard updates automatically.
- Can I track both MTD and YTD performance?
Yes. The dashboard shows both MTD and YTD comparisons.
- Is Excel suitable for nuclear operations KPI tracking?
Yes. Excel provides flexibility, automation, and structured analysis for performance tracking.
- Can this dashboard support regulatory compliance monitoring?
Yes. You can include compliance-related KPIs and track them monthly.
Visit our YouTube channel to learn step-by-step video tutorials
Watch the step-by-step video tutorial: