Managing a fleet without structured analytics creates confusion, rising costs, and operational delays. However, many fleet managers still rely on manual spreadsheets and disconnected reports. As a result, they struggle to control fuel expenses, monitor maintenance schedules, and reduce vehicle downtime.
Therefore, businesses need a centralized and interactive reporting system. The Fleet Management Dashboard in Power BI provides a complete solution. It transforms raw fleet data into powerful visual insights. Moreover, it helps fleet managers, logistics teams, and operations leaders track performance in real time.
In this detailed guide, you will learn:
-
What a Fleet Management Dashboard in Power BI is
-
Why fleet performance tracking is essential
-
Detailed explanation of all 5 dashboard pages
-
Key KPIs monitored in the dashboard
-
Advantages of using this dashboard
-
Best practices for implementation
-
Frequently Asked Questions
Let’s explore everything step by step.
Click to Purchases Fleet Management Dashboard in Power BI
What Is a Fleet Management Dashboard in Power BI?
A Fleet Management Dashboard in Power BI is an interactive analytics solution designed to monitor vehicle performance, fuel consumption, maintenance cost, and downtime.
Instead of analyzing scattered Excel sheets, managers can:
-
Track total vehicles and active vehicles
-
Monitor fuel costs and fuel consumption
-
Analyze maintenance expenses
-
Measure average downtime
-
Compare performance across regions and months
Because Power BI updates visuals instantly, users gain complete operational visibility.
Why Do Businesses Need a Fleet Management Dashboard?
Fleet operations involve multiple variables. Fuel prices fluctuate, maintenance expenses increase, and vehicle downtime affects productivity.
However, without structured tracking:
-
Fuel wastage goes unnoticed
-
Maintenance budgets exceed limits
-
Vehicle downtime increases
-
Regional inefficiencies remain hidden
Therefore, a Fleet Management Dashboard ensures control and accountability. Moreover, it enables data-driven decision-making.
Click to Purchases Fleet Management Dashboard in Power BI
Key Features of Fleet Management Dashboard in Power BI
This dashboard includes 5 powerful pages inside the Power BI Desktop application. Each page focuses on a specific area of fleet performance.
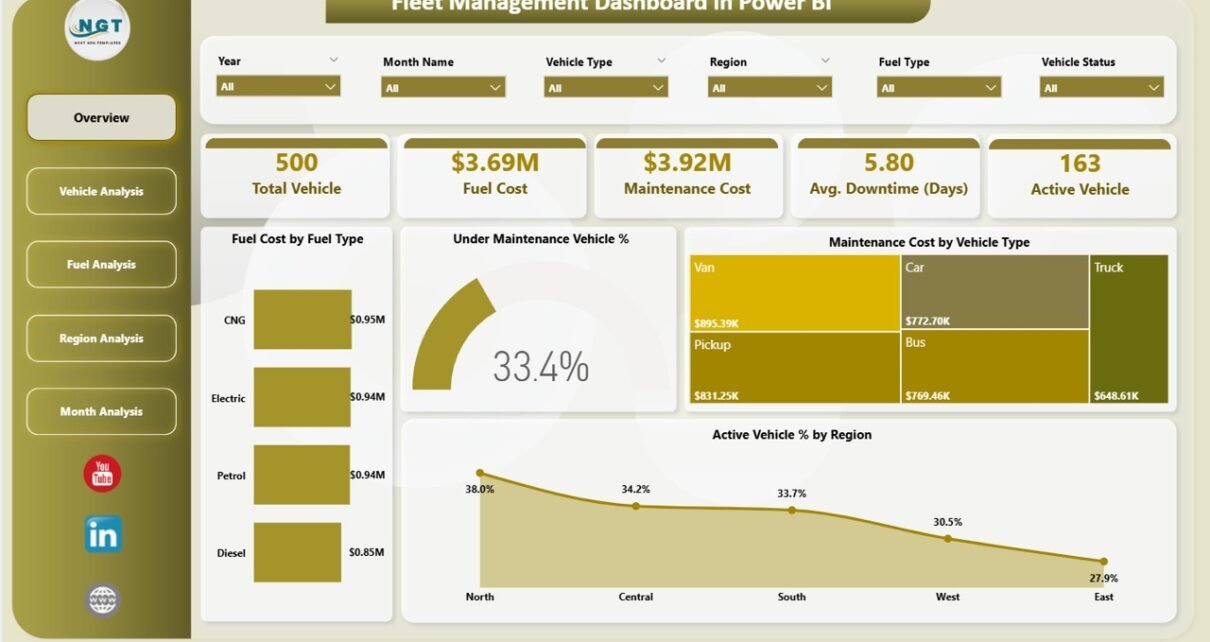
1️⃣ Overview Page – Complete Fleet Snapshot
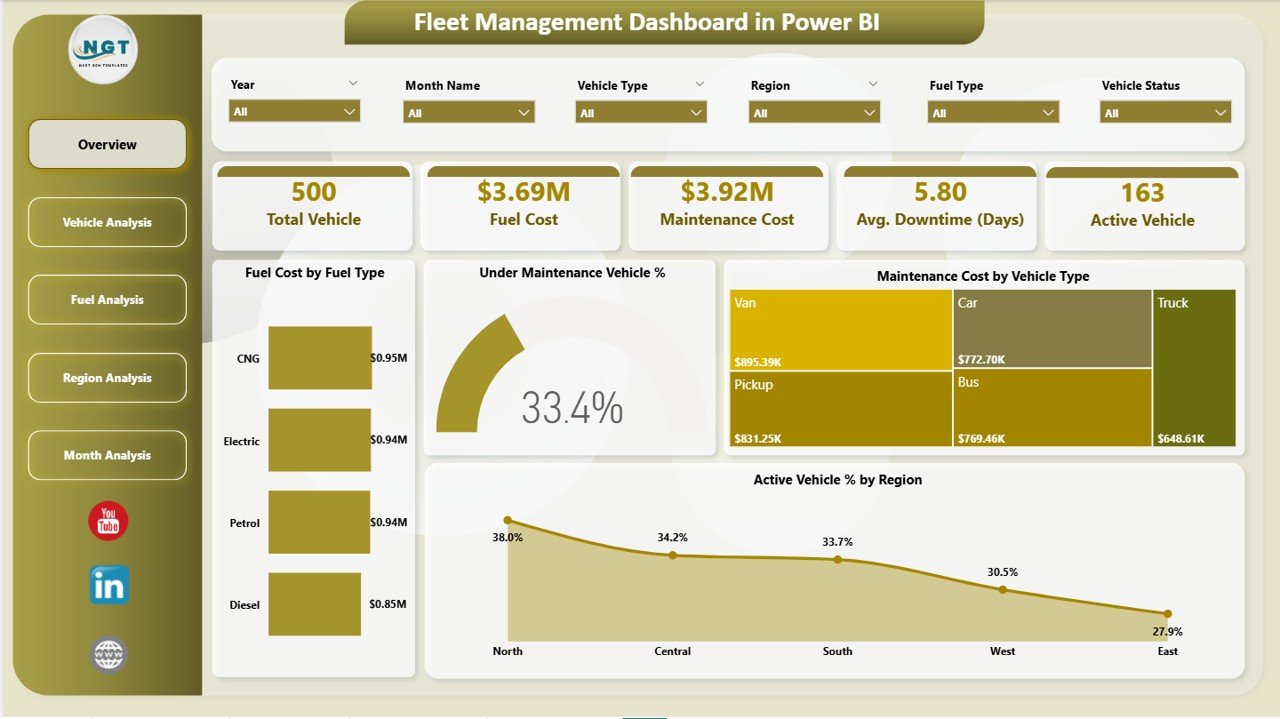
The Overview Page serves as the central control panel.
🔹 KPI Cards
At the top, you will find five important KPI cards:
-
Total Vehicles
-
Fuel Cost
-
Maintenance Cost
-
Average Downtime (Days)
-
Active Vehicles
These cards provide instant insight into fleet health.
🔹 Overview Charts
The page also includes four key charts:
-
Fuel Cost by Fuel Type – Identifies cost distribution across fuel categories
-
Under Maintenance Vehicle % – Shows percentage of vehicles under repair
-
Maintenance Cost by Vehicle Type – Highlights cost-intensive vehicle categories
-
Active Vehicle % by Region – Displays operational performance by region
Because this page combines cost, performance, and availability metrics, it gives managers a complete overview instantly.
Click to Purchases Fleet Management Dashboard in Power BI
2️⃣ Vehicle Analysis Page – Performance by Vehicle Type
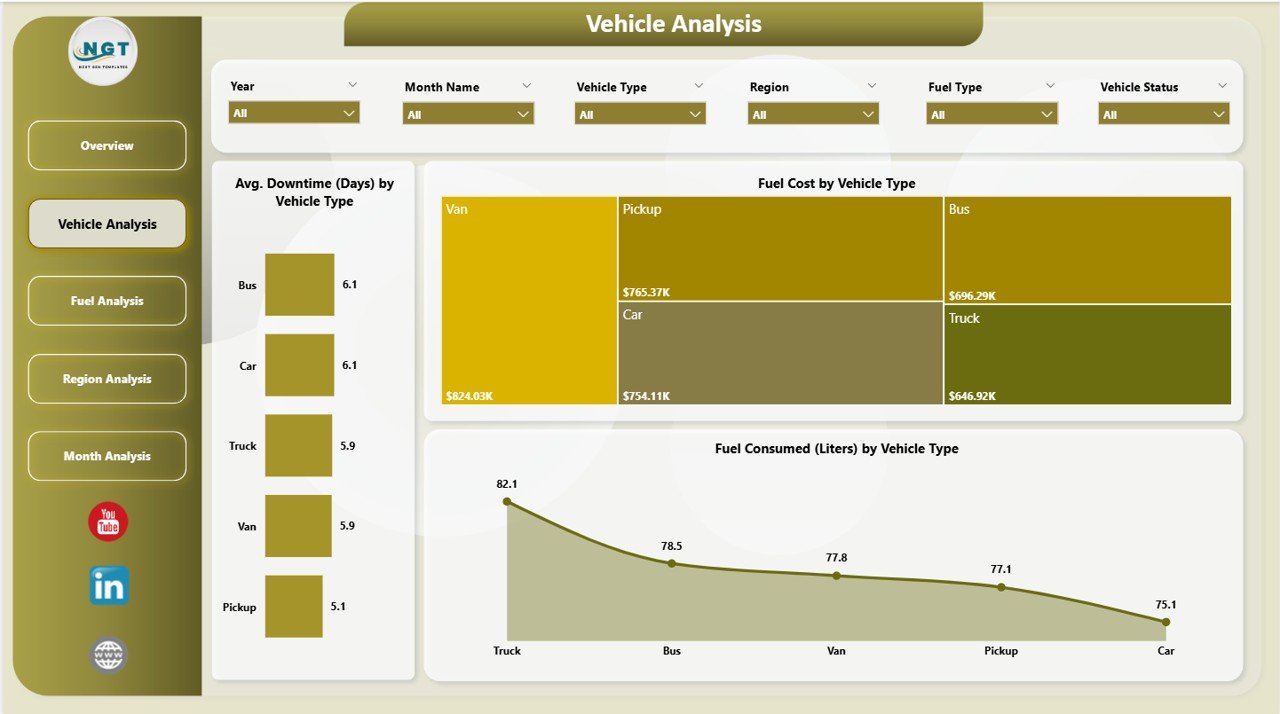
The Vehicle Analysis Page focuses on vehicle-level insights.
🔹 Charts Included
-
Average Downtime (Days) by Vehicle Type
-
Fuel Cost by Vehicle Type
-
Fuel Consumed (Liters) by Vehicle Type
This page helps answer important questions such as:
-
Which vehicle type consumes the most fuel?
-
Which category experiences higher downtime?
-
Which vehicles generate higher maintenance expenses?
Therefore, managers can optimize fleet composition and maintenance planning.
Click to Purchases Fleet Management Dashboard in Power BI
3️⃣ Fuel Analysis Page – Fuel Efficiency Insights
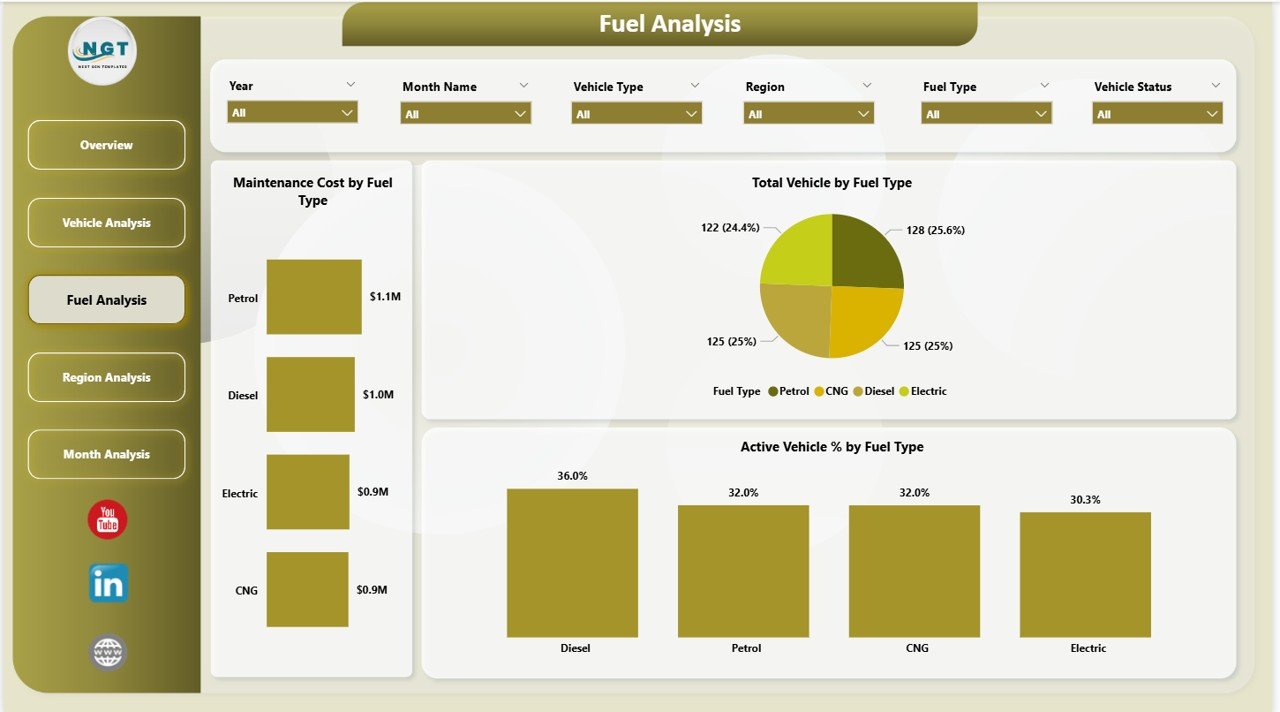
Fuel costs represent a major portion of fleet expenses. Therefore, this page focuses specifically on fuel-related analytics.
🔹 Charts Included
-
Maintenance Cost by Fuel Type
-
Total Vehicles by Fuel Type
-
Active Vehicle % by Fuel Type
With this data, managers can compare diesel, petrol, electric, or hybrid vehicle performance.
As a result, companies can evaluate whether switching fuel types improves cost efficiency.
4️⃣ Region Analysis Page – Geographic Performance Tracking
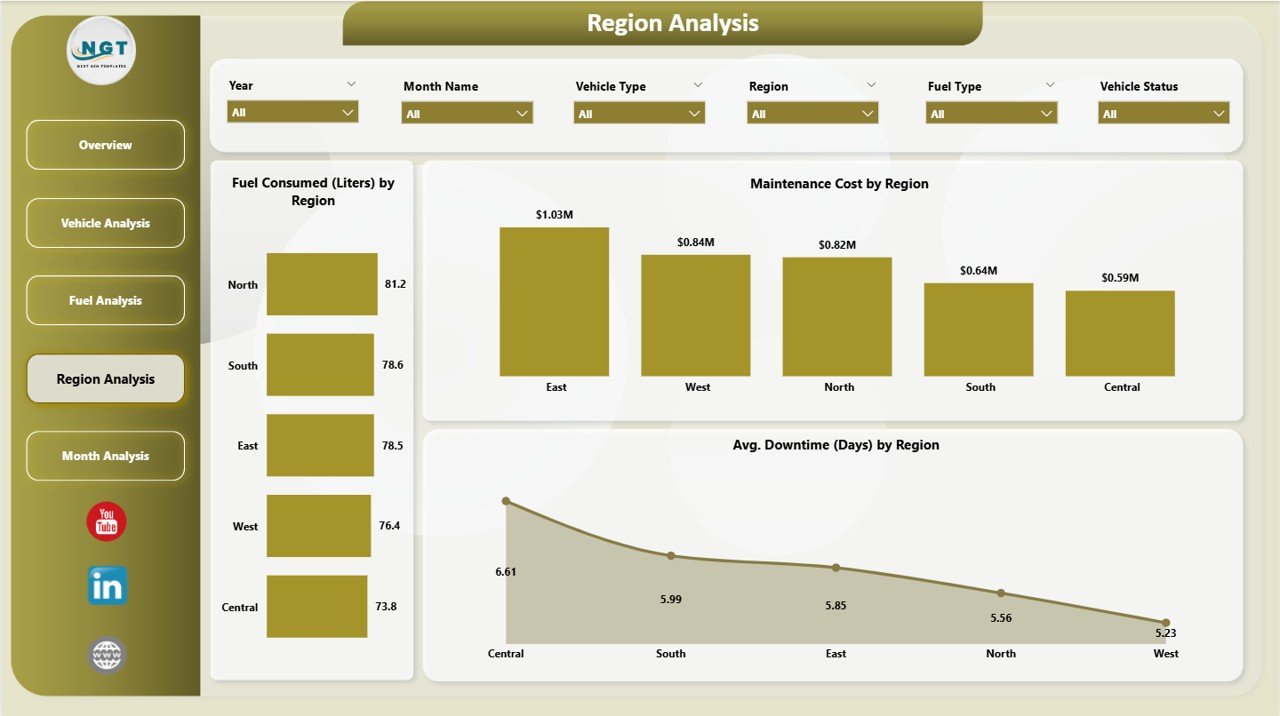
Fleet performance often varies by region. Therefore, this page provides geographic insights.
🔹 Charts Included
-
Fuel Consumed (Liters) by Region
-
Maintenance Cost by Region
-
Average Downtime (Days) by Region
Because this page highlights regional inefficiencies, managers can identify underperforming locations quickly.
For example:
-
One region may show high downtime
-
Another region may consume excessive fuel
-
A specific branch may exceed maintenance budgets
Therefore, corrective action becomes targeted and effective.
Click to Purchases Fleet Management Dashboard in Power BI
5️⃣ Monthly Trends Page – Time-Based Analysis
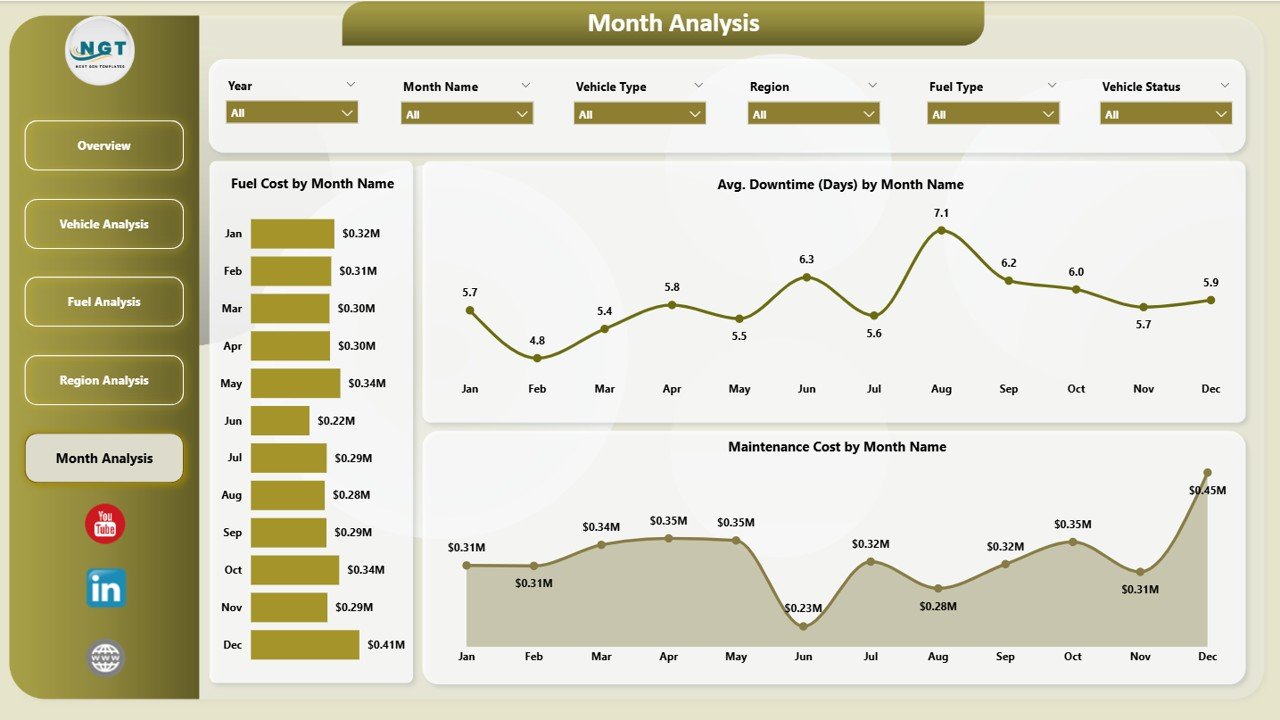
The Monthly Trends Page focuses on performance over time.
🔹 Charts Included
-
Fuel Cost by Month Name
-
Average Downtime (Days) by Month Name
-
Maintenance Cost by Month Name
This page helps managers analyze seasonal patterns and operational trends.
For instance:
-
Fuel cost may increase during peak delivery seasons
-
Downtime may rise during extreme weather conditions
-
Maintenance cost may spike at specific intervals
Therefore, trend analysis supports long-term planning.
Click to Purchases Fleet Management Dashboard in Power BI
What KPIs Can You Track in This Dashboard?
The Fleet Management Dashboard tracks critical KPIs such as:
🔹 Cost KPIs
-
Total Fuel Cost
-
Maintenance Cost
-
Cost by Vehicle Type
-
Cost by Region
🔹 Operational KPIs
-
Active Vehicle %
-
Under Maintenance Vehicle %
-
Average Downtime
🔹 Efficiency KPIs
-
Fuel Consumed (Liters)
-
Fuel Cost by Fuel Type
-
Downtime by Vehicle Type
Because these KPIs cover financial and operational performance, they provide complete fleet visibility.
Click to Purchases Fleet Management Dashboard in Power BI
Advantages of Fleet Management Dashboard in Power BI
Using this dashboard offers multiple benefits.
1️⃣ Real-Time Monitoring
Managers can track fleet performance instantly.
2️⃣ Cost Control
Fuel and maintenance costs become transparent.
3️⃣ Improved Vehicle Utilization
Active Vehicle % helps monitor asset usage.
4️⃣ Downtime Reduction
Downtime analysis supports preventive maintenance planning.
5️⃣ Better Regional Management
Region-level data improves operational efficiency.
6️⃣ Data-Driven Decisions
Interactive visuals support faster and smarter decisions.
7️⃣ Customizable Analytics
You can modify KPIs and filters according to business needs.
Click to Purchases Fleet Management Dashboard in Power BI
Best Practices for Fleet Management Dashboard in Power BI
To maximize dashboard value, follow these best practices.
1️⃣ Update Data Regularly
Refresh fuel, maintenance, and downtime data consistently.
2️⃣ Monitor Monthly Trends
Review the Monthly Trends page to detect patterns early.
3️⃣ Analyze Vehicle Types Separately
Identify high-cost vehicle categories.
4️⃣ Focus on Fuel Efficiency
Compare fuel consumption against cost.
5️⃣ Track Preventive Maintenance
Use downtime data to schedule maintenance before breakdowns occur.
6️⃣ Set Performance Benchmarks
Define acceptable downtime and cost thresholds.
7️⃣ Share Reports with Stakeholders
Present dashboard insights during management meetings.
How Does This Dashboard Improve Fleet Performance?
Because the dashboard centralizes data, it eliminates guesswork.
For example:
-
If fuel cost increases, managers can investigate fuel type or vehicle efficiency.
-
If downtime rises, teams can improve maintenance scheduling.
-
If regional performance declines, operations managers can take corrective action.
Therefore, the dashboard enables proactive management rather than reactive responses.
Who Should Use the Fleet Management Dashboard?
This dashboard benefits:
-
Logistics companies
-
Transportation providers
-
Delivery businesses
-
Construction companies
-
Utility service providers
-
Corporate fleet managers
Because fleet management impacts many industries, this solution supports diverse business models.
Conclusion
Fleet operations demand cost control, efficiency, and performance monitoring. However, traditional reporting methods often fail to provide complete visibility.
The Fleet Management Dashboard in Power BI solves this problem by centralizing fleet data into interactive reports. It tracks fuel costs, maintenance expenses, downtime, and vehicle performance across regions and time periods.
Moreover, it empowers managers to make informed decisions, reduce costs, and improve operational efficiency.
If you want better fleet control and smarter resource management, this dashboard becomes an essential tool for your organization.
Click to Purchases Fleet Management Dashboard in Power BI
Frequently Asked Questions (FAQs)
1️⃣ Can I customize the KPIs?
Yes, you can modify KPIs based on your fleet requirements.
2️⃣ Does the dashboard support multiple regions?
Yes, the Region Analysis page supports regional comparisons.
3️⃣ Can I track electric vehicles?
Yes, you can add electric vehicles under fuel type categories.
4️⃣ How often should I update the data?
You should update it monthly or weekly depending on operations.
5️⃣ Does it support downtime analysis?
Yes, the dashboard includes downtime metrics by vehicle type and region.
6️⃣ Can small businesses use this dashboard?
Yes, both small and large fleet operators can use it effectively.
7️⃣ Is this dashboard suitable for logistics companies?
Yes, logistics and transportation companies benefit greatly from it.
Click to Purchases Fleet Management Dashboard in Power BI
Visit our YouTube channel to learn step-by-step video tutorials