Railway infrastructure plays a vital role in transportation, logistics, and economic growth. Governments and railway authorities invest billions in building and maintaining rail networks, stations, tracks, and signaling systems. However, managing such a massive infrastructure network requires continuous monitoring and performance analysis.
Therefore, railway authorities need structured tools that help them track performance indicators efficiently. One such powerful solution is the Railway Infrastructure KPI Dashboard in Excel.
This dashboard helps railway management teams monitor key performance indicators, compare targets with actual results, analyze trends, and make data-driven decisions. Instead of relying on scattered reports, managers can track railway performance using one centralized and interactive Excel dashboard.
Click to Purchases Railway Infrastructure KPI Dashboard in Excel
In this comprehensive guide, you will learn everything about the Railway Infrastructure KPI Dashboard in Excel, including its features, advantages, best practices, and practical use cases.
What is a Railway Infrastructure KPI Dashboard in Excel?
A Railway Infrastructure KPI Dashboard in Excel is a structured Excel-based performance monitoring tool designed to track key railway infrastructure metrics.
Railway organizations handle numerous operational activities such as:
-
Track maintenance
-
Signal system monitoring
-
Infrastructure inspection
-
Train punctuality tracking
-
Asset utilization analysis
-
Safety monitoring
-
Capacity utilization
Because these operations generate large volumes of data, railway authorities need a system that organizes this information clearly.
The KPI dashboard collects railway performance data and presents it through:
-
Interactive charts
-
KPI indicators
-
Trend analysis
-
Target vs actual comparisons
As a result, railway managers can quickly evaluate operational efficiency and infrastructure performance.
Why Do Railway Organizations Need KPI Dashboards?
Railway infrastructure management involves multiple departments and complex operations. Without proper monitoring systems, organizations struggle to analyze performance.
A KPI dashboard solves these problems by creating a structured reporting system.
Key Reasons Railway Authorities Need KPI Dashboards
1. Centralized Performance Monitoring
Railway organizations manage thousands of infrastructure assets. A KPI dashboard brings all performance indicators into a single view.
Therefore, decision-makers can monitor infrastructure performance without searching through multiple reports.
2. Faster Decision Making
When managers view real-time KPI comparisons between targets and actual results, they quickly identify operational gaps.
As a result, they take corrective actions faster.
3. Data-Driven Management
Railway authorities rely on performance data to plan maintenance activities and infrastructure investments.
KPI dashboards transform raw data into meaningful insights.
4. Performance Transparency
KPI dashboards create transparency across departments. Managers easily evaluate whether teams meet their infrastructure performance targets.
Key Features of the Railway Infrastructure KPI Dashboard in Excel
The Railway Infrastructure KPI Dashboard in Excel includes several powerful features that make performance monitoring simple and effective.
This ready-to-use template contains 7 worksheets, each designed to perform a specific function.
Click to Purchases Railway Infrastructure KPI Dashboard in Excel
What Worksheets Are Included in the Railway Infrastructure KPI Dashboard?
1. Home Sheet
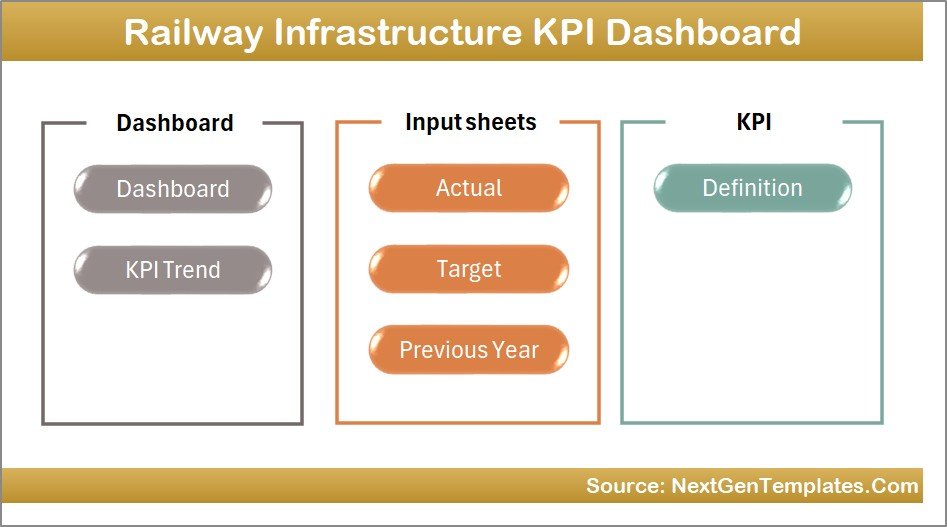
The Home Sheet acts as the navigation center of the dashboard.
This sheet contains six navigation buttons that allow users to jump directly to the respective worksheet.
Key benefits of the Home Sheet include:
-
Easy navigation between sheets
-
Quick access to dashboard sections
-
User-friendly interface
-
Organized dashboard structure
Because of this structure, users quickly navigate the dashboard without confusion.
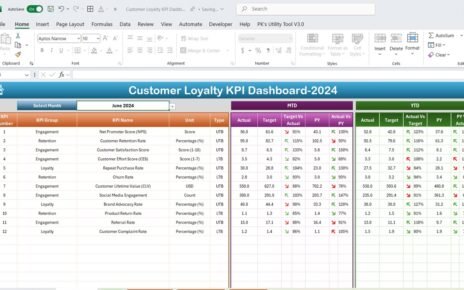
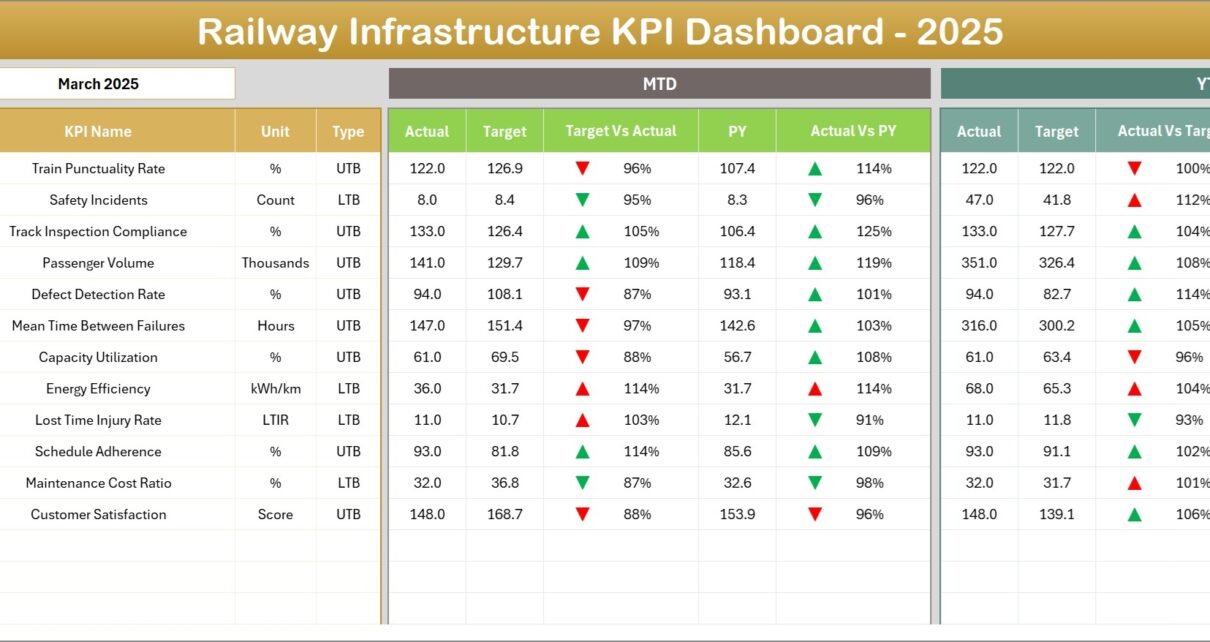
2. Dashboard Sheet
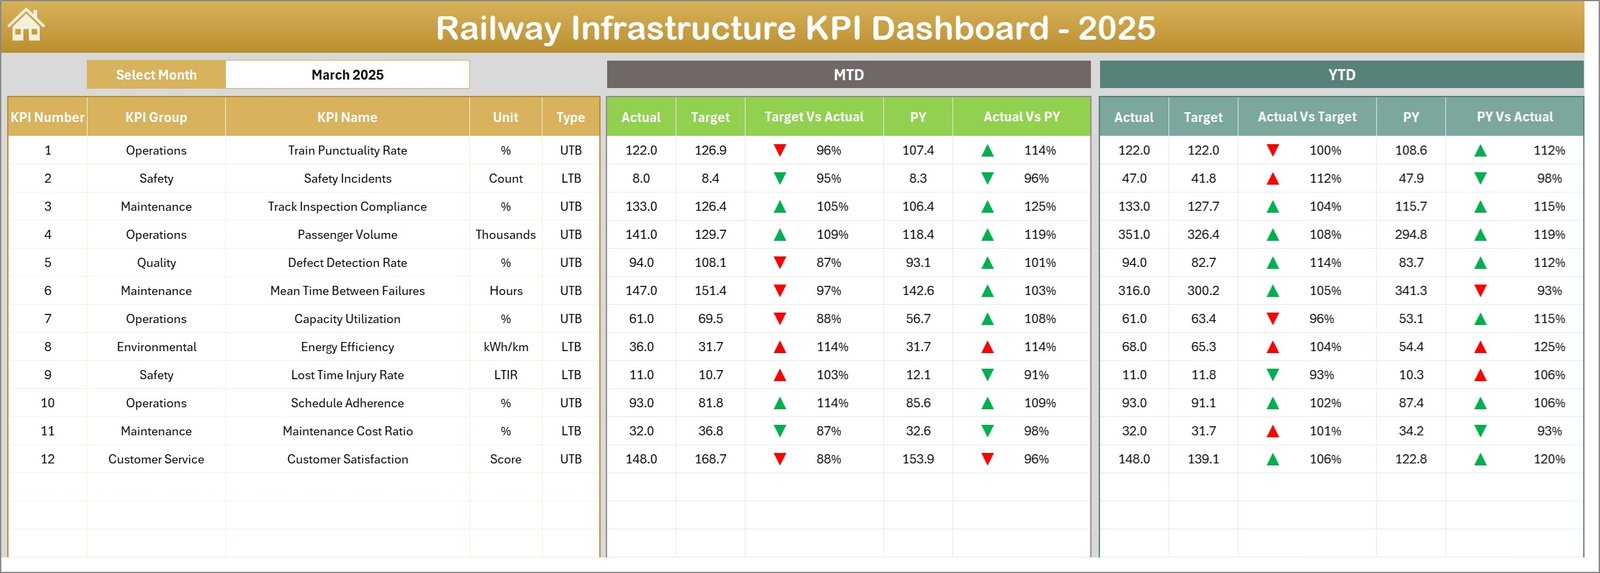
The Dashboard Sheet serves as the main reporting interface of the template.
This page displays all KPI performance metrics in a visually structured layout.
Interactive Month Selection
Users can select the month from the dropdown in cell D3. Once they choose a month, the dashboard automatically updates all performance metrics for that selected period.
KPI Performance Metrics Displayed
The dashboard shows the following KPI metrics:
-
MTD Actual
-
MTD Target
-
MTD Previous Year
Additionally, the dashboard calculates:
-
Target vs Actual
-
Previous Year vs Actual
Conditional formatting arrows visually indicate performance direction:
-
⬆️ Green Arrow – Performance Improved
-
⬇️ Red Arrow – Performance Declined
Year-To-Date Performance
The dashboard also shows:
-
YTD Actual
-
YTD Target
-
YTD Previous Year
This comparison helps railway managers analyze both short-term and long-term performance.
As a result, they quickly identify trends and operational gaps.
3. KPI Trend Sheet
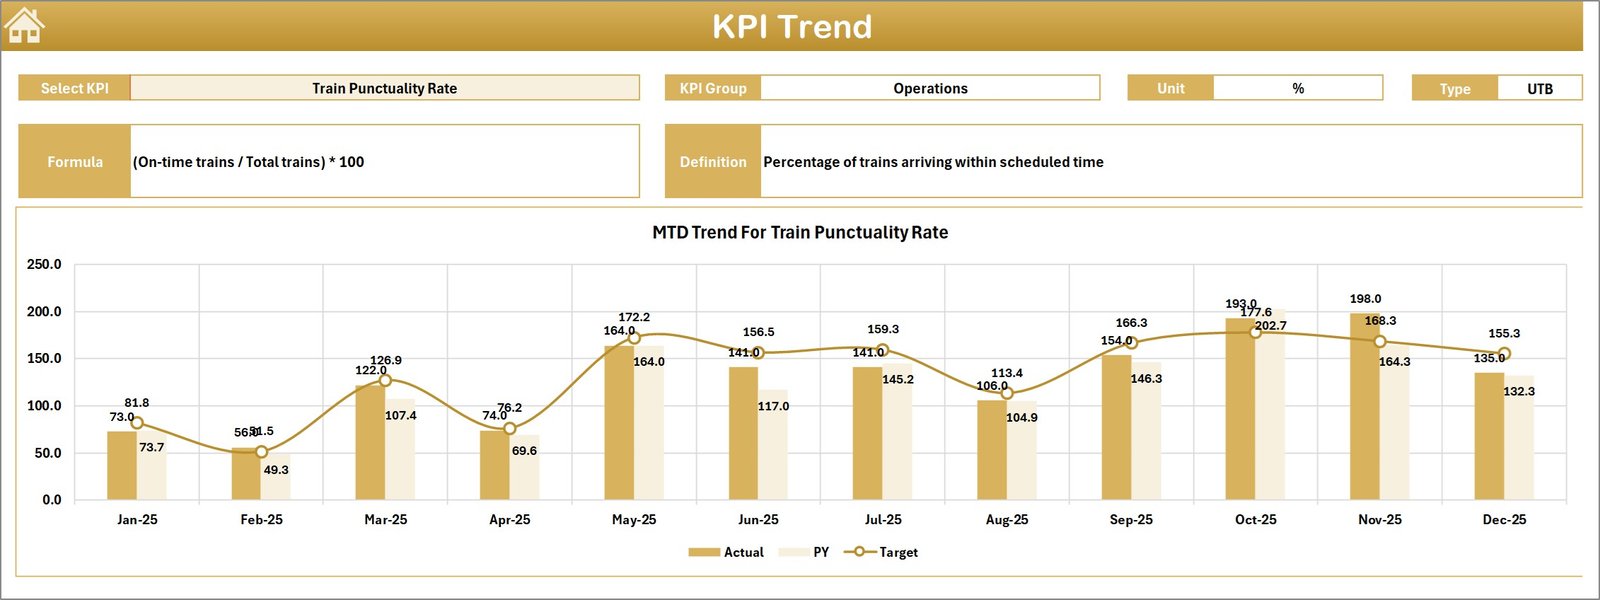
The KPI Trend Sheet provides detailed analysis for individual KPIs.
Users can select the KPI Name from the dropdown in cell C3.
Once selected, the dashboard automatically displays important KPI details.
Click to Purchases Railway Infrastructure KPI Dashboard in Excel
KPI Information Displayed
This section shows:
-
KPI Group
-
KPI Unit
-
KPI Type (Higher is Better / Lower is Better)
-
KPI Formula
-
KPI Definition
KPI Trend Analysis
The sheet also displays trend charts for:
-
MTD Actual
-
MTD Target
-
MTD Previous Year
And
-
YTD Actual
-
YTD Target
-
YTD Previous Year
These charts allow managers to analyze performance trends across time.
Therefore, railway teams can detect improvement areas and long-term infrastructure performance changes.
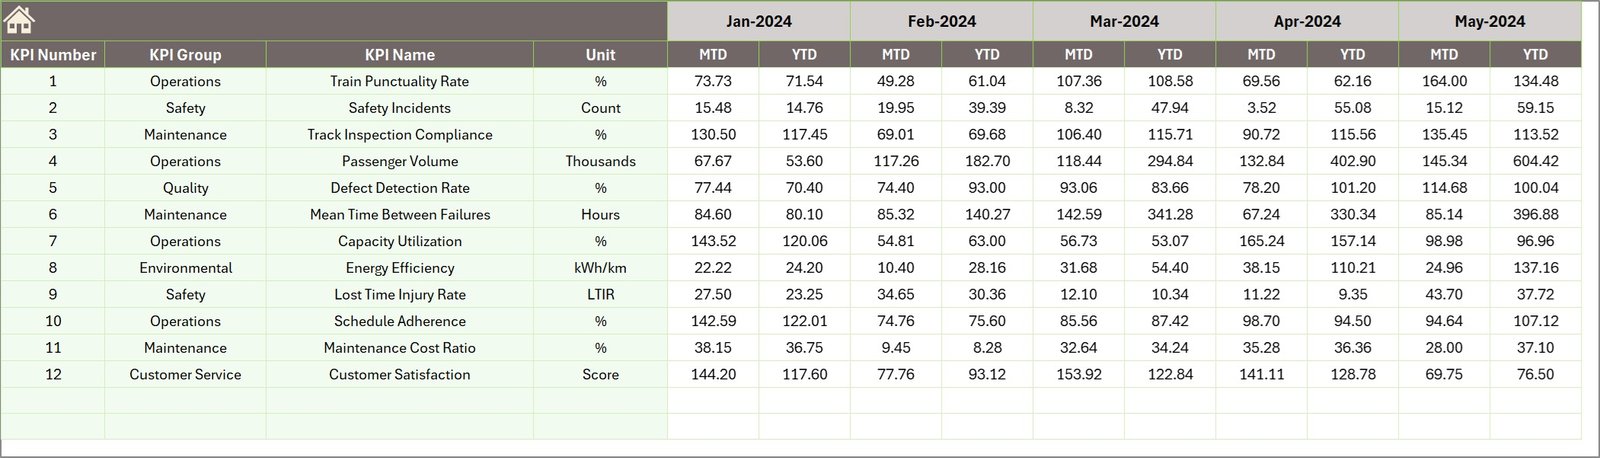
4. Actual Numbers Input Sheet
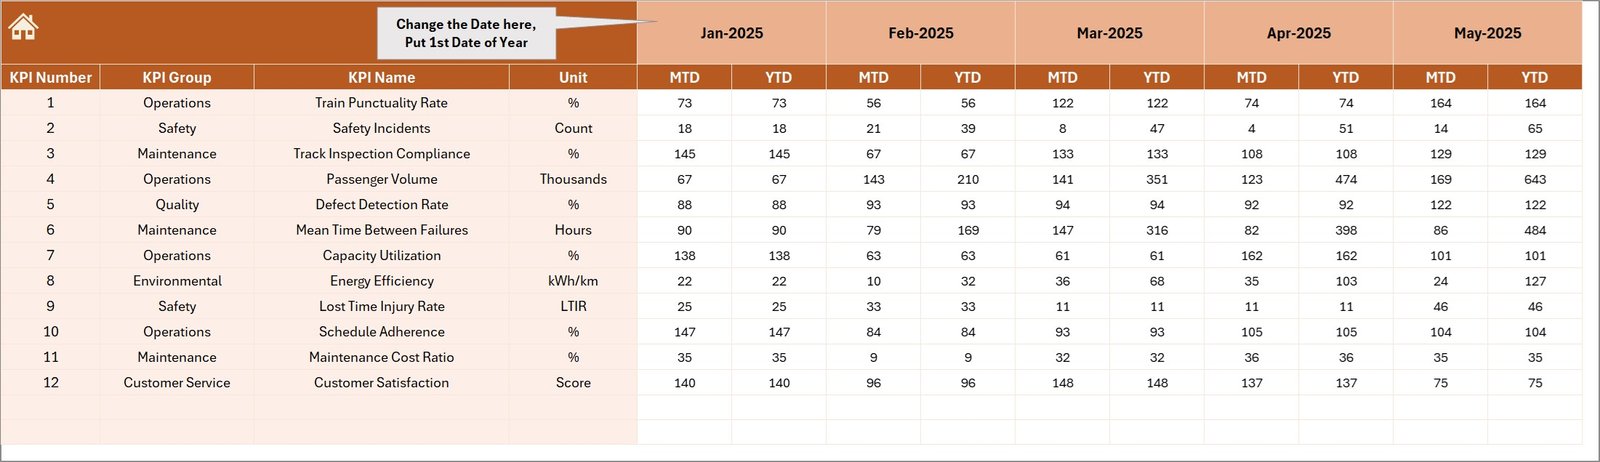
The Actual Numbers Input Sheet stores real operational data.
Users enter actual KPI values for each month.
Key Input Features
-
Enter MTD actual numbers
-
Enter YTD actual numbers
-
Select the starting month in cell E1
Once users enter data, the dashboard automatically updates all reports and charts.
Therefore, teams do not need manual recalculations.
5. Target Sheet
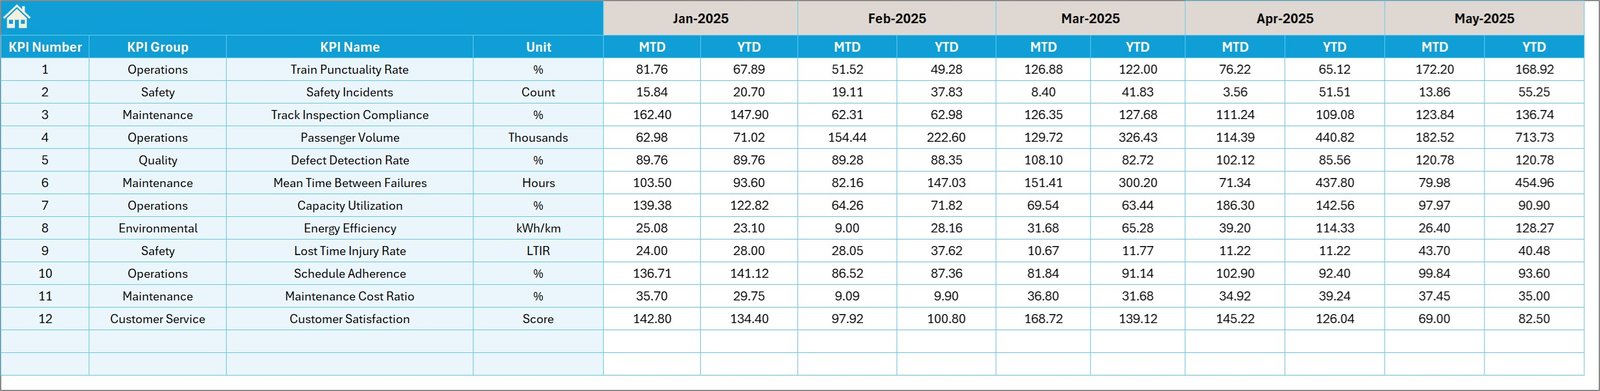
The Target Sheet stores planned KPI targets.
Users enter monthly KPI targets for both:
-
MTD Target
-
YTD Target
These targets help organizations evaluate performance against expected goals.
For example:
-
Track maintenance targets
-
Infrastructure inspection targets
-
Safety performance targets
6. Previous Year Numbers Sheet
Click to Purchases Railway Infrastructure KPI Dashboard in Excel
The Previous Year Sheet stores historical KPI data.
Users enter KPI values from the previous year.
The dashboard then compares current performance against historical results.
This comparison helps organizations evaluate:
-
Performance improvement
-
Infrastructure growth
-
Operational efficiency
7. KPI Definition Sheet
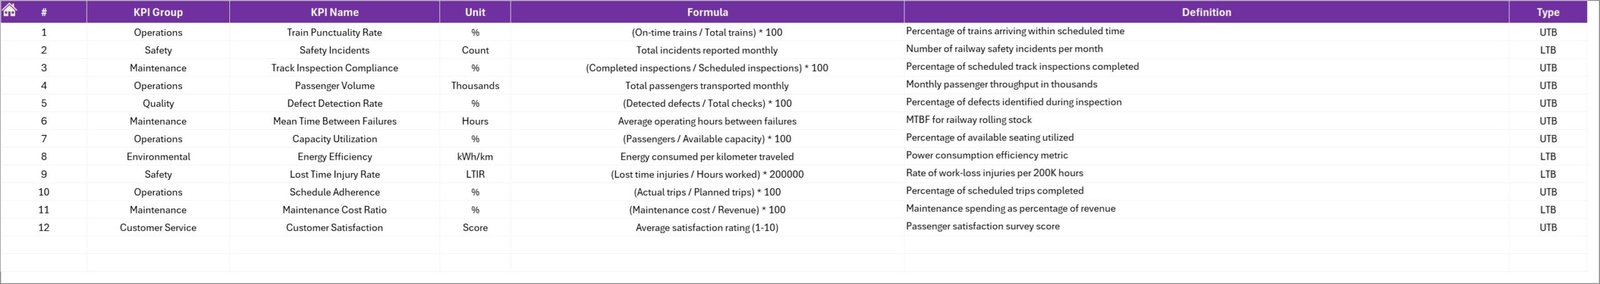
The KPI Definition Sheet documents KPI information.
Users enter the following details:
-
KPI Name
-
KPI Group
-
KPI Unit
-
KPI Formula
-
KPI Definition
This documentation ensures everyone understands how KPIs work.
As a result, organizations maintain consistent KPI measurement.
What KPIs Can Railway Infrastructure Dashboards Track?
Railway infrastructure dashboards can track a wide range of performance indicators.
Some common railway KPIs include:
Infrastructure Performance KPIs
-
Track Availability %
-
Track Failure Rate
-
Signal System Availability
-
Bridge Inspection Compliance
-
Infrastructure Maintenance Cost
Operational KPIs
-
Train Punctuality Rate
-
Average Train Delay
-
Capacity Utilization
-
Asset Utilization Rate
Safety KPIs
-
Safety Incidents
-
Accident Rate
-
Signal Failures
-
Track Defects
Financial KPIs
-
Maintenance Budget Utilization
-
Infrastructure Investment Efficiency
-
Cost per Kilometer of Track
These KPIs help railway authorities monitor operational health.
Advantages of Railway Infrastructure KPI Dashboard in Excel
Organizations gain several benefits when they implement KPI dashboards.
1. Easy Performance Monitoring
Managers view all important railway KPIs on a single dashboard.
Therefore, they analyze infrastructure performance faster.
2. Improved Decision Making
The dashboard provides clear comparisons between:
-
Actual results
-
Target values
-
Previous year performance
Because of this, decision-makers quickly identify problems.
3. Better Infrastructure Planning
Railway authorities plan maintenance schedules based on KPI trends.
As a result, infrastructure performance improves.
4. Increased Operational Transparency
KPI dashboards create transparency across railway departments.
Everyone clearly understands infrastructure performance levels.
5. Historical Performance Analysis
The dashboard compares current results with previous year data.
Therefore, organizations identify long-term performance trends.
6. Easy Data Management
Excel provides a familiar platform for data entry and analysis.
Therefore, teams adopt the dashboard without additional training.
Best Practices for Railway Infrastructure KPI Dashboard
Click to Purchases Railway Infrastructure KPI Dashboard in Excel
Organizations should follow best practices to maximize the benefits of KPI dashboards.
1. Select Relevant KPIs
Railway organizations should focus only on meaningful KPIs.
Too many KPIs create confusion and reduce clarity.
2. Maintain Accurate Data
Teams should regularly update actual numbers.
Accurate data ensures reliable performance insights.
3. Monitor KPIs Monthly
Monthly monitoring helps organizations detect operational problems early.
Therefore, managers take corrective actions quickly.
4. Use Clear KPI Definitions
Every KPI should include a definition and formula.
Clear documentation prevents misunderstandings.
5. Compare Performance with Historical Data
Historical comparisons reveal long-term trends.
Therefore, organizations measure infrastructure improvements accurately.
How Railway Organizations Can Use This Dashboard
Railway authorities can use this dashboard in several operational areas.
Infrastructure Management
Managers monitor track condition and maintenance performance.
Maintenance Planning
Maintenance teams analyze infrastructure defects and repair schedules.
Safety Monitoring
Safety departments track accident and failure rates.
Strategic Planning
Leadership teams analyze long-term infrastructure performance trends.
Who Can Benefit from Railway Infrastructure KPI Dashboards?
Many stakeholders benefit from this dashboard.
Railway Authorities
They monitor national railway infrastructure performance.
Infrastructure Maintenance Teams
They track track inspections, repairs, and maintenance activities.
Railway Project Managers
They monitor project performance and infrastructure development.
Government Transport Departments
They evaluate railway infrastructure investment effectiveness.
Conclusion
Railway infrastructure management requires continuous monitoring and strategic planning. Without structured reporting systems, railway authorities struggle to analyze operational performance effectively.
The Railway Infrastructure KPI Dashboard in Excel provides a powerful solution. It helps organizations monitor KPIs, analyze trends, compare targets with actual performance, and track infrastructure efficiency.
Because the dashboard organizes data clearly, railway managers quickly identify operational gaps and improvement opportunities.
Therefore, railway authorities can improve infrastructure reliability, increase operational efficiency, and enhance transportation services using this dashboard.
In today’s data-driven world, railway organizations must adopt structured performance monitoring tools. The Railway Infrastructure KPI Dashboard in Excel provides a practical and powerful solution for achieving this goal.
Frequently Asked Questions (FAQs)
What is a Railway Infrastructure KPI Dashboard?
A Railway Infrastructure KPI Dashboard is a performance monitoring tool that tracks key infrastructure metrics such as track maintenance, safety performance, and operational efficiency.
Why do railway organizations use KPI dashboards?
Railway organizations use KPI dashboards to monitor performance, compare targets with actual results, and make data-driven infrastructure decisions.
Can Excel handle railway KPI dashboards effectively?
Yes. Excel supports data analysis, pivot charts, and interactive dashboards. Therefore, organizations can build powerful KPI dashboards using Excel.
What data is required to build a railway KPI dashboard?
Organizations need data such as:
-
Monthly KPI values
-
Target numbers
-
Previous year performance
-
KPI definitions and formulas
How often should railway KPIs be monitored?
Click to Purchases Railway Infrastructure KPI Dashboard in Excel
Railway organizations should monitor KPIs monthly. Regular monitoring ensures quick identification of operational issues.
Who uses railway KPI dashboards?
Railway authorities, infrastructure managers, maintenance teams, and government transportation departments use KPI dashboards to monitor infrastructure performance.
Visit our YouTube channel to learn step-by-step video tutorials