Urban areas continue to face serious parking challenges as the number of vehicles increases every year. Drivers often spend a significant amount of time searching for parking spaces. As a result, traffic congestion increases, fuel consumption rises, and frustration among drivers grows.
Therefore, city authorities and parking management companies must adopt smarter systems to monitor parking availability, revenue generation, and operational efficiency. However, many organizations still rely on manual reports and scattered spreadsheets to track parking performance. Because of this, managers struggle to evaluate parking utilization, revenue trends, and operational efficiency.
This is where a Smart Parking Systems KPI Dashboard in Excel becomes extremely valuable. A well-designed dashboard helps organizations track important parking performance indicators in one centralized location. Moreover, it provides visual insights that help decision-makers improve parking management and optimize revenue.
Click to Purchases Smart Parking Systems KPI Dashboard in Excel
In this article, you will learn everything about the Smart Parking Systems KPI Dashboard in Excel, including its features, advantages, best practices, and frequently asked questions.
What Is a Smart Parking Systems KPI Dashboard in Excel?
A Smart Parking Systems KPI Dashboard in Excel is a data-driven monitoring tool designed to track the performance of smart parking infrastructure. It collects and analyzes key performance indicators related to parking space usage, revenue generation, operational efficiency, and customer experience.
Because this dashboard consolidates all parking metrics in one place, managers can easily monitor system performance and identify areas that require improvement.
Furthermore, Excel dashboards allow users to visualize complex parking data through:
-
Interactive charts
-
KPI indicators
-
Trend analysis
-
Conditional formatting
-
Monthly performance tracking
Consequently, parking operators can make faster and better decisions.
Why Do Cities and Parking Operators Need Smart Parking KPIs?
Smart parking systems generate large amounts of operational data every day. Without proper monitoring tools, it becomes difficult to understand whether the parking infrastructure performs efficiently.
A KPI dashboard helps organizations:
-
Track parking utilization rates
-
Monitor revenue performance
-
Evaluate operational efficiency
-
Identify peak parking hours
-
Improve customer experience
-
Reduce parking congestion
-
Optimize parking resource allocation
Therefore, organizations that implement KPI dashboards gain better visibility into their parking operations.
Key Features of the Smart Parking Systems KPI Dashboard in Excel
This Smart Parking Systems KPI Dashboard in Excel is a ready-to-use template designed for monitoring parking system performance. The dashboard includes seven structured worksheets, each serving a specific purpose.
Let’s explore each component in detail.
1. Home Sheet – Navigation Control Center
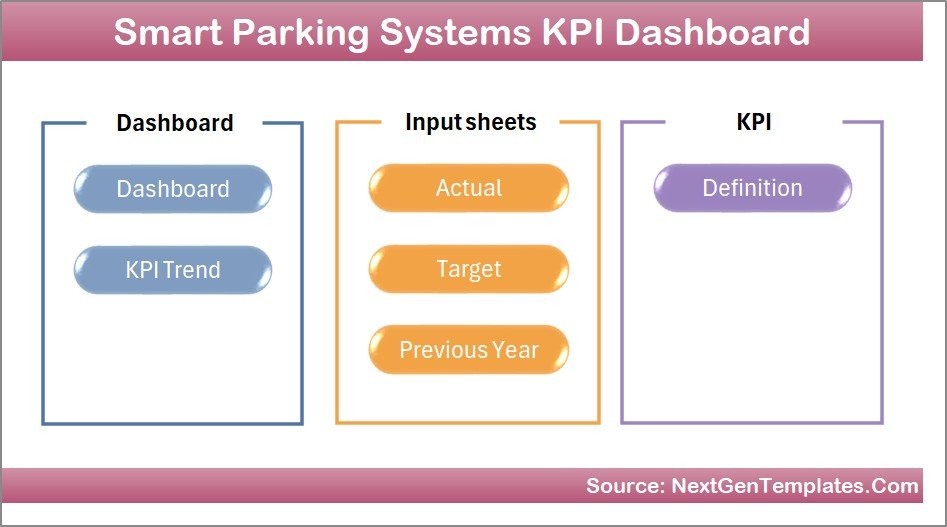
The Home sheet acts as the main navigation page of the dashboard.
Instead of searching through multiple sheets manually, users can easily navigate to different sections using the provided buttons.
Key elements of the Home sheet include:
-
Interactive navigation buttons
-
Direct access to dashboard sections
-
Simplified user experience
-
Clean and organized interface
Because of this structure, users can quickly access the information they need.
Click to Purchases Smart Parking Systems KPI Dashboard in Excel
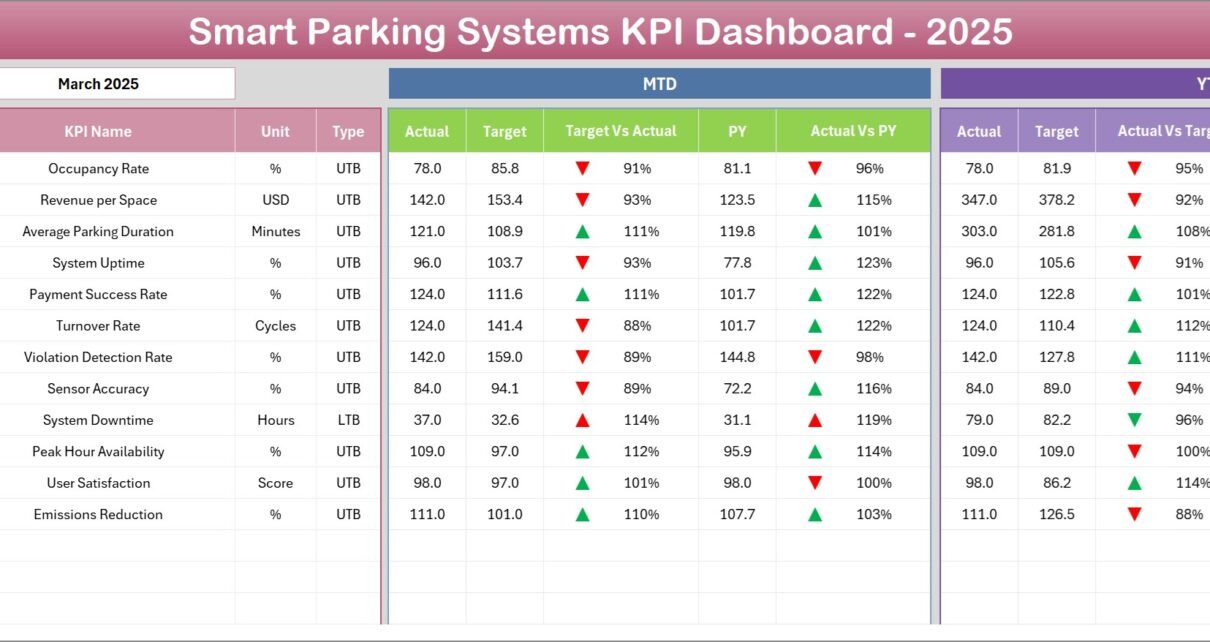
2. Dashboard Sheet – Central Performance Overview
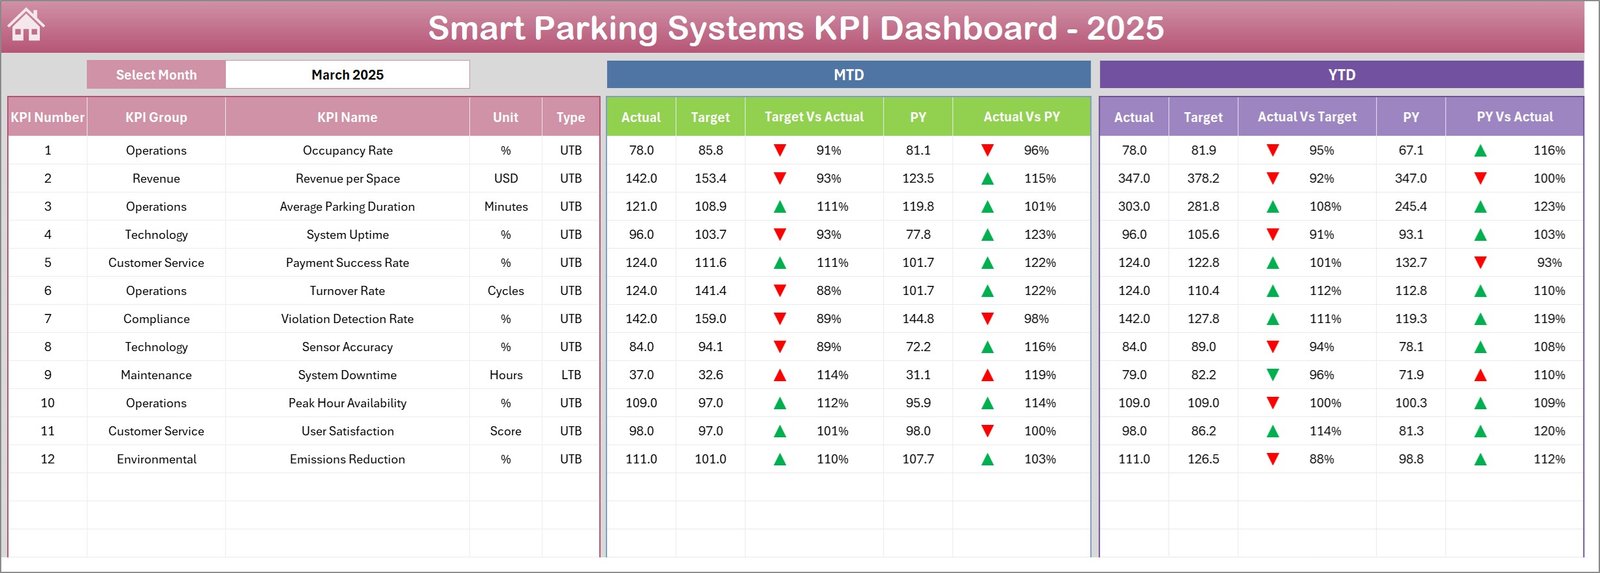
The Dashboard sheet serves as the main analytics page of the Smart Parking KPI Dashboard.
Here, users can monitor the performance of all KPIs in one centralized view.
At cell D3, users can select a Month from the drop-down menu. Once the month changes, the entire dashboard automatically updates the numbers.
This dynamic feature makes performance analysis easier.
Metrics Displayed on the Dashboard
The dashboard displays the following key performance metrics:
-
MTD (Month-To-Date) Actual
-
MTD Target
-
Previous Year Data
-
Target vs Actual Comparison
-
Previous Year vs Actual Comparison
Additionally, the dashboard includes conditional formatting arrows that indicate whether performance improves or declines.
Green arrows show improvement, while red arrows highlight performance issues.
YTD Analysis
The dashboard also includes Year-To-Date (YTD) analysis:
-
YTD Actual
-
YTD Target
-
Previous Year YTD
-
Target vs Actual YTD
-
Previous Year vs Actual YTD
Because of these insights, managers can track both short-term and long-term performance.
3. KPI Trend Sheet – Performance Tracking Over Time
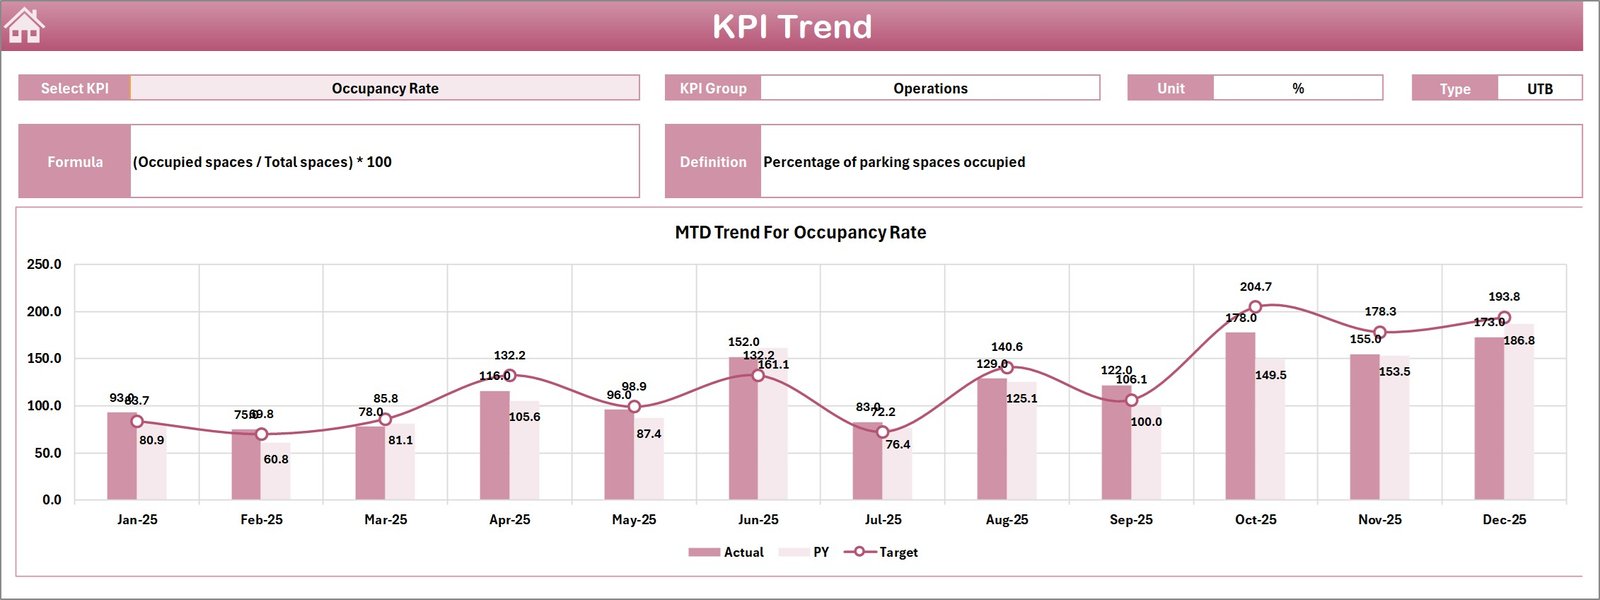
The KPI Trend sheet allows users to analyze how individual KPIs perform over time.
Users can select a KPI name from the dropdown in cell C3. Once selected, the dashboard displays detailed information about the selected KPI.
Information Displayed in KPI Trend Sheet
This section includes:
-
KPI Group
-
KPI Unit
-
KPI Type (Lower the Better or Upper the Better)
-
KPI Formula
-
KPI Definition
Furthermore, the sheet includes trend charts for both MTD and YTD values.
These charts compare:
-
Actual performance
-
Target performance
-
Previous year performance
As a result, decision-makers can quickly identify whether the KPI improves or declines.
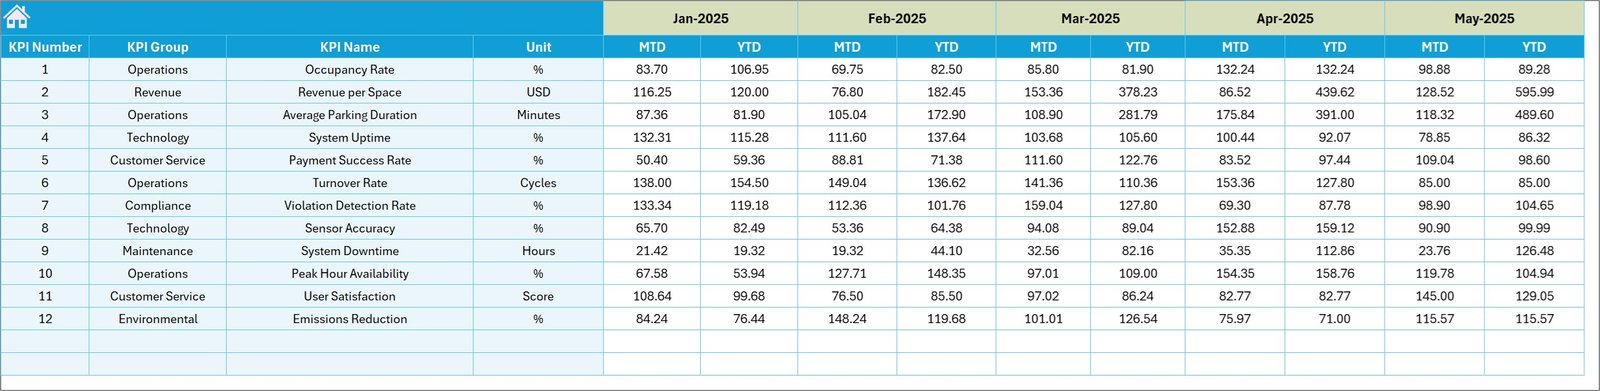
4. Actual Numbers Input Sheet – Data Entry Section
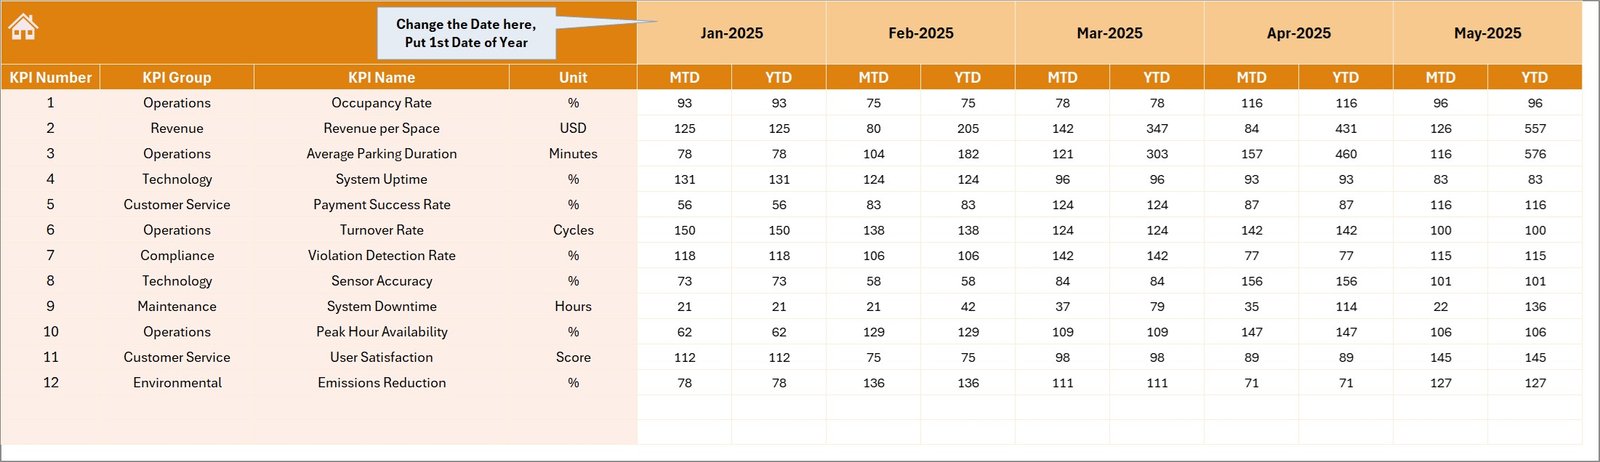
The Actual Numbers Input sheet allows users to enter the actual performance data for each KPI.
This sheet acts as the primary data source for the dashboard.
How Data Entry Works
Users simply enter:
-
Month
-
MTD values
-
YTD values
The starting month of the year can be set in cell E1.
Once users update the numbers, the dashboard automatically refreshes the calculations.
Because of this automation, data entry remains simple and efficient.
Click to Purchases Smart Parking Systems KPI Dashboard in Excel
5. Target Sheet – KPI Performance Goals
The Target sheet stores the target values for each KPI.
Users must enter the expected performance targets for each month.
The sheet includes:
-
MTD Targets
-
YTD Targets
Once targets are entered, the dashboard automatically compares them with actual results.
Therefore, managers can easily evaluate whether the parking system meets performance expectations.
6. Previous Year Numbers Sheet – Historical Comparison
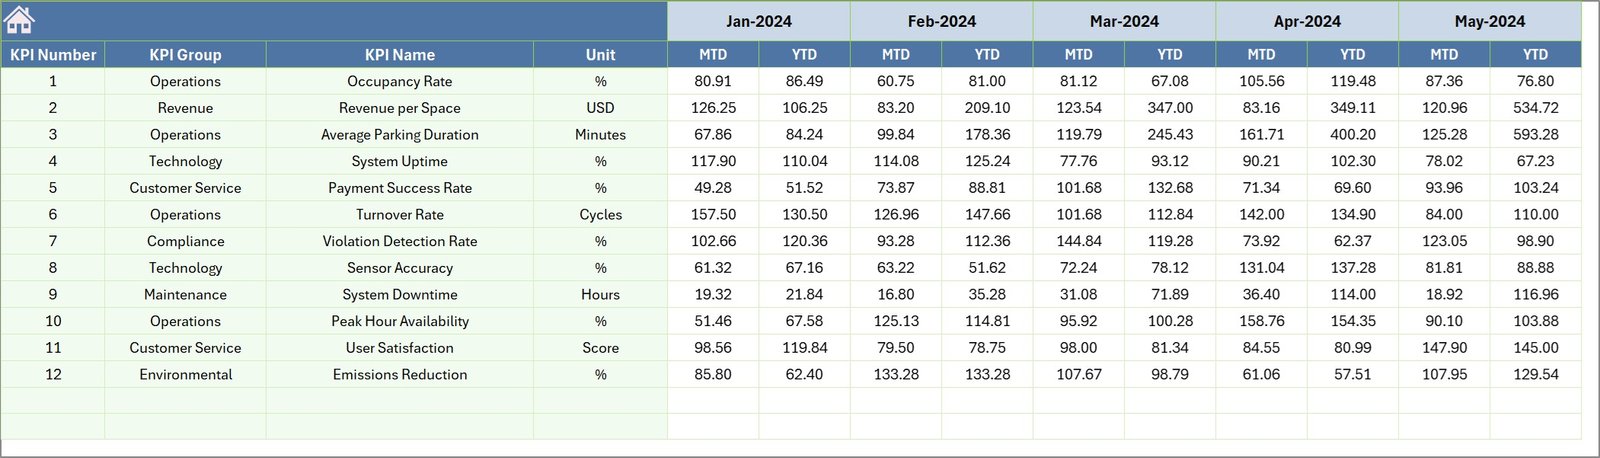
The Previous Year Numbers sheet contains performance data from the previous year.
Users enter historical values similar to the current year structure.
This sheet enables year-over-year performance analysis, which helps organizations understand long-term trends.
For example, managers can analyze:
-
Parking utilization growth
-
Revenue improvement
-
Operational efficiency changes
Therefore, historical comparison improves strategic planning.
7. KPI Definition Sheet – KPI Documentation
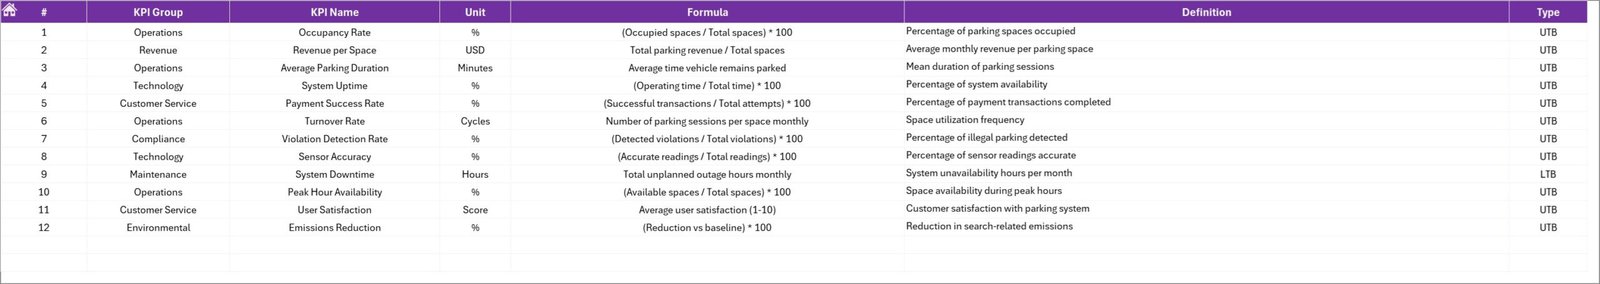
The KPI Definition sheet acts as the reference section of the dashboard.
This sheet stores important KPI details such as:
-
KPI Name
-
KPI Group
-
Unit of Measurement
-
KPI Formula
-
KPI Definition
Because every KPI includes proper documentation, users clearly understand what each KPI represents.
As a result, the dashboard maintains transparency and consistency.
What KPIs Can Be Tracked in a Smart Parking Dashboard?
A Smart Parking KPI Dashboard can track several operational metrics.
Common smart parking KPIs include:
-
Parking occupancy rate
-
Average parking duration
-
Parking revenue per space
-
Vehicle turnover rate
-
Parking violation rate
-
Customer satisfaction score
-
Sensor uptime percentage
-
Payment success rate
-
Parking slot availability
-
Peak hour utilization
Monitoring these KPIs helps parking operators improve system performance.
Advantages of Smart Parking Systems KPI Dashboard in Excel
Organizations gain several advantages when they use a structured KPI dashboard.
1. Centralized Data Monitoring
The dashboard consolidates all parking metrics in one place. Therefore, managers can analyze performance without switching between multiple reports.
2. Real-Time Performance Tracking
Users can quickly update data and monitor performance instantly.
Consequently, decision-makers can respond to operational issues faster.
3. Better Resource Management
Parking operators can analyze space utilization and optimize parking allocation.
As a result, parking infrastructure becomes more efficient.
4. Improved Revenue Monitoring
The dashboard helps track revenue trends and identify high-performing parking locations.
Therefore, organizations can increase profitability.
5. Data-Driven Decision Making
Because the dashboard provides visual insights, managers can make strategic decisions based on actual data rather than assumptions.
Best Practices for the Smart Parking Systems KPI Dashboard
Organizations should follow several best practices to maximize the effectiveness of their dashboard.
Define Clear KPIs
First, define measurable KPIs that align with parking management goals.
Maintain Accurate Data Entry
Ensure accurate data entry to avoid incorrect analysis.
Use Consistent KPI Definitions
Clearly document KPI formulas and definitions to maintain consistency.
Update Data Regularly
Update the dashboard frequently to monitor the latest performance.
Analyze Trends Regularly
Review monthly and yearly trends to identify improvement opportunities.
Train Staff on Dashboard Usage
Ensure that staff members understand how to update and interpret the dashboard.
How Does Smart Parking Technology Improve Urban Mobility?
Smart parking systems help cities reduce traffic congestion and improve transportation efficiency.
Drivers often spend 15–20 minutes searching for parking spaces. However, smart parking technology guides drivers to available spots quickly.
As a result:
-
Traffic congestion decreases
-
Fuel consumption reduces
-
Urban mobility improves
-
Driver frustration decreases
Therefore, smart parking solutions support smarter city infrastructure.
Conclusion
Click to Purchases Smart Parking Systems KPI Dashboard in Excel
Smart parking infrastructure continues to play an essential role in modern urban development. As cities grow, parking demand increases rapidly. Therefore, city authorities must monitor parking performance efficiently.
The Smart Parking Systems KPI Dashboard in Excel provides a powerful solution for tracking parking metrics, evaluating performance, and making informed decisions.
Because the dashboard integrates KPI monitoring, trend analysis, and performance comparison, organizations can gain deeper insights into parking operations.
Furthermore, the structured design with seven worksheets makes the dashboard easy to use and maintain.
Ultimately, organizations that implement smart parking dashboards can improve operational efficiency, increase revenue, and deliver better parking experiences to drivers.
Frequently Asked Questions (FAQs)
What is a Smart Parking KPI Dashboard?
A Smart Parking KPI Dashboard is a monitoring tool that tracks key performance indicators related to parking space utilization, revenue generation, and operational efficiency.
Why should parking operators use KPI dashboards?
KPI dashboards help parking operators analyze performance trends, monitor revenue, and improve parking system efficiency.
Can Excel handle smart parking analytics?
Yes. Excel dashboards can easily handle parking performance analytics using charts, pivot tables, and formulas.
What are the most important smart parking KPIs?
Some important KPIs include:
-
Parking occupancy rate
-
Parking revenue per space
-
Average parking duration
-
Vehicle turnover rate
-
Sensor uptime
Who can use the Smart Parking KPI Dashboard?
Several professionals can use this dashboard, including:
-
City transportation authorities
-
Parking management companies
-
Smart city planners
-
Infrastructure managers
-
Urban mobility consultants
Visit our YouTube channel to learn step-by-step video tutorials