Agriculture and biotechnology are transforming the way the world produces food. Modern agricultural companies constantly invest in biotechnology research to develop high-yield crops, improve resistance to pests, and enhance food security. However, managing large volumes of research data, trial results, regulatory approvals, and financial performance can become extremely challenging.
Many Agri-Biotech companies still rely on traditional spreadsheets and manual reports to monitor research and development performance. As a result, decision-makers struggle to track important indicators such as research costs, yield improvements, regulatory approvals, and profitability across different crops and regions.
Therefore, organizations require a centralized analytics system that allows them to monitor all biotechnology performance metrics in one place. This is exactly where the Agri-Biotech Dashboard in Power BI becomes extremely valuable.
The Agri-Biotech Dashboard in Power BI is a powerful business intelligence solution designed to help agricultural biotechnology companies monitor research investments, evaluate crop performance, track regulatory approvals, and analyze profitability trends. Because Power BI provides interactive visualizations and real-time insights, managers can easily understand complex data and make informed strategic decisions.
In this detailed guide, you will learn everything about the Agri-Biotech Dashboard in Power BI, including its features, analysis capabilities, advantages, and best practices for implementation.
Click to buy Agri-Biotech Dashboard in Power BI
What Is an Agri-Biotech Dashboard in Power BI?
An Agri-Biotech Dashboard in Power BI is an interactive data visualization tool designed to monitor the performance of biotechnology activities related to agriculture.
This dashboard consolidates multiple datasets such as:
- Crop research data
- Biotechnology trait performance
- Trial phase results
- Vendor contributions
- Regulatory approvals
- Financial metrics such as revenue and profit
Because Power BI allows dynamic filtering and interactive visuals, users can quickly explore the data and identify trends.
For example, decision-makers can easily answer important questions such as:
- Which crops generate the highest profit margins?
- Which biotechnology traits produce the highest yield improvements?
- Which vendors contribute the most successful trials?
- Which regions produce the highest biotechnology profits?
- How do research costs impact revenue growth?
Therefore, instead of analyzing scattered spreadsheets, organizations can monitor the entire Agri-Biotech ecosystem using one centralized dashboard.
Why Do Agricultural Biotechnology Companies Need a Dashboard?
Biotechnology research in agriculture involves multiple stages such as research, trial phases, regulatory approval, and commercialization. Because each stage generates large volumes of data, tracking performance becomes complicated.
Without a structured monitoring system, companies face several challenges.
Common Challenges
- Difficulty tracking R&D investment performance
- Limited visibility into crop research outcomes
- Slow identification of regulatory approval trends
- Poor monitoring of vendor contributions
- Delayed decision-making due to fragmented reports
However, an Agri-Biotech Dashboard in Power BI solves these problems by providing real-time performance insights.
As a result, companies can improve research efficiency, increase profitability, and accelerate innovation.
Key Features of the Agri-Biotech Dashboard in Power BI
The Agri-Biotech Dashboard in Power BI contains five powerful analytical pages. Each page focuses on a specific aspect of biotechnology performance.
Because the dashboard uses Power BI visualizations, users can filter data using slicers and analyze results dynamically.
The five pages included in the dashboard are:
- Overview Page
- Crop Analysis
- Trial Phase Analysis
- Vendor Analysis
- Month Analysis
Let us explore each page in detail.
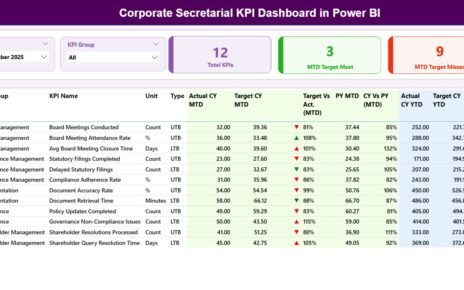
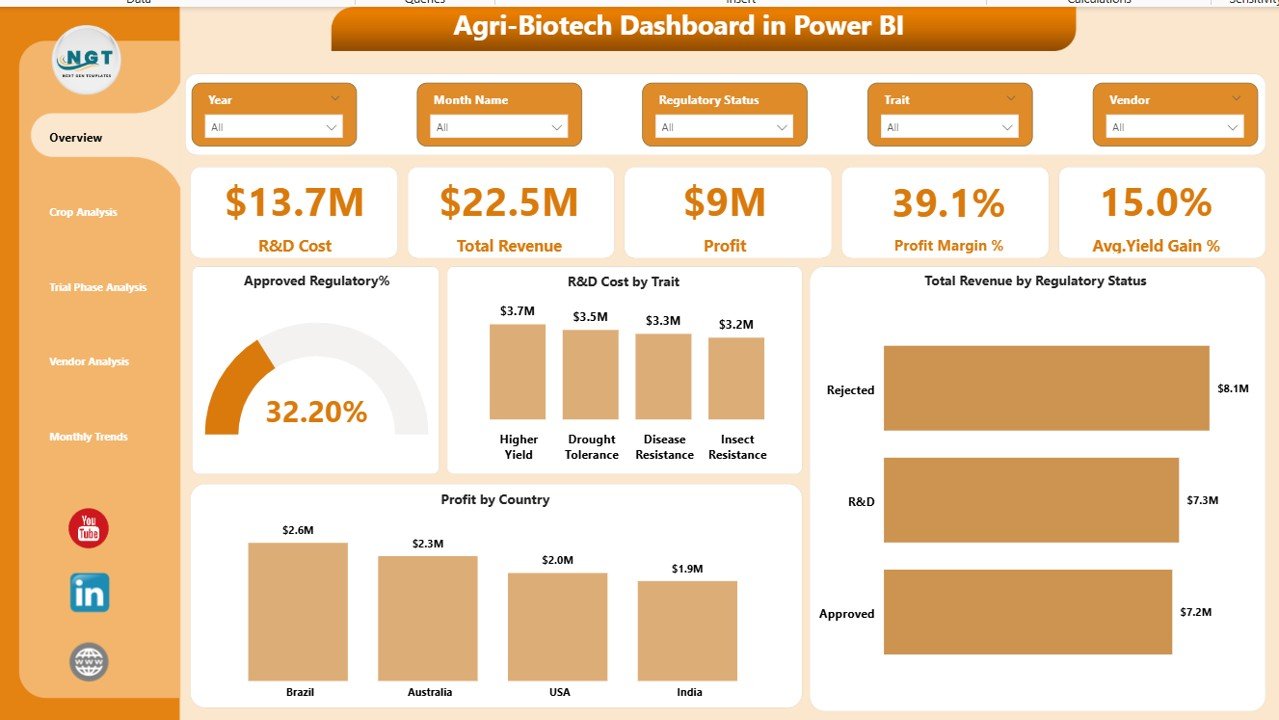
Overview Page – Complete Snapshot of Agri-Biotech Performance
The Overview Page acts as the main summary page of the dashboard. It provides a high-level view of biotechnology research performance and financial outcomes.
Users can apply slicers to filter data based on specific conditions and analyze the results quickly.
KPI Cards Displayed
The page displays five important KPI cards:
- R&D Cost – Total investment in biotechnology research and development
- Total Revenue – Overall revenue generated from biotech crops
- Profit – Net profit after research and operational expenses
- Profit Margin % – Profitability percentage of biotechnology products
- Average Yield Gain % – Average crop yield improvement achieved through biotechnology
These KPI cards allow decision-makers to quickly understand overall performance.
Charts Included
The Overview Page also includes four analytical charts:
- Approved Regulatory % – Percentage of biotechnology traits approved by regulators
- R&D Cost by Trait – Research investment distributed across different traits
- Total Revenue by Regulatory Status – Revenue comparison based on approval status
- Profit by Country – Geographic profitability analysis
Because this page summarizes key metrics, executives can quickly assess the overall biotechnology business performance.
Click to buy Agri-Biotech Dashboard in Power BI
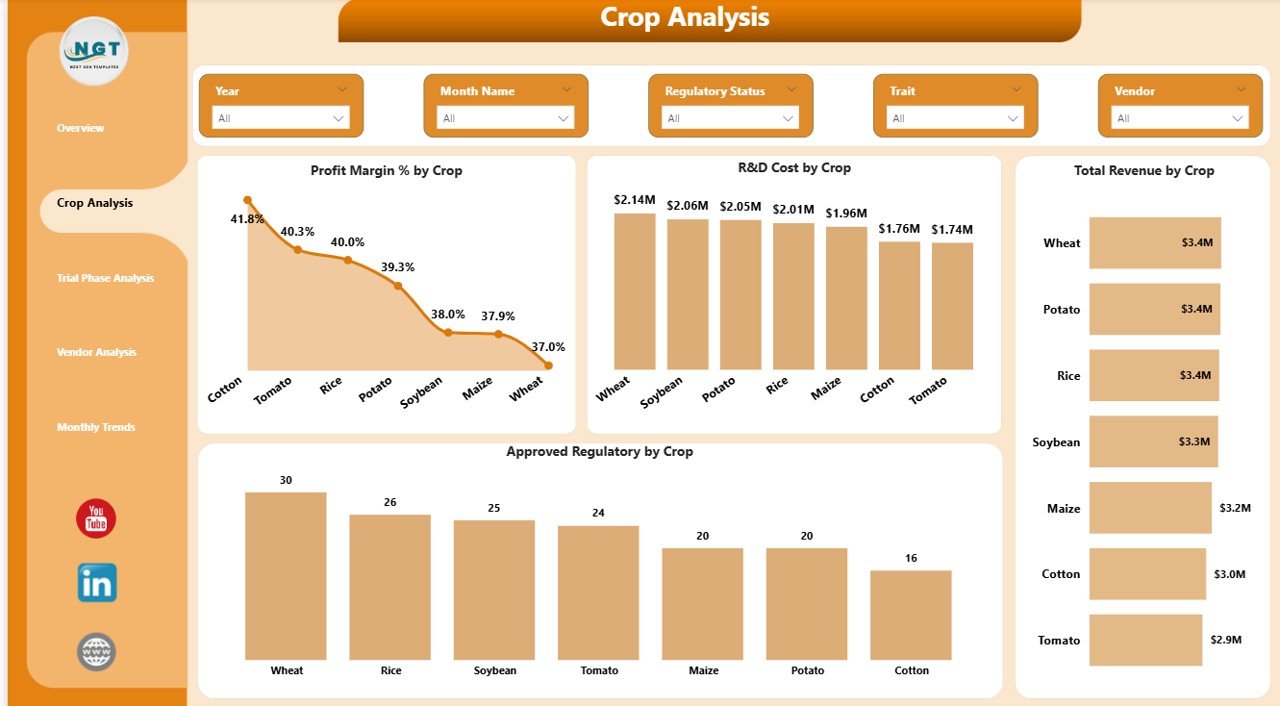
Crop Analysis – Which Crops Deliver the Best Results?
Different crops respond differently to biotechnology innovations. Some crops generate higher profits while others produce stronger yield improvements.
Therefore, the Crop Analysis Page focuses on analyzing biotechnology performance across different crops.
Charts Included
This page includes four powerful charts:
- Profit Margin % by Crop
- R&D Cost by Crop
- Total Revenue by Crop
- Approved Regulatory % by Crop
Insights Users Can Discover
Using these charts, users can easily identify:
- Which crops generate the highest profits
- Which crops require the highest research investment
- Which crops have the highest regulatory approval rates
- Which crops produce the most revenue
As a result, agricultural companies can prioritize research investments in high-performing crops.
Click to buy Agri-Biotech Dashboard in Power BI
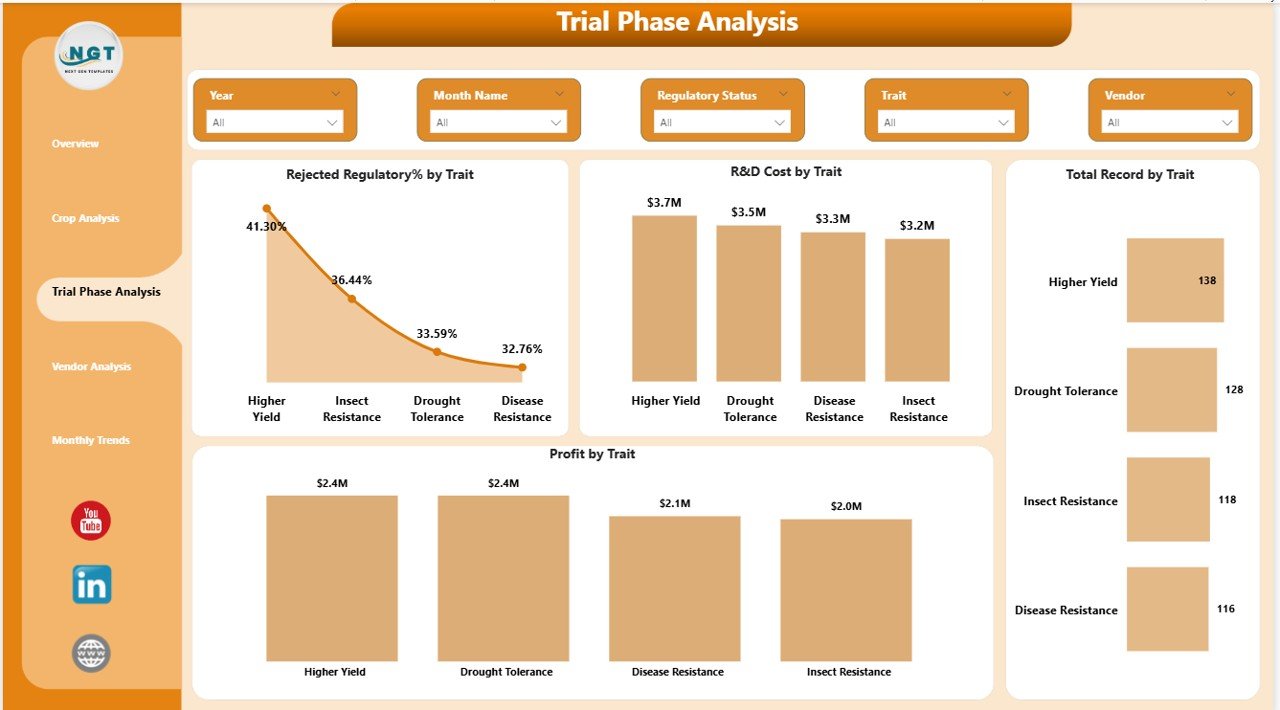
Trial Phase Analysis – Monitoring Biotechnology Experiments
Before biotechnology traits reach commercial markets, companies conduct multiple research trials. These trials evaluate the effectiveness of genetic traits and measure performance outcomes.
The Trial Phase Analysis Page helps organizations monitor trial performance.
Charts Included
This page includes the following four charts:
- Rejected Regulatory % by Trait
- R&D Cost by Trait
- Total Records by Trait
- Profit by Trait
Insights from Trial Phase Analysis
This page allows users to evaluate:
- Which traits face the highest rejection rates
- Which traits require the largest research investment
- Which traits generate the highest profit potential
- Which traits produce the most experimental data records
Therefore, companies can optimize research strategies and focus on the most promising biotechnology traits.
Click to buy Agri-Biotech Dashboard in Power BI
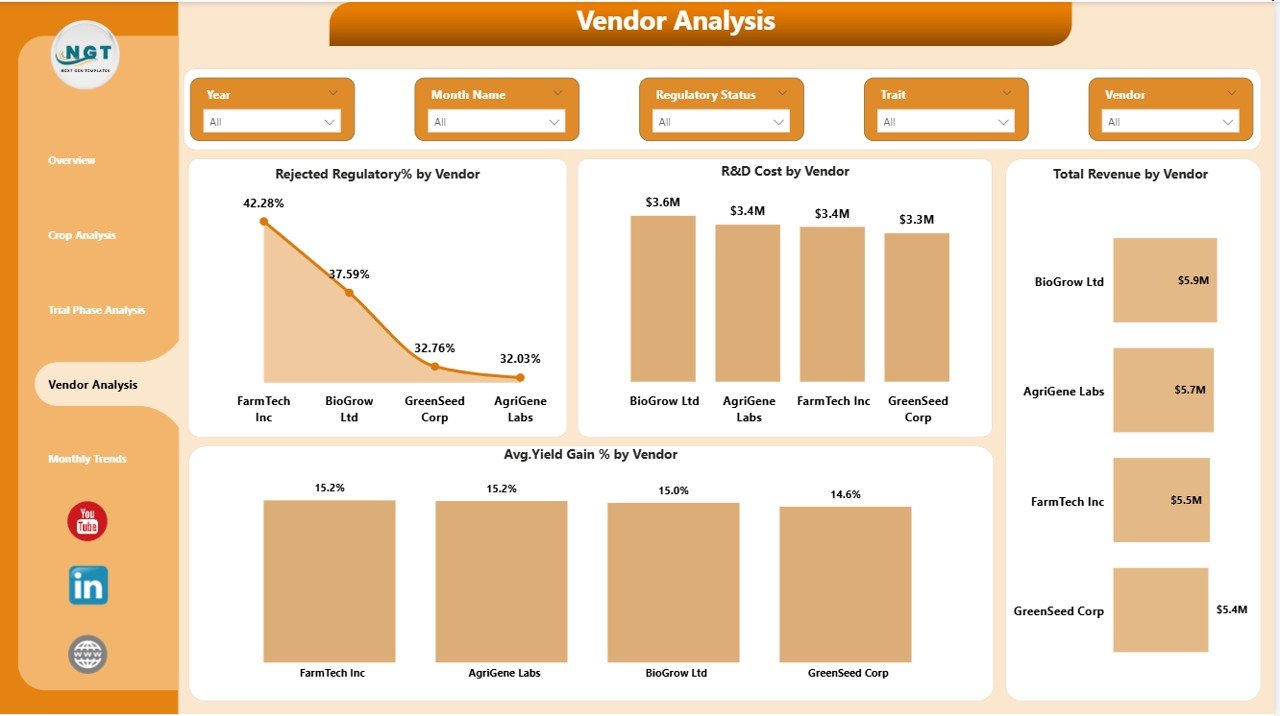
Vendor Analysis – Evaluating Vendor Contributions
Biotechnology research often involves multiple external partners and vendors. These vendors provide research services, laboratory testing, and field trial support.
However, not all vendors deliver equal performance.
Therefore, the Vendor Analysis Page evaluates vendor contributions to biotechnology success.
Charts Included
This page includes four charts:
- Rejected Regulatory % by Vendor
- R&D Cost by Vendor
- Total Revenue by Vendor
- Average Yield Gain % by Vendor
Insights from Vendor Analysis
Using this page, organizations can determine:
- Which vendors produce the most successful trials
- Which vendors require the highest research investment
- Which vendors contribute the most revenue
- Which vendors help improve crop yield the most
Consequently, organizations can select high-performing vendors and strengthen strategic partnerships.
Click to buy Agri-Biotech Dashboard in Power BI
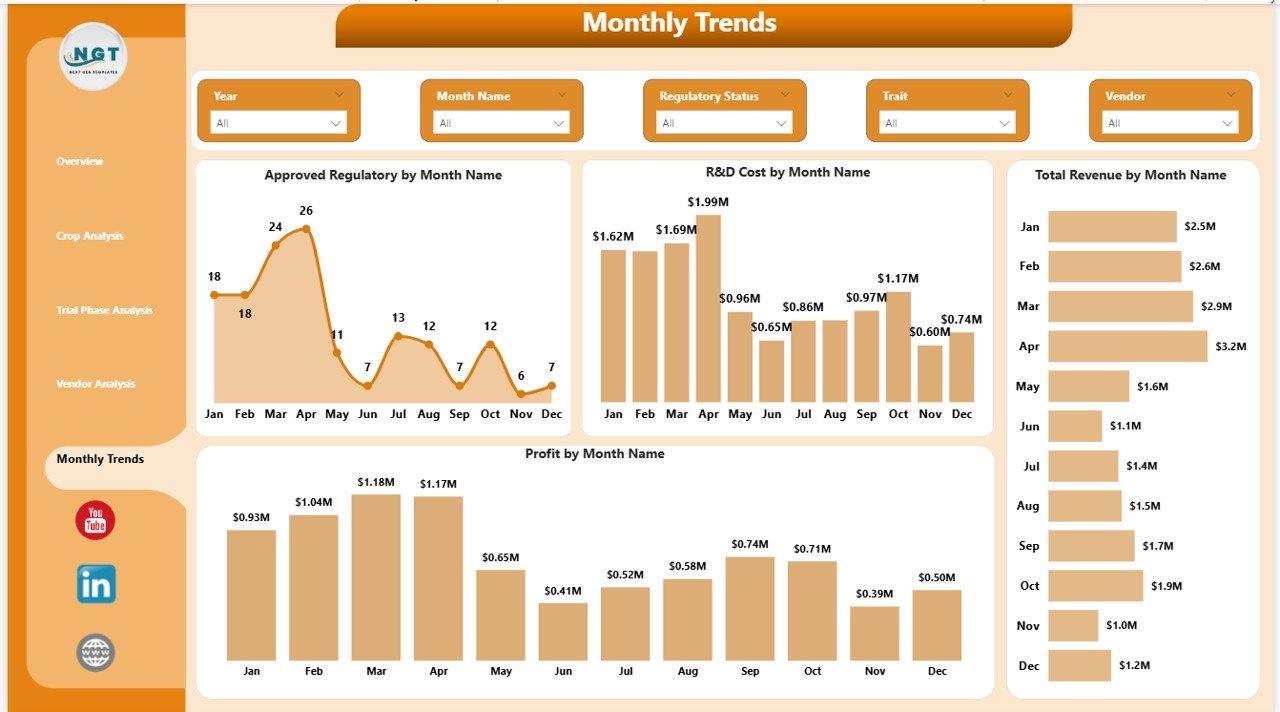
Month Analysis – Monitoring Monthly Biotechnology Performance
Agricultural biotechnology performance changes over time due to seasonal crop cycles and research timelines.
Therefore, tracking monthly performance becomes extremely important.
The Month Analysis Page focuses on time-based analysis.
Charts Included
This page contains four charts:
- Approved Regulatory % by Month Name
- R&D Cost by Month Name
- Total Revenue by Month Name
- Profit by Month Name
Insights from Monthly Analysis
This page helps users understand:
- Seasonal patterns in biotechnology approvals
- Monthly research investment trends
- Revenue fluctuations throughout the year
- Profit performance over time
As a result, organizations can plan research investments and commercialization strategies more effectively.
Click to buy Agri-Biotech Dashboard in Power BI
Advantages of the Agri-Biotech Dashboard in Power BI
Implementing the Agri-Biotech Dashboard in Power BI provides numerous benefits for agricultural biotechnology companies.
- Centralized Data Management
The dashboard consolidates research, regulatory, financial, and operational data in one platform.
Therefore, managers no longer need to analyze multiple spreadsheets.
- Real-Time Performance Monitoring
Power BI updates data dynamically.
As a result, decision-makers can monitor performance metrics instantly.
- Better Research Investment Decisions
The dashboard clearly shows which crops and traits deliver the highest returns.
Consequently, organizations can allocate research budgets more effectively.
- Improved Regulatory Tracking
Biotechnology products must pass regulatory approval processes.
The dashboard tracks approval and rejection trends.
Therefore, companies can improve regulatory strategies.
- Vendor Performance Evaluation
Vendor analysis helps organizations identify the best research partners.
Thus, companies can strengthen partnerships with high-performing vendors.
- Enhanced Strategic Planning
Because the dashboard provides historical trends and predictive insights, leadership teams can make better strategic decisions.
Opportunities for Improvement in Agri-Biotech Analytics
Although dashboards provide powerful insights, organizations can still improve their analytics systems.
Integrate More Data Sources
Companies should integrate additional datasets such as:
- Weather data
- Soil conditions
- Market demand trends
- Supply chain data
Implement Predictive Analytics
Predictive models can forecast:
- Crop yield improvements
- Future research outcomes
- Regulatory approval probabilities
Use AI-Based Insights
Artificial intelligence can detect hidden patterns in biotechnology experiments.
Therefore, companies can accelerate research innovation.
Best Practices for the Agri-Biotech Dashboard
Organizations should follow several best practices to maximize the value of the Agri-Biotech Dashboard in Power BI.
Maintain Accurate Data Sources
Accurate data is essential for reliable insights.
Therefore, companies should ensure that all research and financial data remains up to date.
Use Clear KPI Definitions
Organizations should define each KPI clearly.
This ensures that all stakeholders interpret performance metrics consistently.
Implement Data Security
Biotechnology research data is highly sensitive.
Therefore, companies must apply proper data security and access control policies.
Regularly Update the Dashboard
Data updates should occur regularly.
As a result, decision-makers can rely on current information.
Train Users
Employees should understand how to use the dashboard effectively.
Training improves data adoption and decision-making.
How Can Organizations Implement the Agri-Biotech Dashboard?
Implementing a Power BI dashboard involves several important steps.
Step 1 – Collect Data
Organizations should gather data from:
- Research laboratories
- Crop trials
- Financial systems
- Regulatory databases
Step 2 – Clean the Data
Data must be cleaned and structured properly.
This step removes duplicates and incorrect values.
Step 3 – Build the Data Model
Power BI requires relationships between datasets.
Therefore, organizations must design proper data models.
Step 4 – Create Visualizations
After building the model, analysts create charts and KPI cards.
These visuals display insights clearly.
Step 5 – Deploy and Monitor
Finally, organizations deploy the dashboard and monitor performance continuously.
Conclusion
The Agri-Biotech Dashboard in Power BI provides a powerful solution for monitoring biotechnology research and agricultural performance.
Because agricultural biotechnology generates complex datasets, companies must use advanced analytics tools to transform raw data into meaningful insights.
This dashboard helps organizations monitor research investments, analyze crop performance, track regulatory approvals, evaluate vendor contributions, and identify profitability trends.
Moreover, interactive visualizations allow decision-makers to explore data dynamically and make informed strategic decisions.
Therefore, companies that implement the Agri-Biotech Dashboard in Power BI can improve research efficiency, increase profitability, and accelerate agricultural innovation.
Frequently Asked Questions (FAQs)
What is an Agri-Biotech Dashboard in Power BI?
An Agri-Biotech Dashboard in Power BI is a business intelligence tool that visualizes biotechnology research data, crop performance, financial metrics, and regulatory approvals in an interactive dashboard.
Why is Power BI useful for agricultural biotechnology analytics?
Power BI provides interactive charts, real-time data updates, and advanced analytics capabilities. Therefore, agricultural companies can easily monitor research performance and financial results.
What KPIs are included in the Agri-Biotech Dashboard?
Common KPIs include:
- R&D Cost
- Total Revenue
- Profit
- Profit Margin %
- Average Yield Gain %
These indicators help organizations evaluate biotechnology performance.
Who can use the Agri-Biotech Dashboard?
This dashboard is useful for:
- Agricultural biotechnology companies
- Research organizations
- Agribusiness analysts
- Data scientists
- Government agriculture departments
Can this dashboard integrate with Excel data?
Yes. Power BI can easily connect to Excel files. Therefore, organizations can import research and financial data from Excel spreadsheets into the dashboard.
Visit our YouTube channel to learn step-by-step video tutorials
Watch the step-by-step video tutorial:
Click to buy Agri-Biotech Dashboard in Power BI