Electricity projects require huge investments, complex planning, and strong coordination among engineers, contractors, project managers, and stakeholders. Power generation plants, transmission projects, renewable installations, and infrastructure upgrades often involve multiple phases and strict deadlines. Therefore, companies must track project cost, revenue expectations, completion progress, and contractor performance continuously.
However, many organizations still rely on scattered spreadsheets and manual reports. As a result, managers often struggle to see the complete picture of their electricity projects. They cannot quickly identify delays, monitor financial performance, or evaluate contractor efficiency.
This is where the Electricity Project Dashboard in Power BI becomes extremely valuable.
The Electricity Project Dashboard in Power BI provides an interactive and visual platform that transforms complex electricity project data into clear insights. Moreover, it helps project managers monitor project cost, expected revenue, completion ratios, delays, and profitability in real time.
Furthermore, Power BI allows organizations to analyze large volumes of electricity project data using dynamic charts, filters, and slicers. Consequently, decision-makers can easily identify risks, improve project efficiency, and maximize profitability.
In this comprehensive guide, we will explore everything about the Electricity Project Dashboard in Power BI, including its features, advantages, best practices, and frequently asked questions.
Click to Purchases Electricity Project Dashboard in Power BI
What is an Electricity Project Dashboard in Power BI?
An Electricity Project Dashboard in Power BI is an interactive business intelligence tool designed to monitor and analyze electricity infrastructure projects.
It collects project-related data such as:
-
Project cost
-
Expected revenue
-
Expected profit
-
Project status
-
Contractor performance
-
Regional performance
-
Monthly trends
-
Completion ratios
-
Project delays
Afterward, Power BI converts this raw data into interactive visualizations such as charts, KPI cards, and trend graphs.
Therefore, managers can quickly understand the health of their electricity projects and take corrective actions when necessary.
Moreover, this dashboard supports data-driven decision-making because it provides real-time insights into project progress, cost efficiency, and revenue expectations.
Why Do Electricity Companies Need Project Dashboards?
Electricity infrastructure projects involve high risk and complex coordination. Therefore, project managers must monitor multiple performance indicators at the same time.
Without a proper dashboard, organizations may face several problems:
-
Difficulty tracking project progress
-
Limited visibility into project costs
-
Inability to detect delays early
-
Poor contractor performance monitoring
-
Lack of profitability analysis
However, an Electricity Project Dashboard solves these challenges.
For example, the dashboard instantly shows delayed projects, contractor performance, and regional project status. As a result, decision-makers can act faster and improve project outcomes.
Click to Purchases Electricity Project Dashboard in Power BI
Key Features of the Electricity Project Dashboard in Power BI
The Electricity Project Dashboard contains five interactive pages within the Power BI Desktop application. Each page focuses on a specific area of project performance analysis.
Let us explore each page in detail.
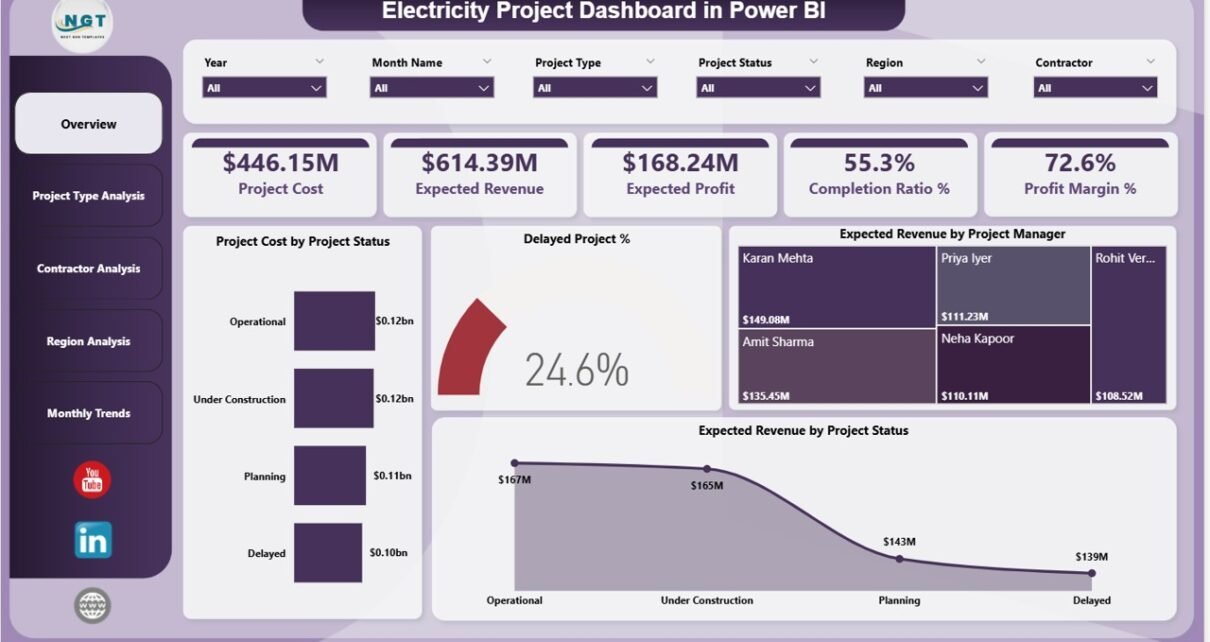
1. Overview Page
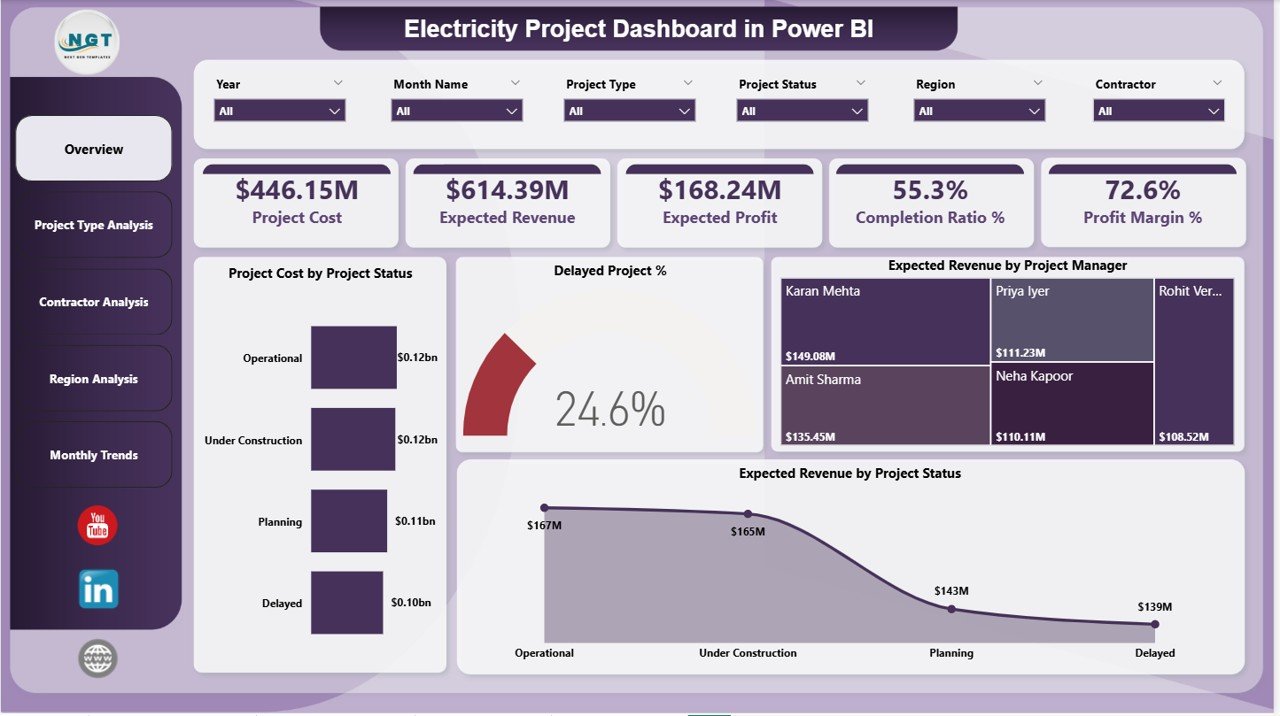
The Overview Page acts as the main control panel of the dashboard. It provides a quick summary of electricity project performance.
Additionally, this page includes slicers that allow users to filter data by various parameters.
KPI Cards
The overview section displays five important KPI cards:
-
Project Cost – Shows the total investment in electricity projects.
-
Expected Revenue – Displays projected income from electricity projects.
-
Expected Profit – Calculates the difference between revenue and project cost.
-
Completion Ratio % – Shows the percentage of completed project work.
-
Profit Margin % – Displays the profitability ratio of electricity projects.
Charts Available on the Overview Page
This page includes four important charts:
-
Project Cost by Project Status
Helps managers analyze cost allocation across project statuses such as completed, ongoing, or delayed. -
Delayed Project %
Shows the percentage of projects facing delays. -
Expected Revenue by Project Manager
Allows companies to evaluate project manager performance. -
Expected Revenue by Project Status
Shows revenue distribution based on project progress.
Therefore, the Overview Page provides a complete snapshot of electricity project performance.
Click to Purchases Electricity Project Dashboard in Power BI
2. Project Type Analysis
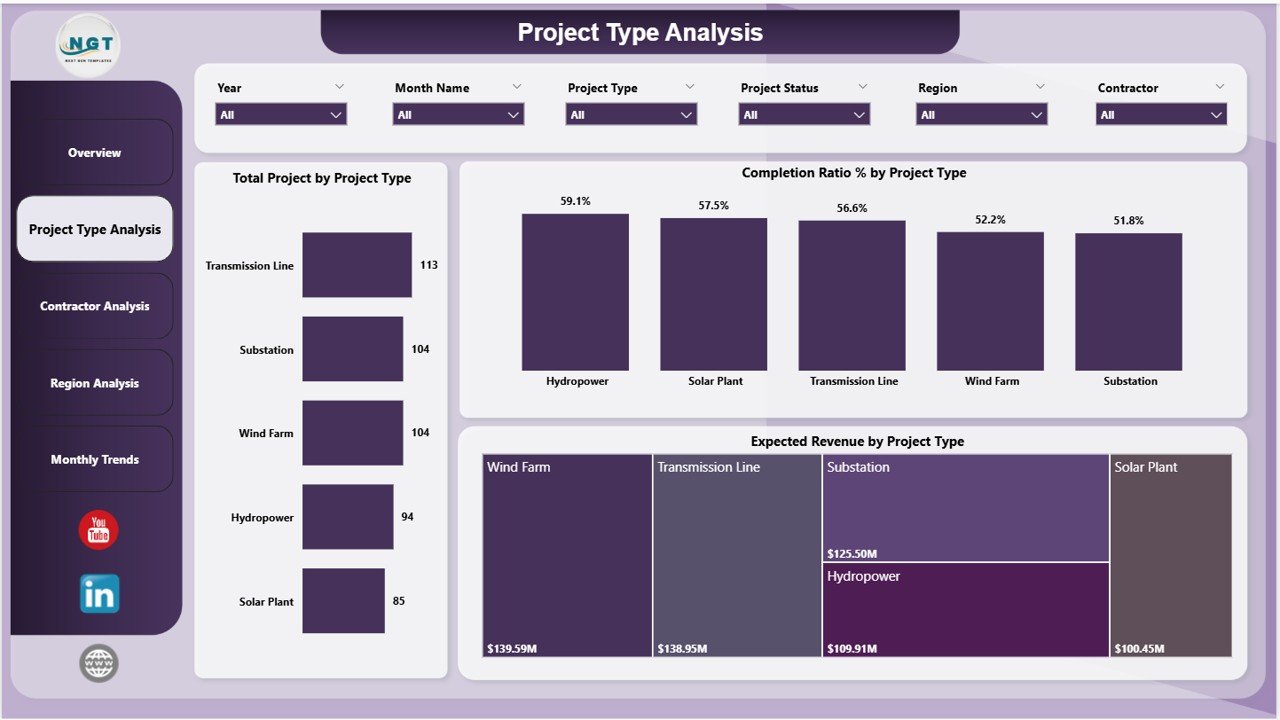
The Project Type Analysis Page focuses on evaluating different categories of electricity projects.
Electricity companies often run multiple types of projects such as:
-
Power generation projects
-
Transmission line projects
-
Substation installations
-
Renewable energy projects
-
Infrastructure upgrades
Therefore, managers must understand which project type performs better.
Charts in the Project Type Analysis Page
This page includes three charts:
-
Total Projects by Project Type
Displays the distribution of electricity projects across categories. -
Completion Ratio % by Project Type
Shows which project types progress faster. -
Expected Revenue by Project Type
Helps identify the most profitable project categories.
As a result, organizations can focus more on high-performing project types.
Click to Purchases Electricity Project Dashboard in Power BI
3. Contractor Analysis
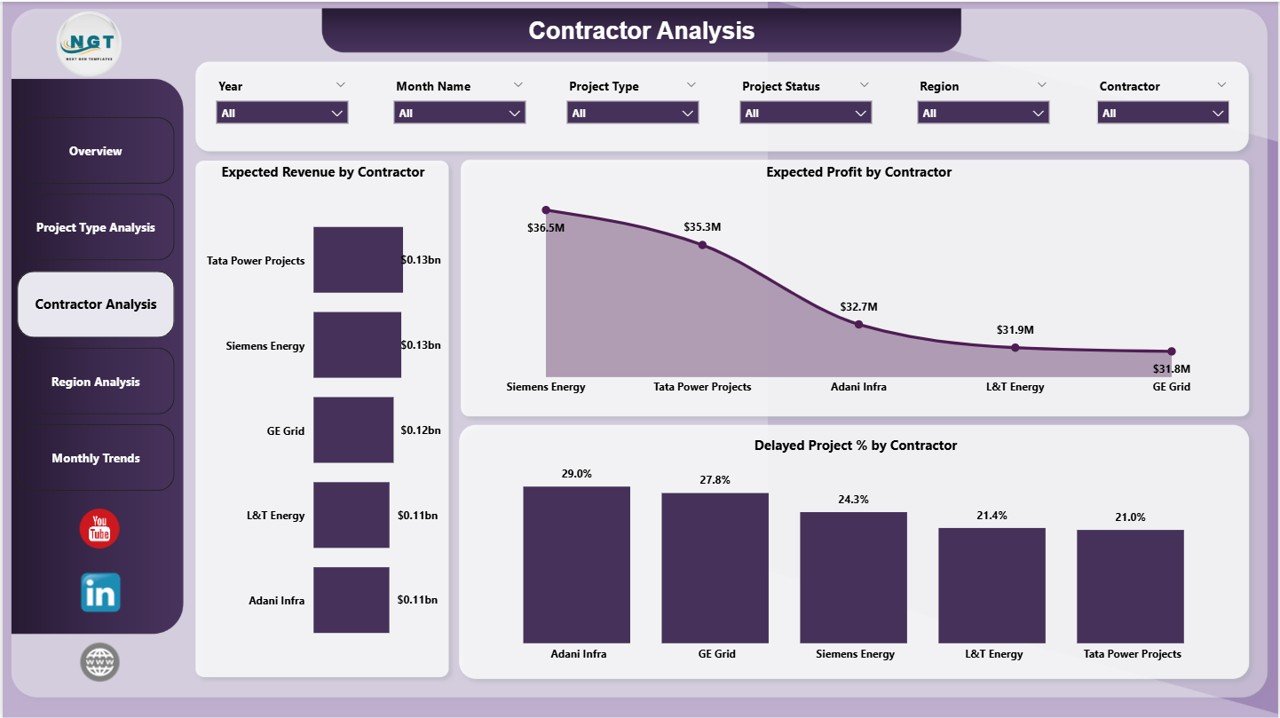
Electricity projects usually involve multiple contractors responsible for construction, engineering, and equipment installation.
Therefore, evaluating contractor performance becomes essential.
The Contractor Analysis Page helps organizations measure contractor efficiency and reliability.
Charts Available on the Contractor Analysis Page
This page includes three performance charts:
-
Expected Revenue by Contractor
Shows which contractors contribute the most value to electricity projects. -
Expected Profit by Contractor
Helps identify contractors associated with the most profitable projects. -
Delayed Project % by Contractor
Reveals which contractors frequently cause project delays.
Consequently, managers can choose the best contractors for future electricity projects.
4. Region Analysis
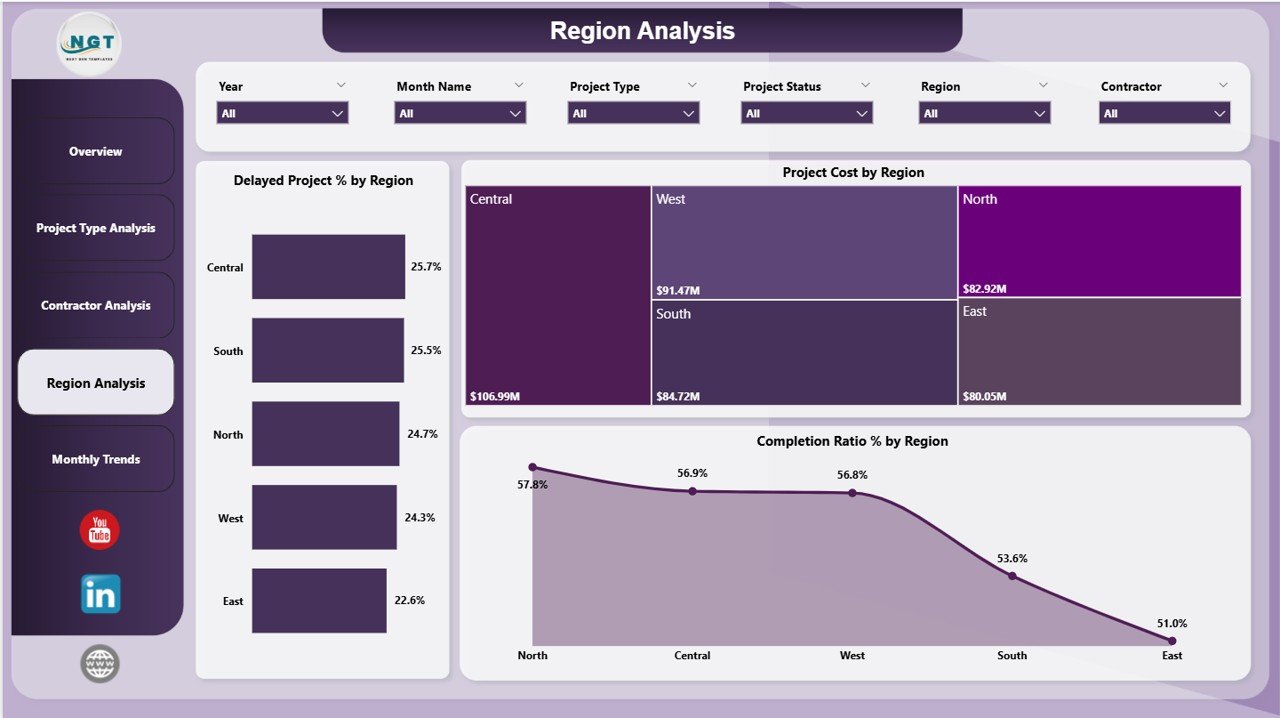
Electricity infrastructure projects often spread across multiple regions. Therefore, regional performance monitoring becomes very important.
The Region Analysis Page helps organizations understand project performance by geographical area.
Charts Available on the Region Analysis Page
This page includes three charts:
-
Delayed Project % by Region
Shows which regions experience the highest delays. -
Project Cost by Region
Displays investment distribution across regions. -
Completion Ratio % by Region
Measures project progress across different locations.
Therefore, companies can allocate resources more effectively and address regional challenges faster.
Click to Purchases Electricity Project Dashboard in Power BI
5. Monthly Trends Analysis
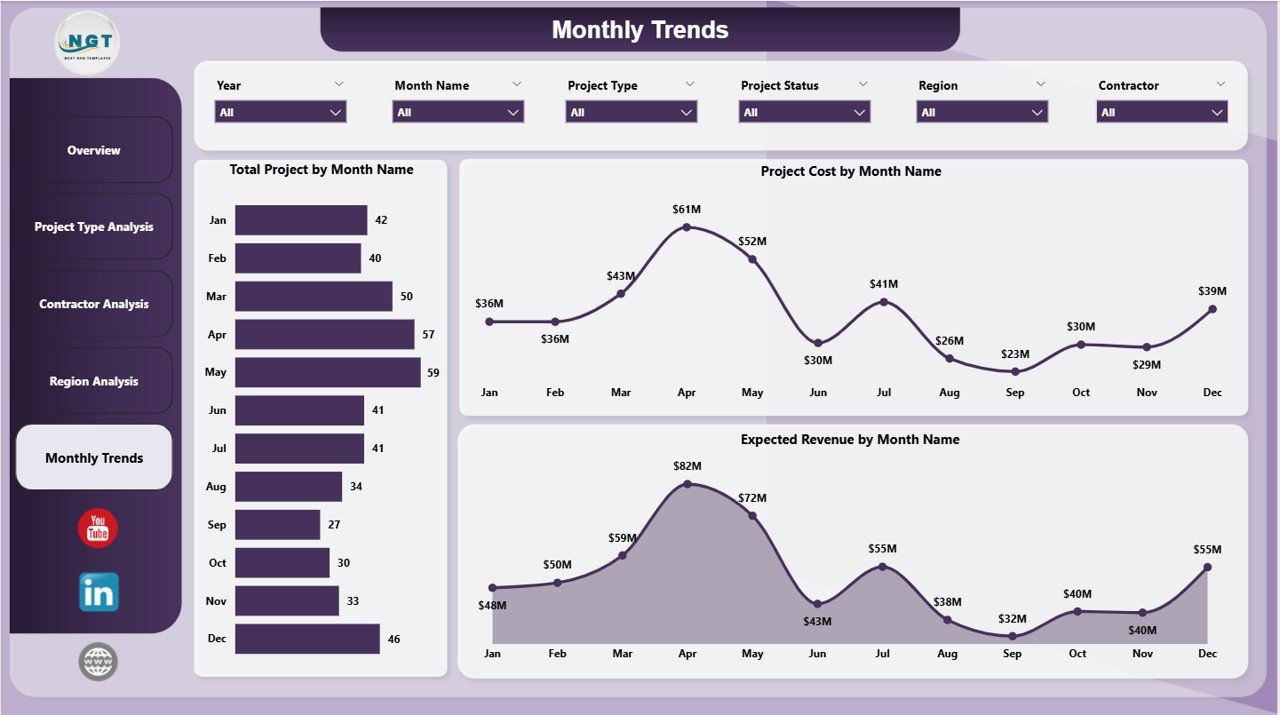
The Monthly Trends Page analyzes electricity project performance over time.
Trend analysis helps managers understand how project activity changes throughout the year.
Charts Available on the Monthly Trends Page
This page contains three trend charts:
-
Total Projects by Month Name
Displays project activity across months. -
Project Cost by Month Name
Shows monthly investment patterns. -
Expected Revenue by Month Name
Helps analyze revenue trends over time.
As a result, managers can identify seasonal patterns and improve project planning.
Advantages of Electricity Project Dashboard in Power BI
Organizations gain many benefits when they implement this dashboard.
1. Real-Time Project Monitoring
Power BI updates data automatically. Therefore, managers can monitor electricity projects in real time.
2. Improved Decision-Making
Interactive charts and KPIs provide clear insights. As a result, managers make faster and better decisions.
3. Early Delay Detection
The dashboard highlights delayed projects immediately. Consequently, teams can take corrective actions quickly.
4. Better Financial Control
The dashboard tracks project cost, expected revenue, and profit margin. Therefore, companies can manage finances more effectively.
5. Contractor Performance Visibility
Contractor analysis helps organizations evaluate contractor efficiency and reliability.
6. Regional Performance Insights
Regional dashboards allow companies to identify areas with high delays or cost overruns.
7. Easy Data Visualization
Power BI converts complex electricity project data into simple and interactive visuals.
Click to Purchases Electricity Project Dashboard in Power BI
Opportunities for Improvement in Electricity Project Management
Although dashboards improve project monitoring, organizations should still focus on improving project processes.
Here are some areas where companies can enhance performance.
1. Data Accuracy
Companies must maintain accurate data entry systems. Otherwise, dashboards may show misleading insights.
2. Integration with Project Management Systems
Integrating Power BI with ERP or project management tools improves automation and data reliability.
3. Real-Time Data Updates
Organizations should implement automatic data refresh mechanisms.
4. Advanced Predictive Analytics
Companies can add predictive models to forecast project delays and cost overruns.
5. Mobile Dashboard Access
Mobile access allows managers to monitor electricity projects from anywhere.
Best Practices for the Electricity Project Dashboard
Organizations should follow several best practices to maximize the value of this dashboard.
1. Define Clear KPIs
First, companies must identify the most important electricity project metrics such as cost, revenue, and completion ratio.
2. Use Clean and Structured Data
Secondly, teams should maintain structured datasets with standardized columns.
3. Automate Data Refresh
Automatic data refresh ensures dashboards always display the latest information.
4. Use Effective Visualizations
Companies should choose charts that clearly communicate insights.
5. Provide User Training
Managers and analysts should understand how to interpret dashboard metrics correctly.
6. Monitor Dashboard Usage
Organizations should regularly evaluate how teams use the dashboard.
Click to Purchases Electricity Project Dashboard in Power BI
Who Can Benefit from the Electricity Project Dashboard?
Many professionals can benefit from this powerful dashboard.
Project Managers
They can monitor project progress, delays, and financial performance.
Energy Companies
Electricity companies can track multiple projects across regions.
Infrastructure Developers
Developers can evaluate contractor performance and project efficiency.
Financial Analysts
Analysts can study revenue forecasts and profit margins.
Government Energy Departments
Government agencies can monitor public electricity infrastructure projects.
Conclusion
Electricity infrastructure projects require careful planning, monitoring, and financial control. Without proper visibility, organizations may struggle with project delays, cost overruns, and poor contractor performance.
Therefore, the Electricity Project Dashboard in Power BI provides a powerful solution to monitor electricity project performance effectively.
This dashboard combines financial metrics, project progress indicators, contractor analysis, regional insights, and monthly trends into a single interactive platform.
As a result, organizations can improve decision-making, detect risks early, and increase project profitability.
Consequently, companies that adopt Power BI dashboards gain better control over their electricity project operations.
Click to Purchases Electricity Project Dashboard in Power BI
Frequently Asked Questions (FAQs)
What is an Electricity Project Dashboard?
An Electricity Project Dashboard is a visual analytics tool that helps organizations track electricity project cost, revenue, progress, and contractor performance.
Why should companies use Power BI for project dashboards?
Power BI provides interactive visualizations, real-time updates, and powerful data analysis capabilities. Therefore, companies can easily monitor electricity project performance.
What KPIs are included in an Electricity Project Dashboard?
Common KPIs include:
-
Project Cost
-
Expected Revenue
-
Expected Profit
-
Completion Ratio %
-
Profit Margin %
How does this dashboard help reduce project delays?
The dashboard highlights delayed projects through visual indicators. Therefore, managers can quickly identify issues and take corrective actions.
Can this dashboard track contractor performance?
Yes. The Contractor Analysis page evaluates contractor performance using metrics such as expected revenue, expected profit, and delay percentage.
Is the Electricity Project Dashboard suitable for renewable energy projects?
Yes. This dashboard works well for solar, wind, hydro, and other renewable energy infrastructure projects.
Click to Purchases Electricity Project Dashboard in Power BI
Visit our YouTube channel to learn step-by-step video tutorials