Managing personal finances effectively requires consistent monitoring, clear goals, and structured analysis. Many individuals try to track their income, expenses, savings, and investments. However, without a proper system, financial management often becomes confusing and inefficient.
Therefore, people need a structured tool that helps them measure financial performance regularly. This is where the Personal Finance KPI Scorecard in Excel becomes extremely valuable.
The Personal Finance KPI Scorecard in Excel is a ready-to-use template designed to track key personal finance metrics using simple and visual indicators. Moreover, it allows users to compare actual financial results against targets and analyze trends over time. As a result, individuals can make smarter financial decisions and stay on track with their financial goals.
In this comprehensive guide, we will explore everything about the Personal Finance KPI Scorecard in Excel, including its features, advantages, best practices, and frequently asked questions.
Click to Purchases Personal Finance KPI Scorecard in Excel
What is a Personal Finance KPI Scorecard in Excel?
A Personal Finance KPI Scorecard in Excel is a performance monitoring tool that helps individuals evaluate their financial health using key performance indicators (KPIs).
Instead of tracking finances randomly, the scorecard organizes financial data into structured metrics such as:
-
Monthly income
-
Savings rate
-
Expense ratio
-
Investment growth
-
Debt ratio
-
Emergency fund coverage
-
Net worth growth
Excel then converts this financial data into visual scorecards, comparisons, and trend charts.
Therefore, users can easily understand whether they are meeting their financial goals.
Furthermore, the scorecard provides MTD (Month-to-Date) and YTD (Year-to-Date) comparisons, which help users track financial performance over time.
Why Should You Use a Personal Finance KPI Scorecard?
Many people track their finances using simple spreadsheets. However, these spreadsheets often fail to provide clear financial insights.
Without structured financial monitoring, individuals may experience several challenges:
-
Lack of clarity about spending patterns
-
Difficulty tracking savings goals
-
Poor investment monitoring
-
Limited visibility into financial progress
-
Inefficient budgeting
However, a Personal Finance KPI Scorecard in Excel solves these problems by organizing financial metrics into one easy-to-understand dashboard.
Consequently, users can monitor financial performance more effectively.
Key Features of the Personal Finance KPI Scorecard in Excel
The Personal Finance KPI Scorecard template contains four worksheets designed to provide a structured financial monitoring system.
Each worksheet plays a specific role in analyzing and managing personal finance KPIs.
Click to Purchases Personal Finance KPI Scorecard in Excel
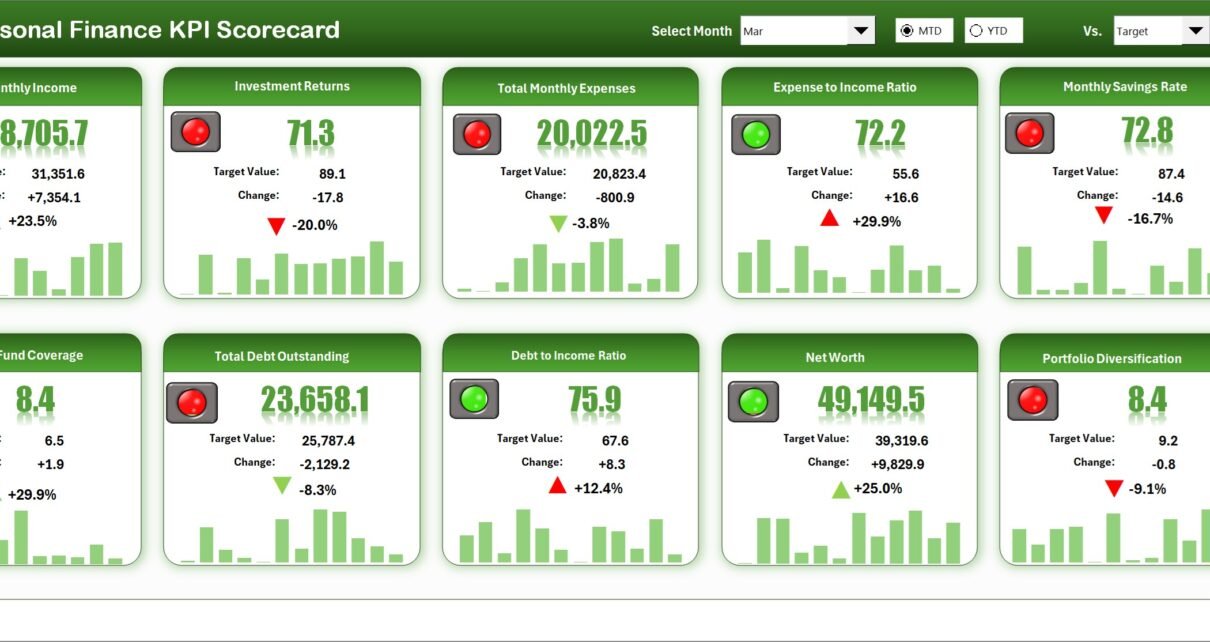
1. Scorecard Sheet
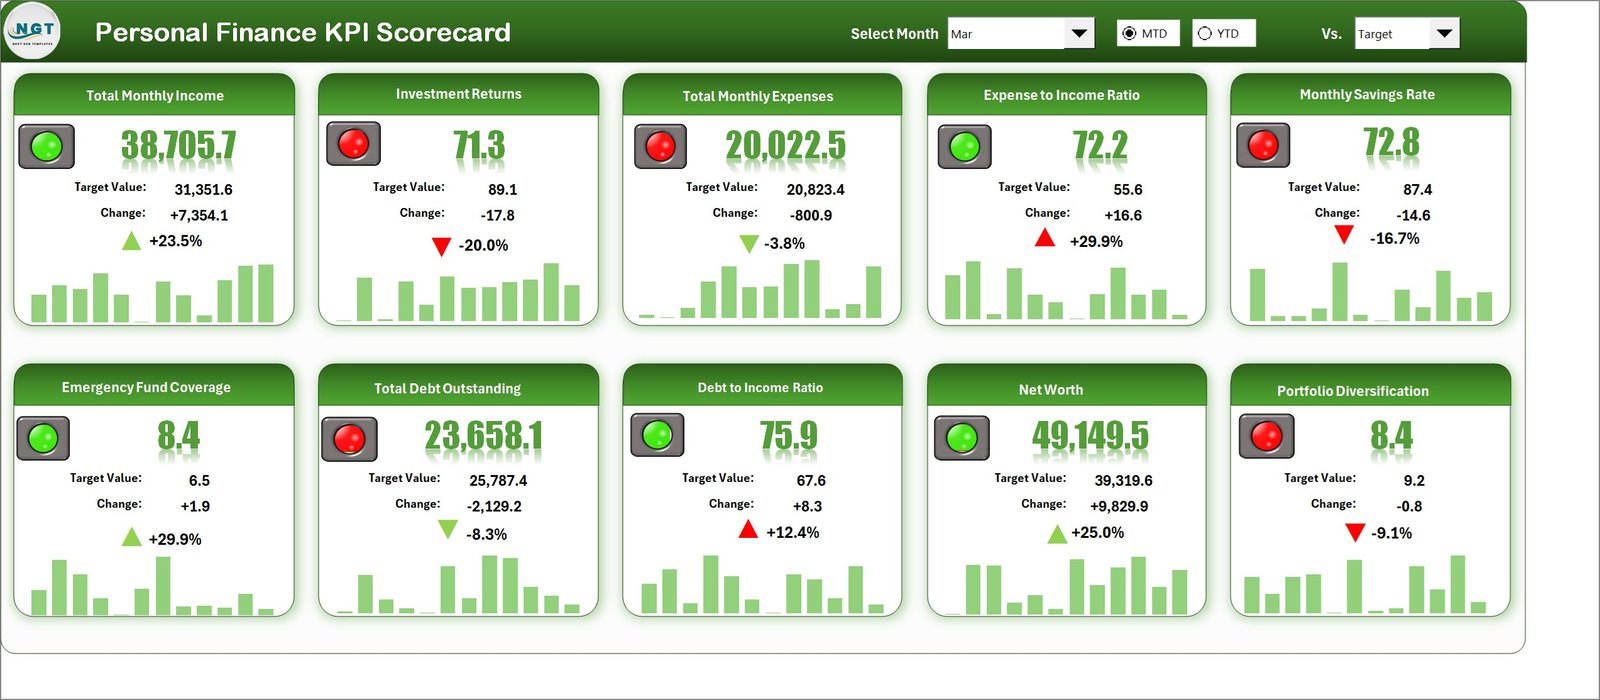
The Scorecard Sheet serves as the main interface of the KPI scorecard.
This sheet provides a complete overview of financial KPI performance.
Key Features of the Scorecard Sheet
Dropdown Menus
Users can select:
-
Month
-
MTD (Month-to-Date)
-
YTD (Year-to-Date)
Therefore, users can analyze financial performance for different periods easily.
Actual vs Target Values
The scorecard compares:
-
Actual financial results
-
Target financial goals
This comparison helps users understand whether they are achieving their financial objectives.
Visual Indicators
Conditional formatting and color indicators highlight financial performance.
For example:
-
Green indicates good performance
-
Yellow indicates caution
-
Red indicates underperformance
As a result, users can quickly identify areas that require improvement.
Comprehensive KPI Overview
The scorecard displays important information such as:
-
KPI name
-
KPI group
-
KPI unit
-
MTD values
-
YTD values
-
Target comparisons
Therefore, users can monitor all financial KPIs from one screen.
2. KPI Trend Sheet
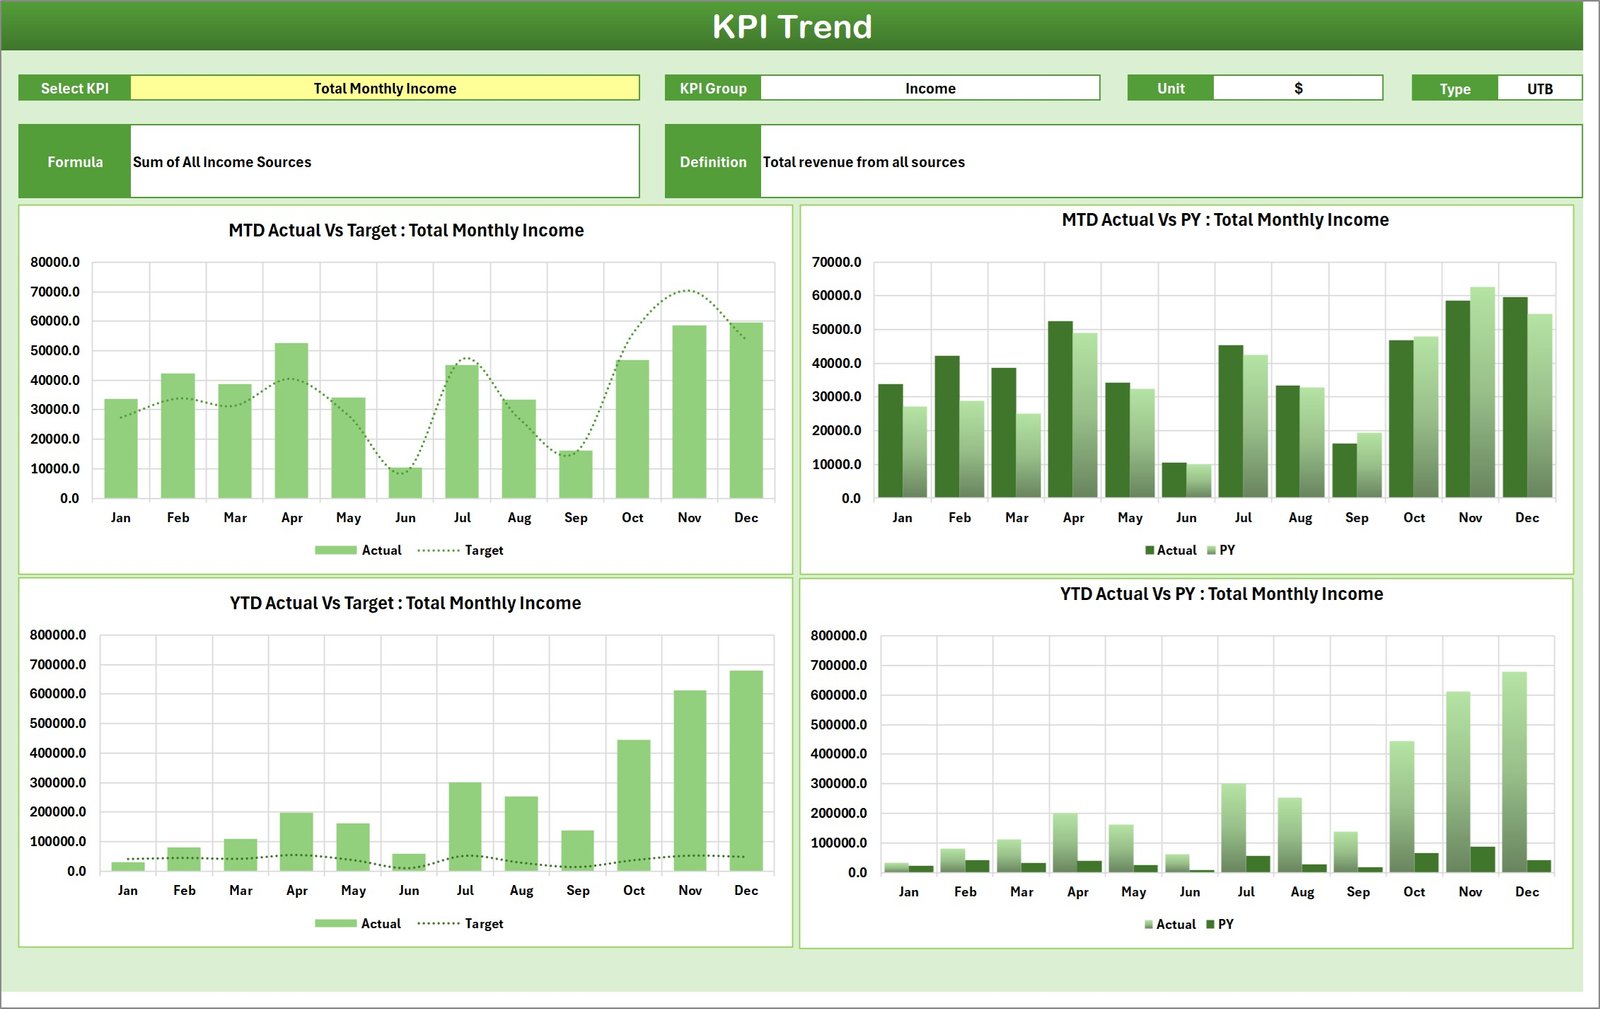
The KPI Trend Sheet helps users analyze how financial KPIs perform over time.
On this sheet, users can select a KPI from the dropdown menu located in cell C3.
Once the KPI is selected, the sheet displays detailed information including:
-
KPI Group
-
KPI Unit
-
KPI Type (Lower the Better or Upper the Better)
-
KPI Formula
-
KPI Definition
Trend Charts
This sheet also includes MTD and YTD trend charts for:
-
Actual values
-
Target values
-
Previous year (PY) values
Therefore, users can analyze whether their financial performance improves over time.
For example, users can track trends such as:
-
Savings growth
-
Expense reduction
-
Investment returns
-
Debt reduction
As a result, trend analysis helps users make better financial decisions.
3. Input Data Sheet
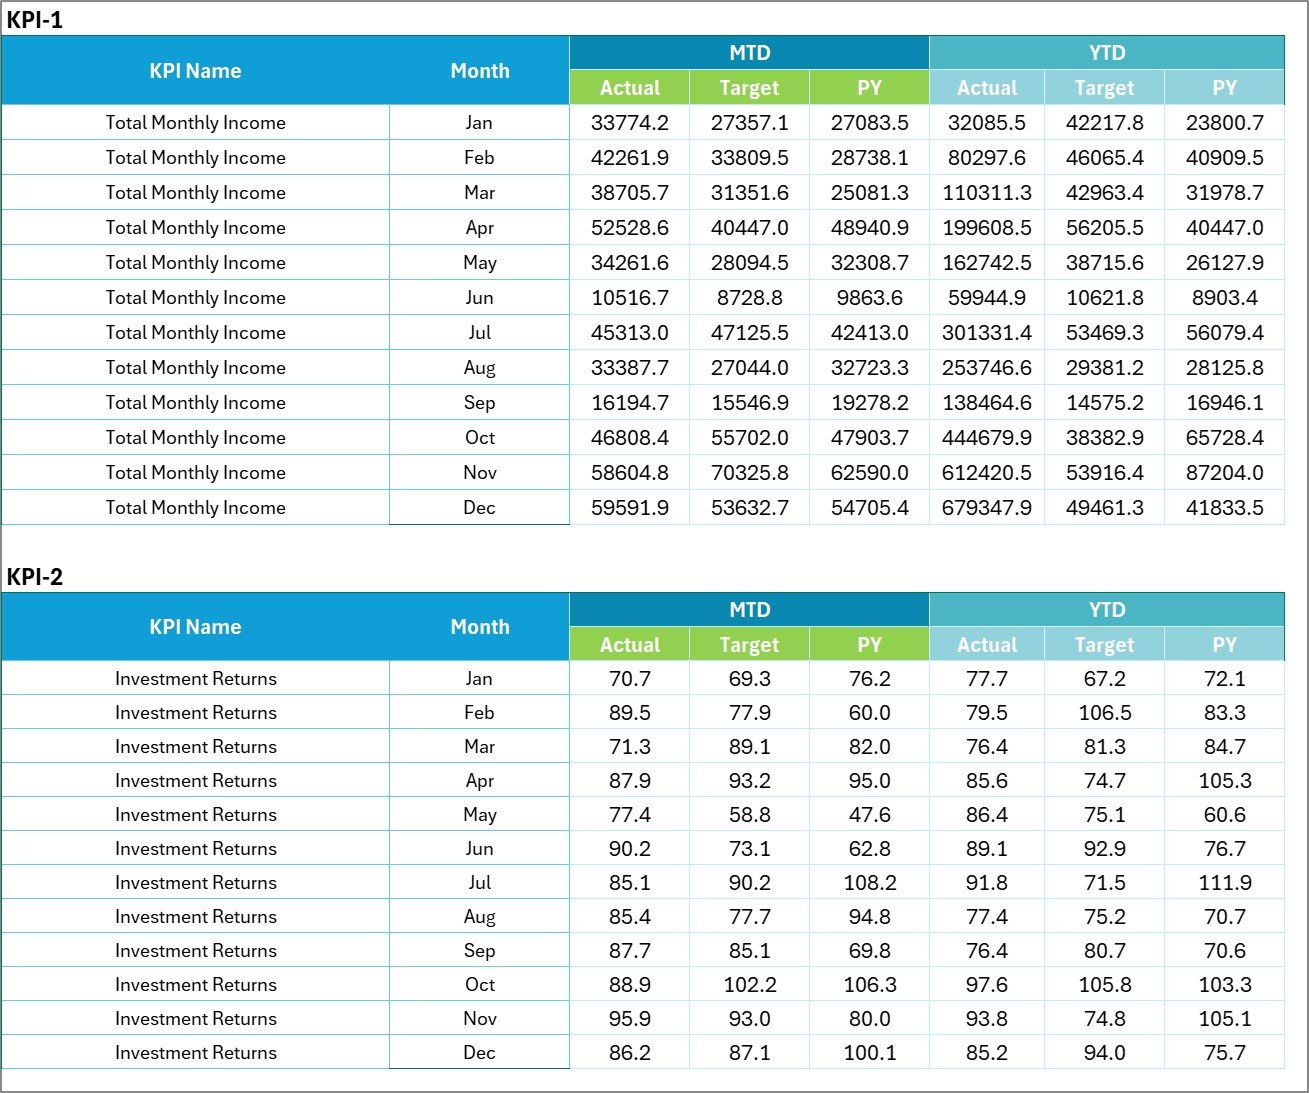
The Input Data Sheet is where users enter financial data for the scorecard.
This sheet acts as the primary data source for the entire scorecard system.
Features of the Input Data Sheet
Data Entry Section
Users can record important financial information such as:
-
Monthly income
-
Monthly expenses
-
Savings
-
Investment values
-
Debt balances
-
Budget targets
Flexible Data Updates
Users can update data whenever new financial information becomes available.
Therefore, the scorecard always reflects the latest financial results.
Additionally, structured data entry ensures the dashboard remains accurate and reliable.
4. KPI Definition Sheet
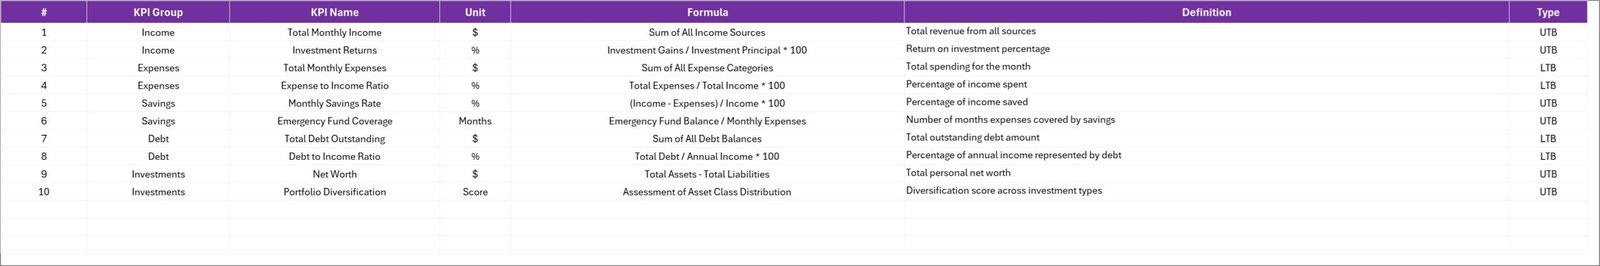
The KPI Definition Sheet contains the details and definitions of each KPI used in the scorecard.
Users must enter the following information:
-
KPI Name
-
KPI Group
-
KPI Unit
-
KPI Formula
-
KPI Definition
This sheet ensures that every KPI has a clear meaning and calculation method.
Consequently, users can interpret KPI results correctly.
Advantages of Personal Finance KPI Scorecard in Excel
Using a personal finance KPI scorecard offers several advantages.
Better Financial Visibility
The scorecard provides a complete overview of financial performance.
Improved Financial Discipline
Regular monitoring encourages better spending and saving habits.
Clear Goal Tracking
Users can compare actual financial performance against targets.
Easy Trend Analysis
Trend charts help users track financial progress over time.
Quick Performance Indicators
Color-coded indicators highlight financial strengths and weaknesses.
Flexible Data Management
Excel allows users to easily modify data and customize KPIs.
Opportunities for Improvement in Personal Finance Tracking
Although KPI scorecards improve financial monitoring, users can still improve their financial tracking practices.
Automate Data Collection
Users can connect Excel with financial apps or bank exports.
Track More Financial KPIs
Additional KPIs such as credit utilization or investment diversification can provide deeper insights.
Improve Budget Planning
Budget tracking can improve financial discipline.
Add Forecasting Models
Financial forecasting can predict future savings and expenses.
Click to Purchases Personal Finance KPI Scorecard in Excel
Best Practices for the Personal Finance KPI Scorecard
To maximize the benefits of this scorecard, users should follow several best practices.
Define Meaningful KPIs
Choose KPIs that directly impact financial health.
Update Data Regularly
Enter financial data consistently to maintain accuracy.
Review Performance Monthly
Monthly reviews help users identify financial trends early.
Set Realistic Targets
Financial targets should be achievable and practical.
Use Visual Indicators Effectively
Color-coded indicators help users quickly understand financial performance.
Who Can Benefit from This KPI Scorecard?
The Personal Finance KPI Scorecard in Excel can benefit many individuals.
Individuals Managing Personal Finances
People can track income, spending, and savings goals.
Families Planning Budgets
Families can monitor household financial performance.
Financial Coaches
Financial advisors can track client financial progress.
Students Learning Financial Management
Students can develop strong financial habits early.
Small Business Owners
Entrepreneurs can track personal and business financial KPIs.
Conclusion
Personal financial management requires discipline, monitoring, and clear goal tracking. Without structured financial analysis, individuals may struggle to understand their financial performance.
Therefore, the Personal Finance KPI Scorecard in Excel provides a powerful solution for monitoring personal financial metrics.
This ready-to-use template combines KPI monitoring, trend analysis, target comparison, and visual indicators into one structured system.
As a result, users can track financial progress, improve spending habits, and achieve their financial goals.
Consequently, adopting a KPI-based financial monitoring system helps individuals build stronger financial stability.
Click to Purchases Personal Finance KPI Scorecard in Excel
Frequently Asked Questions (FAQs)
What is a Personal Finance KPI Scorecard?
A Personal Finance KPI Scorecard is a tool that tracks key financial indicators such as savings, expenses, investments, and debt.
Why should I use Excel for personal finance tracking?
Excel provides flexibility, formulas, and visual charts that make financial tracking easier.
What KPIs should be included in a personal finance scorecard?
Common personal finance KPIs include:
-
Savings Rate
-
Expense Ratio
-
Debt-to-Income Ratio
-
Investment Growth
-
Net Worth Growth
How often should I update the KPI scorecard?
You should update the scorecard monthly to ensure accurate financial analysis.
Can this scorecard help with financial goal planning?
Yes. The scorecard compares actual financial results with targets, which helps users track financial goals effectively.
Click to Purchases Personal Finance KPI Scorecard in Excel
Visit our YouTube channel to learn step-by-step video tutorials