Artificial Intelligence continues to transform the creative industry. Today, AI art studios produce digital illustrations, concept art, NFT artwork, marketing visuals, gaming assets, and social media designs using powerful AI tools. However, as AI-generated art businesses grow, managing revenue, client satisfaction, production costs, and sales performance becomes more complex.
Therefore, AI art studios need a structured system that helps them monitor business performance clearly.
This is exactly where the AI Art Studios Dashboard in Power BI becomes extremely valuable.
Click to Purchases AI Art Studios Dashboard in Power BI
The AI Art Studios Dashboard in Power BI helps creative studios monitor key performance indicators such as revenue, profit margins, client satisfaction, production costs, and tool usage. Moreover, the dashboard converts raw studio data into clear visual insights, allowing business owners and creative teams to make faster decisions.
In this detailed guide, you will learn everything about the AI Art Studios Dashboard in Power BI, including its features, dashboard structure, advantages, best practices, and frequently asked questions.
What is an AI Art Studios Dashboard in Power BI?
An AI Art Studios Dashboard in Power BI is a data visualization and analytics tool that helps AI-based creative studios monitor their operational and financial performance.
Instead of analyzing scattered spreadsheets or reports, the dashboard consolidates all business data into an interactive visualization environment.
As a result, studio managers can easily analyze:
-
Revenue performance
-
Profit margins
-
Client satisfaction
-
Production costs
-
Sales platform performance
-
AI tool usage
Because Power BI offers interactive filters, slicers, and visual charts, studio managers can instantly analyze trends and identify opportunities for improvement.
Furthermore, this dashboard provides real-time insights that help studios optimize pricing strategies, production workflows, and marketing channels.
Why Do AI Art Studios Need a Power BI Dashboard?
AI art studios operate in a fast-moving digital marketplace. They serve multiple clients, work across various platforms, and use several AI tools to create artwork.
However, without proper analytics, studios may face challenges such as:
-
Difficulty tracking revenue from multiple platforms
-
Limited visibility into production costs
-
Poor understanding of client behavior
-
Inefficient pricing strategies
-
Lack of performance tracking
Therefore, a Power BI dashboard helps studios track performance in a structured and visual way.
Additionally, decision-makers can quickly identify profitable platforms, high-performing art categories, and cost-heavy production areas.
Consequently, the studio can improve profitability and efficiency.
Key Features of the AI Art Studios Dashboard in Power BI
The AI Art Studios Dashboard contains several powerful analytical features that help studios understand their business performance.
Key features include:
-
Interactive slicers for filtering data
-
KPI cards showing important metrics
-
Dynamic charts for performance analysis
-
Multi-page analytical dashboards
-
Real-time performance insights
-
Tool usage analysis
-
Client behavior analysis
Moreover, the dashboard organizes all analytics into five structured pages, which makes navigation simple and intuitive.
Dashboard Structure of the AI Art Studios Dashboard
The AI Art Studios Dashboard in Power BI consists of five interactive analytical pages. Each page focuses on a specific aspect of studio performance.
Let us explore each dashboard page in detail.
Click to Purchases AI Art Studios Dashboard in Power BI
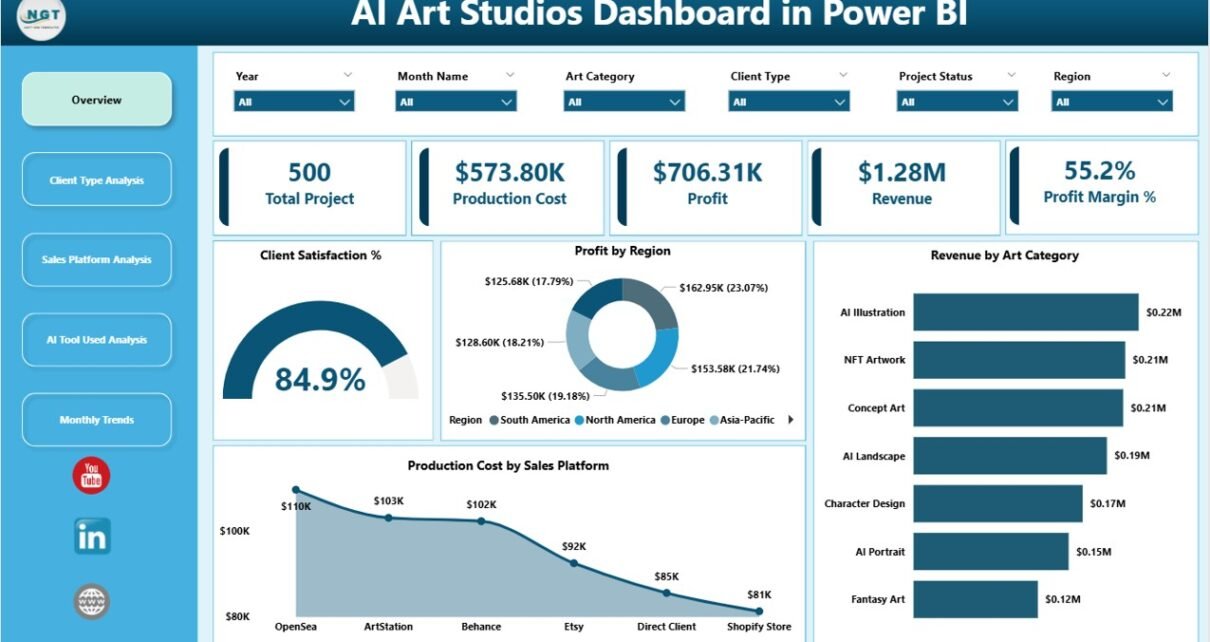
1. Overview Page – The Central Performance Dashboard
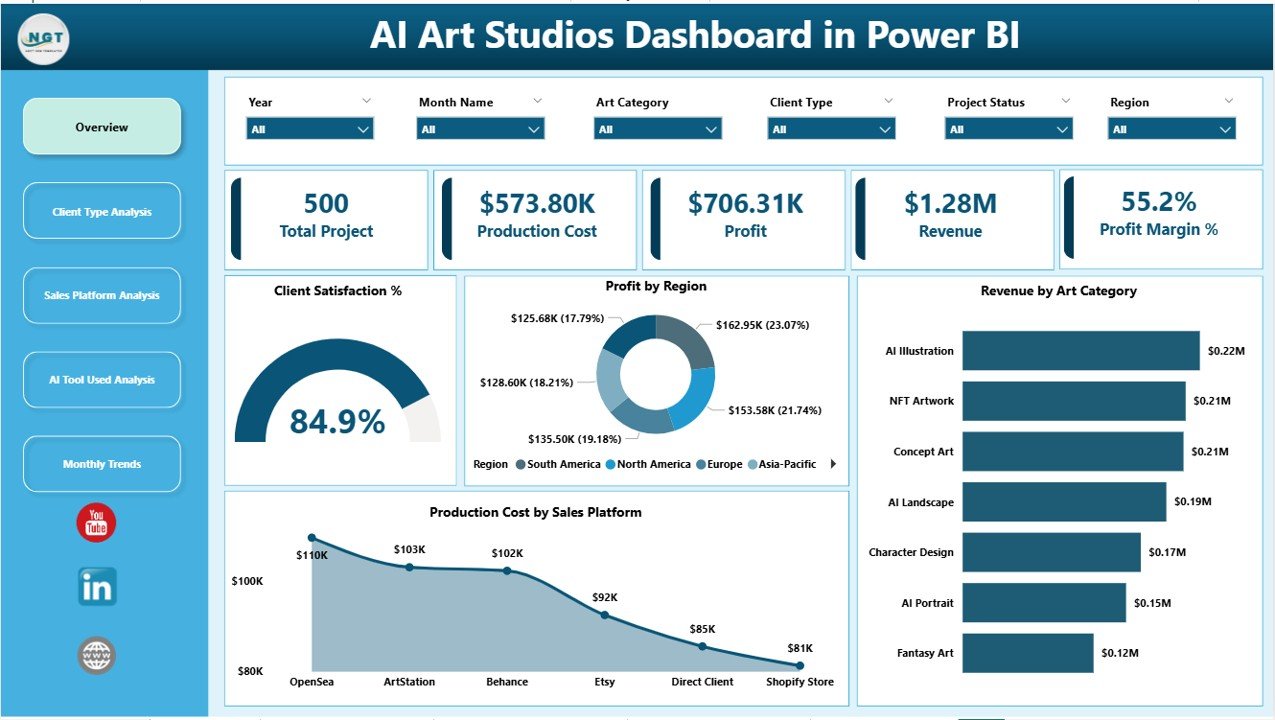
The Overview Page acts as the main dashboard where studio owners can quickly analyze the overall performance of the AI art business.
This page contains interactive slicers that allow users to filter the data based on different parameters.
In addition, the page displays five KPI cards that highlight key performance indicators.
KPI Cards on the Overview Page
The main cards include:
-
Client Satisfaction % – Measures overall client feedback and satisfaction levels.
-
Profit by Region – Shows profitability across different geographic markets.
-
Revenue by Art Category – Displays revenue distribution across art types.
-
Production Cost by Sales Platform – Tracks operational costs based on platforms.
-
Additional KPI insights for quick performance monitoring.
These KPI indicators provide a quick snapshot of the business health.
Charts on the Overview Page
The overview page also contains visual charts that highlight major performance metrics.
These charts help managers instantly identify:
-
Which art category generates the highest revenue
-
Which region contributes the most profit
-
Which sales platform has higher production costs
Therefore, studio owners can quickly identify opportunities for growth.
2. Client Type Analysis Dashboard
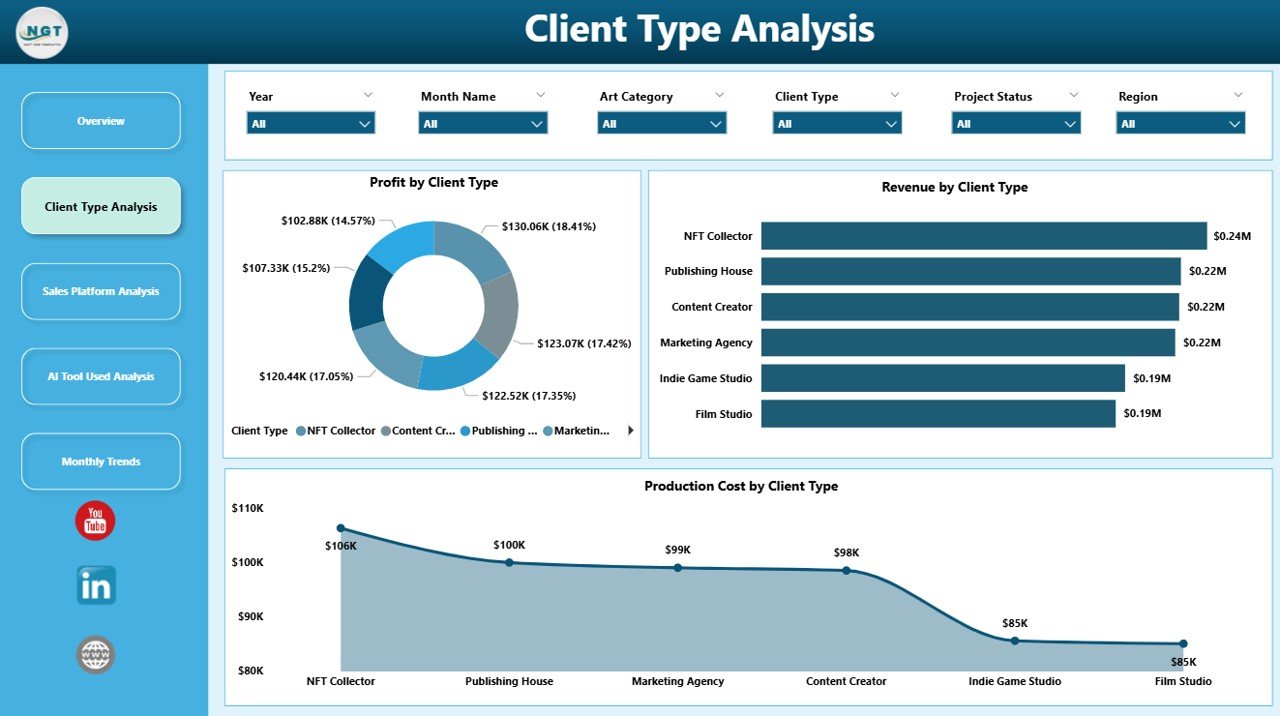
The Client Type Analysis Page focuses on analyzing different client segments.
Since AI art studios serve multiple client types such as businesses, gaming companies, NFT collectors, marketing agencies, and independent creators, analyzing client behavior becomes very important.
This page contains slicers that allow filtering data based on client types.
Charts on the Client Type Analysis Page
The page includes three analytical charts:
-
Profit by Client Type
-
Revenue by Client Type
-
Production Cost by Client Type
These charts help studios understand which client groups generate the most revenue and profit.
Click to Purchases AI Art Studios Dashboard in Power BI
For example:
-
Marketing agencies may generate high-volume orders.
-
Gaming studios may request complex artwork.
-
NFT collectors may generate high-value purchases.
Therefore, studios can adjust pricing strategies and marketing efforts accordingly.
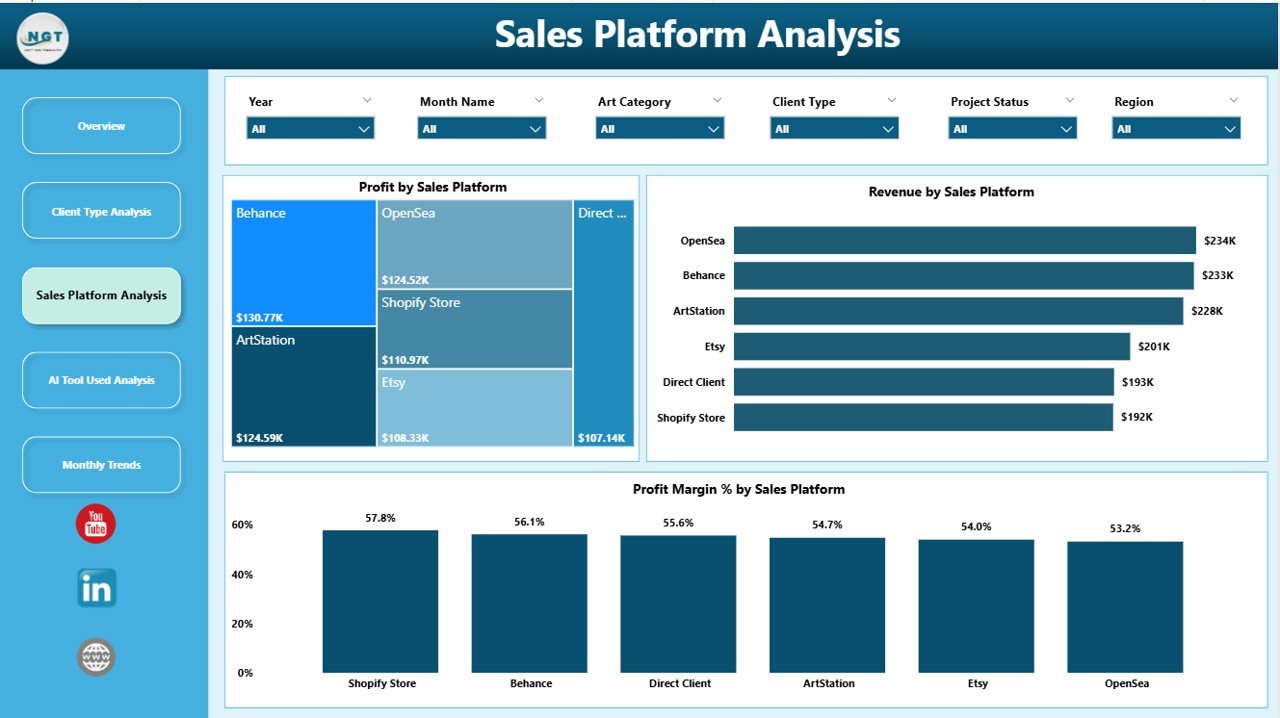
3. Sales Platform Analysis Dashboard
AI art studios usually sell their artwork through multiple platforms such as:
-
Online marketplaces
-
NFT platforms
-
Freelance websites
-
Direct client contracts
-
Digital asset stores
However, each platform may perform differently.
Therefore, the Sales Platform Analysis Dashboard helps studios evaluate the performance of every sales channel.
Charts on the Sales Platform Analysis Page
The dashboard includes three major charts:
-
Profit by Sales Platform
-
Revenue by Sales Platform
-
Profit Margin % by Sales Platform
These insights help studios identify:
-
The most profitable platform
-
High-revenue platforms
-
Platforms with low profit margins
As a result, studios can allocate marketing resources more efficiently.
4. AI Tool Used Analysis Dashboard
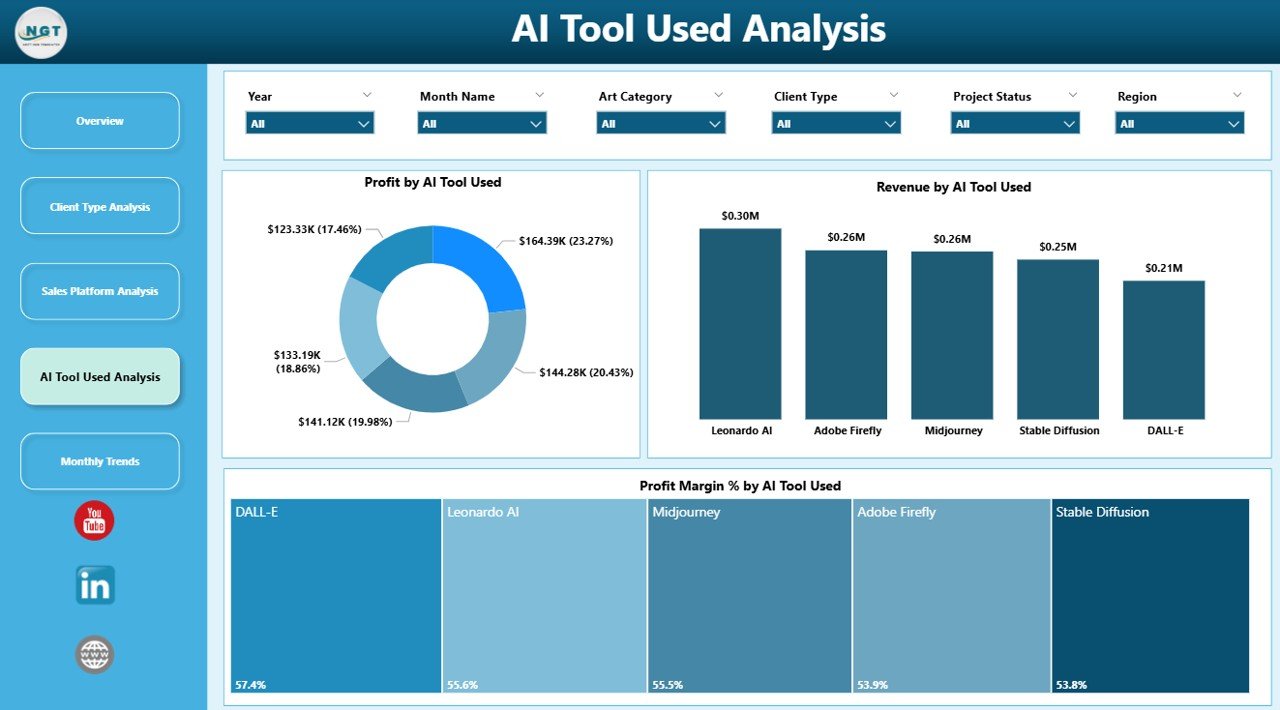
AI art studios rely heavily on different AI tools to generate digital artwork.
Popular tools may include:
-
AI image generators
-
AI design assistants
-
AI concept generators
-
AI editing tools
However, each tool may impact productivity and cost differently.
Therefore, the AI Tool Used Analysis Dashboard tracks the financial performance of each AI tool used in production.
Charts in the AI Tool Analysis Page
The page contains three analytical charts:
Click to Purchases AI Art Studios Dashboard in Power BI
-
Profit by Tool Used
-
Revenue by Tool Used
-
Profit Margin % by Tool Used
These insights help studios determine:
-
Which tools generate higher profits
-
Which tools contribute to higher production costs
-
Which tools deliver better efficiency
Consequently, studio managers can optimize tool subscriptions and software investments.
5. Month Analysis Dashboard
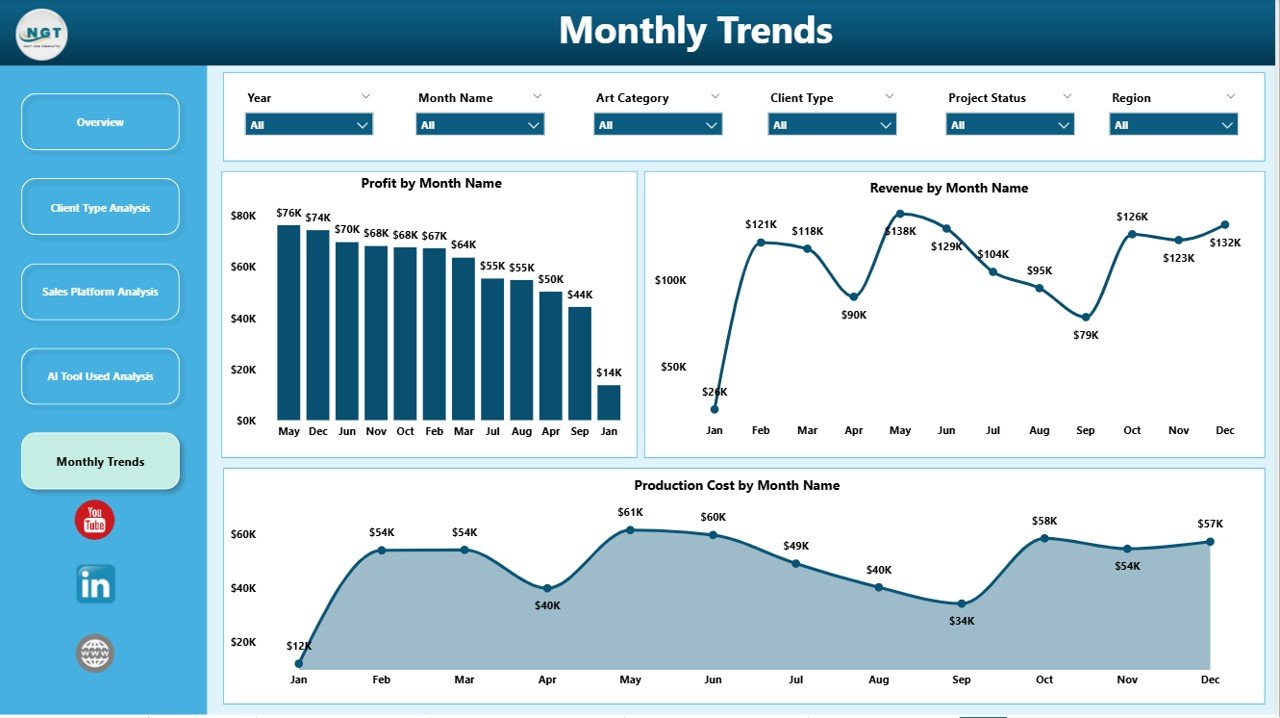
The Month Analysis Dashboard focuses on analyzing financial performance across different months.
Seasonal demand often affects digital artwork sales. For example:
-
NFT art sales may spike during crypto market trends.
-
Marketing campaigns may increase design demand.
-
Gaming releases may boost concept art orders.
Therefore, analyzing monthly performance helps studios understand these trends.
Charts in the Month Analysis Page
The page includes three charts:
-
Profit by Month
-
Revenue by Month
-
Production Cost by Month
These charts allow studios to monitor seasonal trends and plan future campaigns.
As a result, studios can forecast demand and allocate resources more effectively.
Advantages of AI Art Studios Dashboard in Power BI
The AI Art Studios Dashboard in Power BI provides several advantages for creative businesses.
1. Centralized Data Management
The dashboard consolidates all studio data into a single platform. Therefore, managers can analyze everything without switching between spreadsheets.
2. Real-Time Business Insights
Power BI updates data automatically. As a result, studio managers always see the latest performance metrics.
3. Improved Decision-Making
Because the dashboard presents clear visual insights, decision-makers can easily identify profitable strategies.
4. Better Financial Monitoring
The dashboard tracks revenue, profit margins, and production costs. Therefore, studios can control expenses more effectively.
5. Client Behavior Insights
Studios can analyze client types and purchasing patterns. Consequently, they can improve marketing and client targeting.
6. Tool Performance Monitoring
The dashboard reveals which AI tools generate higher revenue and profits. As a result, studios can optimize software investments.
Best Practices for the AI Art Studios Dashboard
To get maximum value from the AI Art Studios Dashboard in Power BI, studios should follow certain best practices.
1. Maintain Accurate Data
Always update your dataset regularly. Clean and accurate data improves the quality of insights.
2. Define Clear KPIs
Identify important metrics such as:
-
Revenue
-
Profit margin
-
Client satisfaction
-
Production cost
-
Tool efficiency
These KPIs help track business performance effectively.
3. Use Interactive Filters
Use Power BI slicers to filter data by:
-
Client type
-
Sales platform
-
Month
-
Art category
-
AI tools
This approach improves analysis flexibility.
4. Monitor Cost Efficiency
Track production costs carefully. AI tools, software subscriptions, and processing time may affect profitability.
5. Analyze Platform Performance
Focus on platforms that generate higher profits and stronger client engagement.
6. Review Dashboard Insights Regularly
Analyze the dashboard frequently to identify emerging trends and opportunities.
How Can AI Art Studios Use This Dashboard for Growth?
Click to Purchases AI Art Studios Dashboard in Power BI
AI art studios can use the dashboard to improve business growth in multiple ways.
Identify Profitable Art Categories
Studios can analyze which art categories generate the most revenue. Consequently, they can focus on producing similar content.
Optimize Marketing Channels
By analyzing platform performance, studios can invest more in profitable sales channels.
Improve Client Targeting
Studios can identify their most valuable client segments and focus marketing efforts accordingly.
Control Production Costs
Cost analysis helps studios reduce unnecessary expenses and improve efficiency.
Forecast Demand Trends
Monthly analysis helps studios prepare for seasonal demand.
Conclusion
The creative industry continues to evolve rapidly with the rise of artificial intelligence. As AI art studios grow and handle more clients, projects, and platforms, managing business performance becomes increasingly challenging.
Therefore, studios must adopt modern analytics tools that provide clear insights into their operations.
The AI Art Studios Dashboard in Power BI offers a powerful solution for monitoring revenue, profit margins, client satisfaction, production costs, tool performance, and sales platforms.
Because the dashboard organizes data into interactive visual reports, studio managers can quickly analyze performance and make informed decisions.
As a result, studios can improve profitability, optimize workflows, and scale their creative businesses more effectively.
Frequently Asked Questions (FAQs)
What is an AI Art Studios Dashboard in Power BI?
An AI Art Studios Dashboard in Power BI is a data analytics tool that helps creative studios track revenue, profit, production costs, client performance, and sales platforms using interactive visual reports.
Who can use the AI Art Studios Dashboard?
Several professionals can benefit from this dashboard, including:
-
AI art studio owners
-
Digital artists
-
Creative agencies
-
NFT creators
-
Game art studios
-
Marketing design teams
What metrics does the dashboard track?
The dashboard tracks several key performance indicators such as:
-
Revenue
-
Profit margin
-
Client satisfaction
-
Production cost
-
Tool usage performance
-
Sales platform performance
Why should AI art studios use Power BI?
Power BI provides powerful visualization tools, real-time data updates, and interactive filtering options. Therefore, studios can easily analyze business performance and make data-driven decisions.
Can this dashboard support business growth?
Yes. The dashboard helps studios identify profitable clients, optimize pricing strategies, analyze production costs, and monitor tool efficiency. As a result, studios can grow their business more effectively.
Visit our YouTube channel to learn step-by-step video tutorials