Smart cities rely on advanced technologies, digital infrastructure, and innovative public services to improve urban living. Governments and municipalities invest heavily in smart city projects such as intelligent transportation systems, smart lighting, waste management automation, IoT infrastructure, and public safety technologies.
However, managing these large-scale projects involves multiple contracts, vendors, project managers, budgets, and regional operations. When organizations track project performance using scattered spreadsheets or manual reports, they often struggle to monitor costs, revenue, contract status, and profitability.
Therefore, city planners and project managers require a centralized analytics tool that can track contract performance efficiently.
This is where the Smart Cities Contract Dashboard in Excel becomes extremely valuable.
The Smart Cities Contract Dashboard in Excel is a ready-to-use Excel template designed to track contract performance, implementation costs, revenues, project profitability, and payment status across different smart city projects.
Moreover, the dashboard transforms complex contract data into clear visual insights using KPI cards, charts, and interactive slicers. Because Excel provides flexibility and dynamic calculations, organizations can easily update project data and analyze contract performance instantly.
In this comprehensive guide, we will explore the Smart Cities Contract Dashboard in Excel, including its features, structure, advantages, best practices, and frequently asked questions.
Click to Purchases Smart Cities Contract Dashboard in Excel
What is a Smart Cities Contract Dashboard in Excel?
A Smart Cities Contract Dashboard in Excel is a data visualization and reporting tool that helps organizations track and analyze the performance of smart city contracts.
Instead of reviewing multiple reports, the dashboard centralizes all important project information into a single interactive interface.
Using this dashboard, organizations can monitor:
-
Contract implementation costs
-
Revenue generated from smart city projects
-
Profit and profit margins
-
Contract completion status
-
Vendor performance
-
Regional project performance
-
Monthly financial trends
Furthermore, the dashboard includes multiple analytical pages that provide insights from different perspectives.
As a result, decision-makers can monitor project progress, control budgets, and improve contract management efficiency.
Why Do Smart City Projects Need Contract Dashboards?
Smart city initiatives involve complex project ecosystems that include government agencies, private contractors, technology vendors, and financial stakeholders.
However, managing these contracts manually creates several challenges.
For example:
-
Project cost tracking becomes difficult
-
Contract profitability remains unclear
-
Payment delays go unnoticed
-
Vendor performance becomes difficult to evaluate
-
Regional project performance lacks visibility
Therefore, organizations require a data-driven contract monitoring system.
A contract dashboard allows decision-makers to:
-
Track project financial performance
-
Monitor active contracts and completion status
-
Analyze vendor and project manager performance
-
Identify overdue payments
-
Improve budget control
Consequently, the Smart Cities Contract Dashboard in Excel becomes an essential management tool for smart city project monitoring.
Key Features of the Smart Cities Contract Dashboard in Excel
The dashboard includes several powerful features designed to simplify smart city contract management.
Interactive Page Navigator
The page navigator appears on the left side of the dashboard, allowing users to switch between analytical pages easily.
KPI Performance Cards
The dashboard displays key performance indicators using visual KPI cards.
Interactive Slicers
Slicers on the right side allow users to filter the data dynamically.
Multi-page Analytical Structure
Five analytical pages provide detailed insights into project performance.
Contract Performance Monitoring
Users can track contract profitability, implementation cost, and completion status.
Vendor Performance Tracking
The dashboard analyzes vendor contributions and financial results.
Regional Performance Insights
Users can monitor contract performance across different regions.
Monthly Trend Analysis
Monthly charts help identify financial trends and seasonal variations.
Dashboard Structure Explained
The Smart Cities Contract Dashboard in Excel includes five analytical pages.
Each page focuses on a specific aspect of contract performance.
Click to Purchases Smart Cities Contract Dashboard in Excel
1. Overview Page – Smart City Project Performance Summary

The Overview Page serves as the primary monitoring interface of the dashboard.
Users can filter data using slicers located on the right side of the page.
KPI Cards on the Overview Page
The dashboard displays five KPI cards.
Implementation Cost
Shows the total cost required to implement smart city projects.
Revenue
Displays the total revenue generated from contracts.
Profit
Represents the difference between revenue and implementation cost.
Average Completion
Indicates the average completion rate of smart city contracts.
Profit Margin (%)
Shows the profitability percentage of projects.
Charts on the Overview Page
The overview page also includes four analytical charts.
Profit by Project Manager
Displays the profit generated by different project managers.
Active Contract (%)
Shows the percentage of active contracts within the portfolio.
Implementation Cost by Payment Status
Displays cost distribution based on payment status.
Profit Margin (%) by Region
Shows how profitability varies across regions.
These insights help organizations understand overall project performance.
2. Project Manager Analysis – Performance by Project Leader

The Project Manager Analysis Page evaluates how different project managers perform across smart city projects.
Slicers allow users to filter data easily.
Charts in this Page
Revenue by Project Manager
Shows the revenue generated by each project manager.
Active Contract by Project Manager
Displays the number of active contracts managed by each manager.
ROI (%) by Project Manager
Analyzes return on investment for projects handled by each manager.
Profit Margin (%) by Project Manager
Shows profitability levels for different project managers.
This page helps organizations identify top-performing project leaders.
3. Vendor Analysis – Supplier Performance Insights

The Vendor Analysis Page focuses on vendor contributions to smart city projects.
This page helps organizations monitor vendor performance and financial impact.
Charts in this Page
Revenue by Vendor
Shows revenue generated from vendor-related contracts.
Profit by Vendor
Displays profit contribution from each vendor.
Total Contract by Vendor
Shows the number of contracts associated with each vendor.
Overdue Payment (%) by Vendor
Displays the percentage of overdue payments for vendors.
This analysis helps organizations manage vendor relationships effectively.
4. Region Analysis – Regional Contract Performance

The Region Analysis Page analyzes project performance across different geographic regions.
Smart city initiatives often span multiple regions or cities, making regional analysis critical.
Charts in this Page
Implementation Cost by Region
Shows how project implementation costs vary across regions.
Revenue by Region
Displays revenue generated from regional contracts.
Overdue Payment by Region
Highlights regions where payments remain overdue.
Profit by Region
Shows profitability across different regions.
This analysis helps governments and agencies allocate resources effectively.
5. Monthly Trends – Performance Over Time
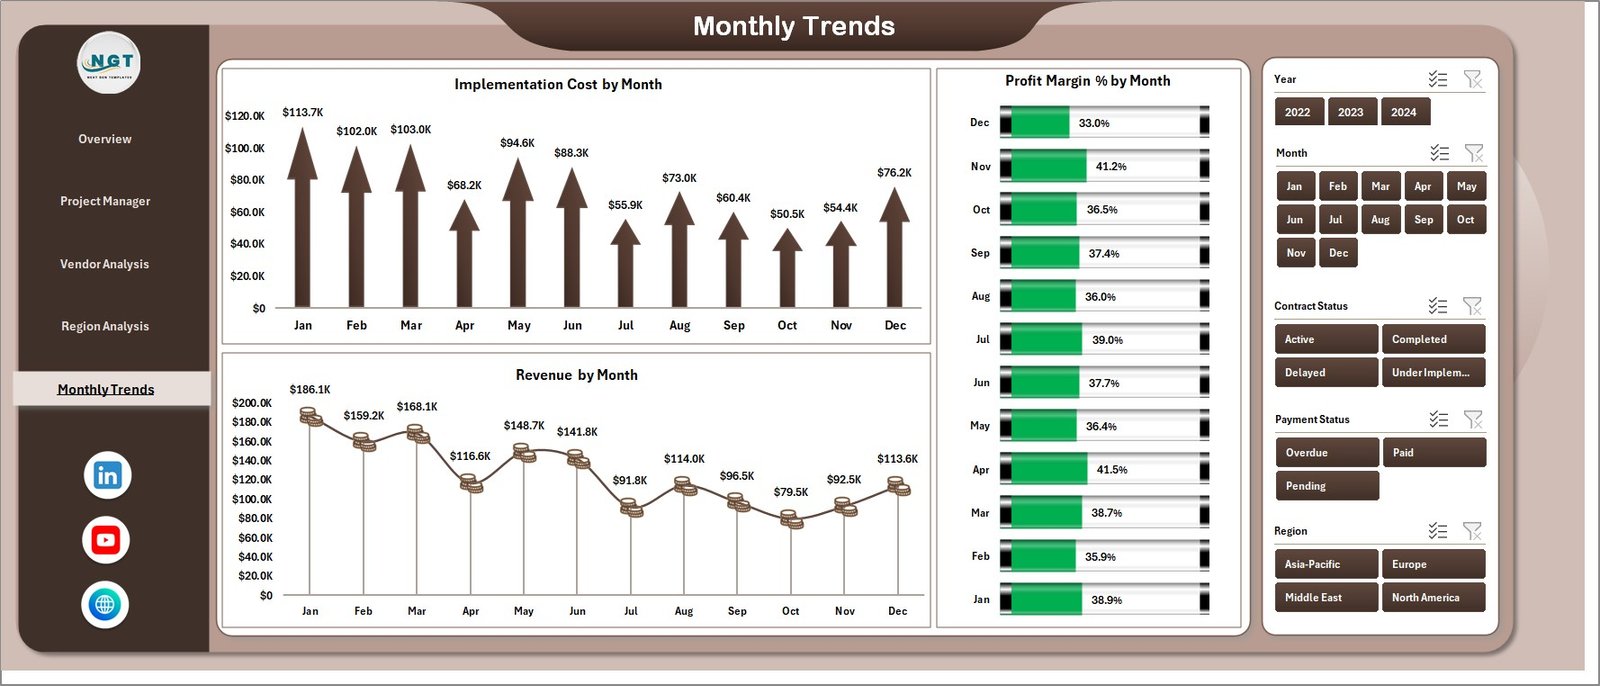
The Monthly Trends Page focuses on financial trends across different months.
Understanding monthly trends helps organizations plan budgets and track project progress.
Charts in this Page
Implementation Cost by Month
Shows how project spending changes throughout the year.
Profit Margin (%) by Month
Displays monthly profitability trends.
Revenue by Month
Shows revenue fluctuations across months.
These insights help organizations analyze seasonal patterns in project performance.
Support Sheet and Data Sheet
The dashboard also includes Support Sheets and Data Sheets.
Data Sheet
The data sheet stores the raw data used to build the dashboard.
It includes information such as:
-
Project Manager
-
Vendor
-
Region
-
Implementation Cost
-
Revenue
-
Profit
-
Contract Status
-
Payment Status
-
Month
Users can update this sheet regularly to refresh the dashboard.
Support Sheet
The support sheet stores helper calculations, lookup tables, and intermediate formulas required for the dashboard.
This sheet ensures that charts and calculations function properly.
Click to Purchases Smart Cities Contract Dashboard in Excel
Advantages of the Smart Cities Contract Dashboard in Excel
Using this dashboard provides several operational and strategic benefits.
Centralized Contract Monitoring
All contract information appears in a single dashboard.
Improved Financial Visibility
Managers can monitor costs, revenue, and profit clearly.
Better Project Management
Project managers can track contract performance easily.
Vendor Performance Evaluation
Organizations can identify reliable vendors and address issues quickly.
Regional Performance Insights
Decision-makers can analyze regional project outcomes.
Improved Decision-Making
Visual insights help leaders make faster decisions.
Time-Saving Analytics
The dashboard eliminates the need for manual reporting.
Opportunities for Improvement
Although the dashboard already provides strong analytics capabilities, organizations can enhance it further.
For example:
-
Add project timeline tracking
-
Integrate real-time project data sources
-
Include contract risk analysis
-
Add payment aging reports
-
Track vendor performance scores
-
Include sustainability KPIs for smart city initiatives
These improvements can make the dashboard even more powerful.
Best Practices for the Smart Cities Contract Dashboard
Organizations should follow best practices to maximize dashboard effectiveness.
Maintain Accurate Project Data
Ensure that contract data remains updated.
Standardize KPI Definitions
Use consistent formulas for revenue, cost, and profit calculations.
Review Dashboard Insights Regularly
Managers should review project performance frequently.
Focus on Actionable KPIs
Track metrics that directly impact project success.
Train Teams to Use the Dashboard
Ensure stakeholders understand how to interpret dashboard insights.
Monitor Financial Trends
Analyze long-term trends instead of focusing only on monthly results.
Conclusion
The Smart Cities Contract Dashboard in Excel provides a powerful analytics solution for monitoring smart city project contracts.
Instead of managing complex project data through scattered reports, organizations can centralize contract monitoring into a single interactive dashboard.
With features such as KPI cards, vendor analysis, regional performance insights, project manager analytics, and monthly trend tracking, the dashboard enables governments and organizations to manage smart city initiatives efficiently.
Moreover, Excel’s flexibility ensures that users can easily update data and generate real-time insights.
Therefore, organizations that implement this dashboard can improve contract monitoring, optimize financial performance, and ensure successful smart city project delivery.
Click to Purchases Smart Cities Contract Dashboard in Excel
Frequently Asked Questions (FAQs)
What is a Smart Cities Contract Dashboard in Excel?
It is an Excel-based analytics dashboard used to track contract performance, project costs, revenue, and profitability.
Who should use this dashboard?
Government agencies, smart city project managers, contractors, and urban development teams can use this dashboard.
What metrics does the dashboard track?
The dashboard tracks implementation cost, revenue, profit, profit margin, contract completion, vendor performance, and regional analysis.
Can this dashboard track multiple projects?
Yes. The dashboard supports multiple projects across regions, vendors, and project managers.
Is Excel suitable for contract analytics?
Yes. Excel allows dynamic dashboards, data analysis, and flexible reporting for contract performance monitoring.
Can the dashboard integrate with other systems?
With advanced configuration, the dashboard can integrate with databases or external project management systems.
Click to Purchases Smart Cities Contract Dashboard in Excel
Visit our YouTube channel to learn step-by-step video tutorials