Artificial Intelligence research labs handle large volumes of data every day. These labs manage multiple projects, departments, research teams, funding sources, and regional operations. As a result, research managers must track budgets, project progress, funding allocation, performance targets, and completion rates regularly.
However, when organizations rely on scattered spreadsheets and manual reporting, they often struggle to understand the real performance of their research activities. Decision-makers need a centralized system that helps them analyze research performance quickly and clearly.
Therefore, many research institutions now use analytical dashboards to monitor their research operations.
Click to Purchases AI Research Labs Dashboard in Excel
One of the most practical and flexible tools for building such dashboards is Microsoft Excel. Excel allows users to organize data, build pivot tables, create charts, and develop interactive dashboards without complex software.
The AI Research Labs Dashboard in Excel provides a ready-to-use analytical solution that helps research organizations monitor project budgets, track research performance, analyze department activities, and evaluate regional outcomes.
Moreover, this dashboard transforms raw research data into meaningful insights through KPI cards, charts, and slicers, allowing decision-makers to understand project performance instantly.
In this article, we will explore the AI Research Labs Dashboard in Excel, its structure, features, benefits, and best practices.
What is the AI Research Labs Dashboard in Excel?
The AI Research Labs Dashboard in Excel is an interactive Excel template designed to analyze and monitor the performance of AI research projects across different labs, departments, funding sources, and regions.
Instead of manually reviewing multiple spreadsheets, research managers can analyze key performance metrics in one place.
The dashboard provides insights into:
-
Research project budgets
-
Project completion rates
-
Target achievement levels
-
High-priority research projects
-
Department performance
-
Funding source allocation
-
Regional research performance
Because Excel supports pivot tables, slicers, and dynamic charts, users can easily filter and analyze research data.
As a result, research leaders gain clear visibility into research progress and funding utilization.
Why Do AI Research Labs Need a Dashboard?
AI research labs manage complex operations that involve multiple teams, technologies, and funding sources. Therefore, tracking project performance becomes challenging.
However, a well-designed dashboard solves this problem.
Here are the key reasons why AI research labs need a dashboard:
-
Monitor research project budgets
-
Track project progress and completion status
-
Evaluate department performance
-
Analyze funding allocation
-
Identify high-priority research projects
-
Monitor regional research activities
-
Improve decision-making based on data
Consequently, research leaders can identify performance gaps and allocate resources effectively.
Key Features of the AI Research Labs Dashboard in Excel
The AI Research Labs Dashboard in Excel includes several powerful features that make research analysis easy and effective.
Key Features
-
Interactive Excel dashboard
-
Multiple analytical pages
-
Pivot table-based charts
-
Dynamic slicers for filtering data
-
Real-time research performance analysis
-
Simple data input system
-
Visual charts and KPI indicators
Additionally, the dashboard includes five analytical pages that allow users to analyze research performance from different perspectives.
Structure of the AI Research Labs Dashboard
The dashboard contains five interactive pages in the Excel desktop application.
Each page focuses on a specific area of research performance analysis.
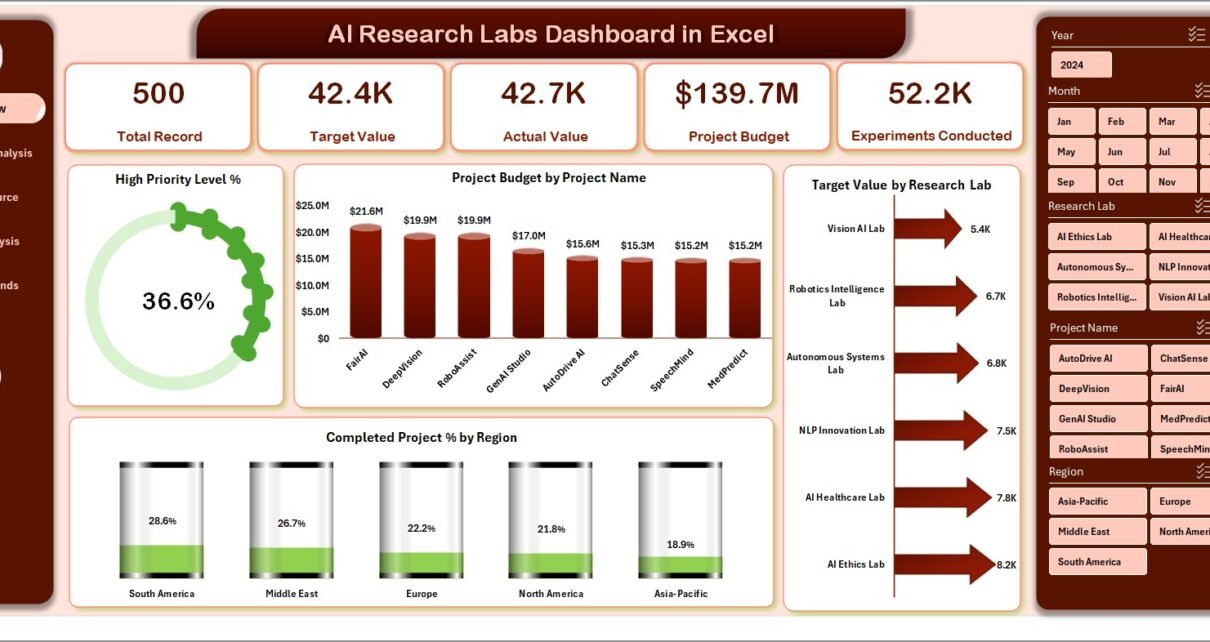
Overview Page – What Does the Main Dashboard Show?

The Overview Page provides a complete snapshot of the research lab’s performance.
This page allows managers to quickly understand how research projects perform across different areas.
KPI Cards on the Overview Page
The dashboard includes four KPI cards that display key metrics such as:
-
Project budget
-
Target values
-
High priority project percentage
-
Completed project percentage
These KPIs allow decision-makers to evaluate research performance instantly.
Charts on the Overview Page
The overview dashboard also includes four analytical charts:
-
High Priority Level %
-
Project Budget by Project Name
-
Target Value by Research Lab
-
Completed Project % by Region
These charts help research managers identify which projects require attention and which regions perform well.
Department Analysis – How Do Departments Perform?

AI research organizations often contain multiple departments such as:
-
Machine Learning
-
Natural Language Processing
-
Robotics
-
Computer Vision
-
Data Science
Therefore, understanding department performance becomes essential.
The Department Analysis Page helps managers evaluate how each department contributes to research activities.
Charts Available on the Department Analysis Page
This page includes four analytical charts:
-
Project Budget by Department
-
Target Value by Department
-
Total Record by Department
-
High Priority Level by Department
These charts allow research leaders to compare department performance and resource allocation.
As a result, organizations can optimize research productivity.
Funding Source Analysis – Where Does the Research Funding Come From?
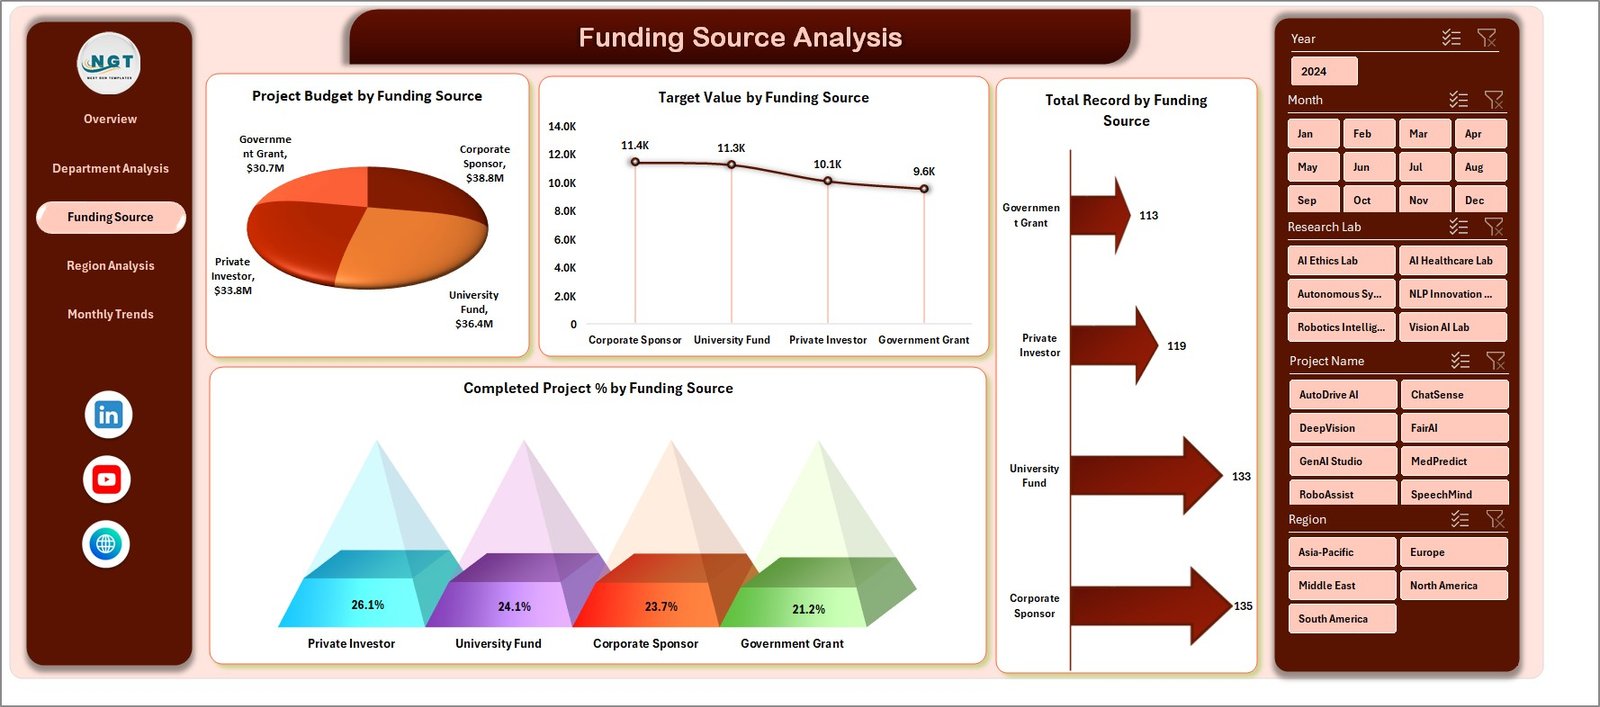
AI research projects often receive funding from multiple sources.
For example:
-
Government grants
-
Corporate partnerships
-
Private investors
-
Academic funding programs
-
International research organizations
Therefore, tracking funding sources becomes essential for financial transparency.
The Funding Source Analysis Page provides detailed insights into funding allocation.
Charts on the Funding Source Page
The page includes four charts:
-
Project Budget by Funding Source
-
Target Value by Funding Source
-
Total Record by Funding Source
-
Completed Project % by Funding Source
These charts help organizations evaluate which funding sources contribute most to research success.
Consequently, labs can improve funding strategies.
Click to Purchases AI Research Labs Dashboard in Excel
Region Analysis – How Does Research Performance Vary by Region?
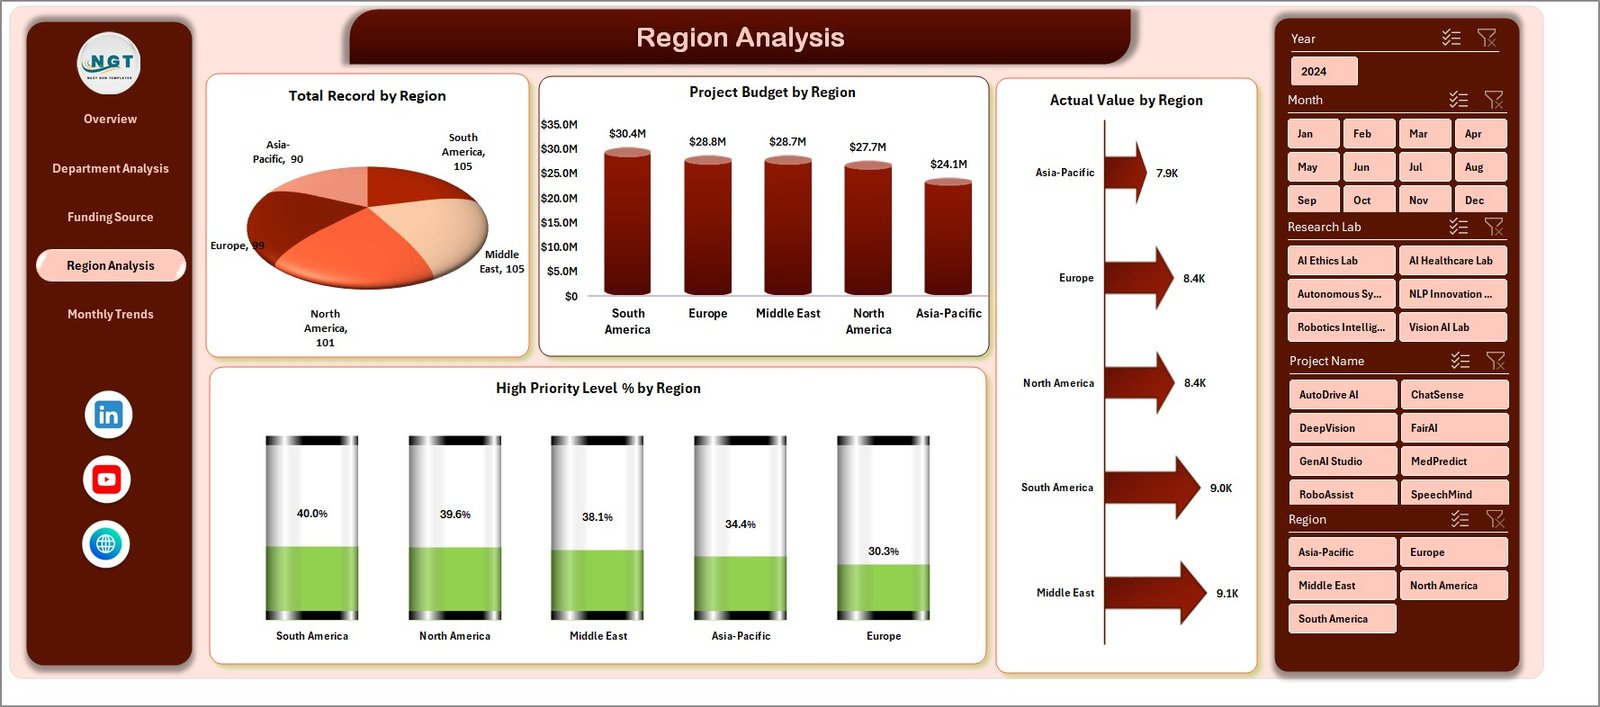
AI research organizations often operate across multiple regions or campuses.
Therefore, regional analysis helps research leaders identify performance differences.
The Region Analysis Page focuses on geographical research performance.
Charts on the Region Analysis Page
This page includes four charts:
-
Project Budget by Region
-
Total Record by Region
-
Actual Value by Region
-
High Priority Level % by Region
Using this analysis, research managers can identify which regions produce the most successful research projects.
Furthermore, they can allocate resources to underperforming regions.
Month Analysis – How Does Research Progress Over Time?

Tracking research performance over time helps organizations understand progress patterns.
Therefore, the Month Analysis Page provides time-based research insights.
Charts on the Month Analysis Page
This page includes three charts:
-
Project Budget by Month
-
Completed Project by Month
-
Total Record by Month
These charts help research managers analyze research productivity throughout the year.
As a result, they can identify seasonal trends in research output.
Support Sheet – Why Is It Important?
The Support Sheet works as a backend calculation sheet for the dashboard.
This sheet performs:
-
Pivot table calculations
-
Intermediate data aggregation
-
Chart data preparation
Because this sheet supports the entire dashboard structure, it ensures accurate calculations and smooth dashboard performance.
Data Sheet – The Foundation of the Dashboard
The Data Sheet acts as the main input source for the dashboard.
Users enter research data in this sheet.
Typical data columns may include:
-
Project ID
-
Project Name
-
Department
-
Research Lab
-
Region
-
Funding Source
-
Project Budget
-
Target Value
-
Actual Value
-
Priority Level
-
Project Status
-
Completion Percentage
-
Month
Once users update this sheet, the dashboard automatically updates through pivot tables and charts.
Advantages of AI Research Labs Dashboard in Excel
Click to Purchases AI Research Labs Dashboard in Excel
The AI Research Labs Dashboard in Excel offers many benefits for research organizations.
1. Centralized Research Monitoring
The dashboard allows organizations to track all research data in one place.
Therefore, managers no longer need multiple reports.
2. Better Decision-Making
Because the dashboard provides clear visual insights, leaders can make faster decisions.
Moreover, they can quickly identify problems and opportunities.
3. Improved Funding Management
Funding analysis helps organizations understand how research budgets are allocated.
As a result, labs can improve financial planning.
4. Easy Performance Tracking
Managers can track project progress, department performance, and completion rates easily.
Consequently, they can measure research productivity.
5. User-Friendly Interface
Excel dashboards are simple to use.
Therefore, research teams can update and analyze data without technical expertise.
Best Practices for the AI Research Labs Dashboard in Excel
Building an effective dashboard requires careful planning.
Follow these best practices to get the best results.
Use Structured Data
Always maintain structured tables in the data sheet.
This approach improves pivot table performance.
Update Data Regularly
Regular data updates ensure accurate analysis.
Therefore, schedule periodic data reviews.
Use Consistent Naming
Project names, departments, and funding sources should follow consistent naming formats.
This prevents data duplication.
Monitor High-Priority Projects
High-priority research projects require close monitoring.
Therefore, managers should review these projects frequently.
Use Clear Visualizations
Charts should remain simple and easy to interpret.
Avoid unnecessary complexity in dashboard visuals.
How Can Organizations Use This Dashboard Effectively?
Click to Purchases AI Research Labs Dashboard in Excel
Organizations can use the AI Research Labs Dashboard in several ways.
Research Management
Track research project progress and completion.
Budget Monitoring
Analyze how research budgets are distributed.
Performance Evaluation
Evaluate department and regional research productivity.
Strategic Planning
Identify research trends and opportunities.
Conclusion
Artificial Intelligence research labs operate in a highly dynamic environment where multiple projects, departments, and funding sources interact simultaneously. Therefore, organizations need efficient tools to monitor research performance and make informed decisions.
The AI Research Labs Dashboard in Excel provides a powerful solution that helps research managers track budgets, evaluate department performance, analyze funding sources, and monitor regional research activities.
Moreover, the dashboard converts complex research data into easy-to-understand visual insights through KPI cards, charts, and slicers.
As a result, research leaders gain a clear understanding of their research ecosystem and can improve decision-making.
By implementing this dashboard, organizations can enhance research productivity, improve financial transparency, and support innovation across their AI research initiatives.
Frequently Asked Questions (FAQs)
1. What is the AI Research Labs Dashboard in Excel?
The AI Research Labs Dashboard in Excel is an analytical Excel template that helps research organizations monitor project budgets, performance targets, and research progress.
2. Who can use this dashboard?
This dashboard is useful for:
-
AI research organizations
-
Universities and research institutes
-
Data science teams
-
Innovation labs
-
Technology companies
3. Does the dashboard require advanced Excel skills?
No. The dashboard uses pivot tables, slicers, and charts that are easy to use.
Therefore, basic Excel knowledge is enough to operate it.
4. Can the dashboard be customized?
Yes. Users can easily customize charts, filters, and KPIs according to their research requirements.
5. How often should research data be updated?
Organizations should update data regularly, such as weekly or monthly, to ensure accurate research performance analysis.
Visit our YouTube channel to learn step-by-step video tutorials