Corporate training plays a crucial role in modern organizations. Companies constantly invest in employee development, leadership training, compliance programs, and skill enhancement initiatives. However, training providers must measure their performance to ensure they deliver value to clients and maintain operational efficiency.
Therefore, organizations increasingly rely on data-driven dashboards to monitor key performance indicators (KPIs). One of the most effective tools for this purpose is the Corporate Training Providers KPI Dashboard in Excel.
The Corporate Training Providers KPI Dashboard in Excel helps training organizations track performance metrics, analyze training outcomes, monitor revenue growth, and evaluate operational efficiency. Moreover, the dashboard converts complex training data into easy-to-understand visual insights.
Because Excel provides powerful tools such as Pivot Tables, charts, slicers, conditional formatting, and formulas, training providers can quickly transform raw training data into actionable insights.
In this comprehensive guide, you will learn everything about the Corporate Training Providers KPI Dashboard in Excel, including its structure, benefits, key features, and best practices.
Click to buy Corporate Training Providers KPI Dashboard in Excel
What is a Corporate Training Providers KPI Dashboard in Excel?
A Corporate Training Providers KPI Dashboard in Excel is a performance monitoring tool that tracks key metrics related to corporate training programs. It helps training companies evaluate training effectiveness, monitor instructor performance, measure participant engagement, and track financial results.
Instead of relying on scattered spreadsheets and manual reports, training managers can monitor all critical metrics in one centralized dashboard.
With this dashboard, training providers can easily answer important questions such as:
- How many training sessions did we conduct this month?
- What is the average training completion rate?
- How satisfied are participants with our training programs?
- How much revenue did each training program generate?
- Which training category performs the best?
Therefore, the dashboard helps organizations make data-driven decisions while improving training quality and operational performance.
Why Do Corporate Training Providers Need a KPI Dashboard?
Corporate training organizations operate in a highly competitive environment. Companies expect measurable results from training programs. Therefore, training providers must track performance carefully.
However, manual reporting often creates several challenges:
- Data becomes scattered across multiple spreadsheets
- Performance metrics remain difficult to analyze
- Decision-making becomes slow
- Training effectiveness remains unclear
Because of these challenges, organizations increasingly adopt Excel-based KPI dashboards.
A KPI dashboard allows training providers to:
- Track training performance in real time
- Measure training outcomes accurately
- Monitor financial performance
- Identify underperforming programs
- Improve strategic decision-making
As a result, training organizations can increase efficiency, improve client satisfaction, and grow their business.
Key Features of the Corporate Training Providers KPI Dashboard in Excel
The Corporate Training Providers KPI Dashboard in Excel includes multiple worksheets designed to track and analyze training performance effectively.
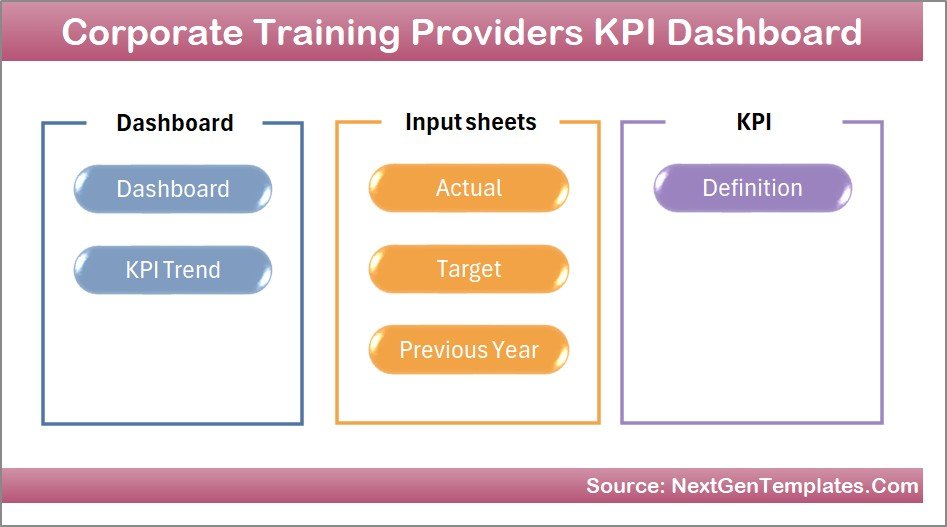
The dashboard consists of 7 structured worksheets.
Summary Page – The Navigation Hub
The Summary Page acts as the index sheet of the dashboard.
This page contains six navigation buttons that allow users to jump directly to specific worksheets. Therefore, users can quickly navigate across different sections of the dashboard without scrolling through multiple sheets.
Key advantages of the Summary Page include:
- Easy navigation
- Organized dashboard structure
- Quick access to analysis pages
- Improved user experience
Because of this structure, even beginners can easily use the dashboard.
Click to buy Corporate Training Providers KPI Dashboard in Excel
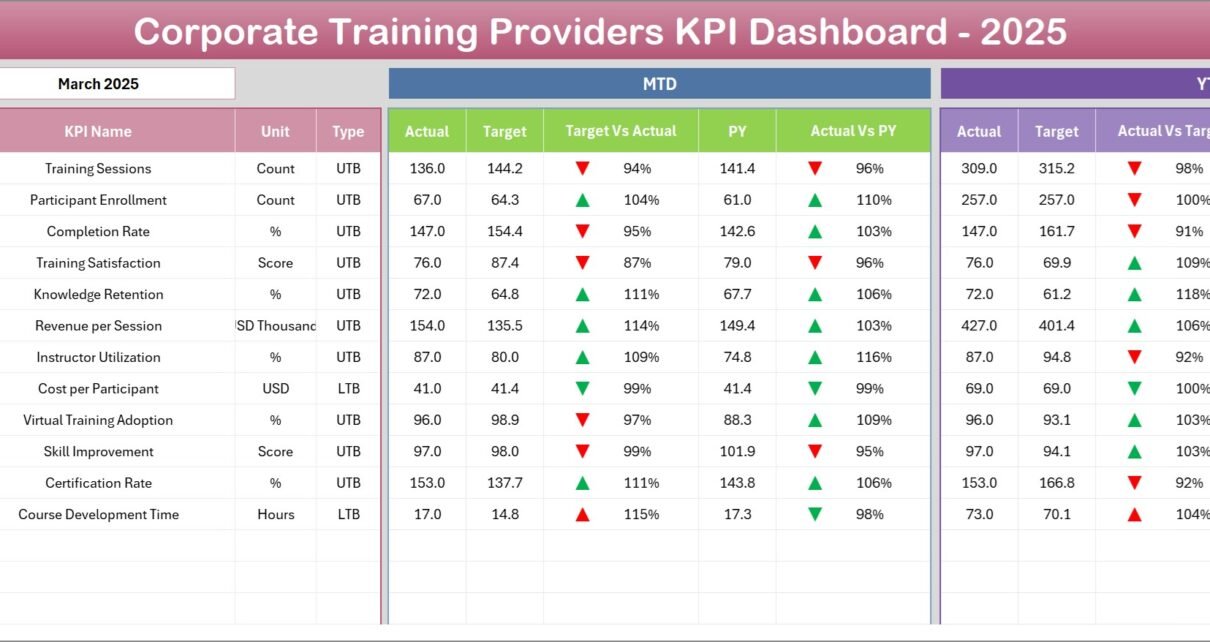
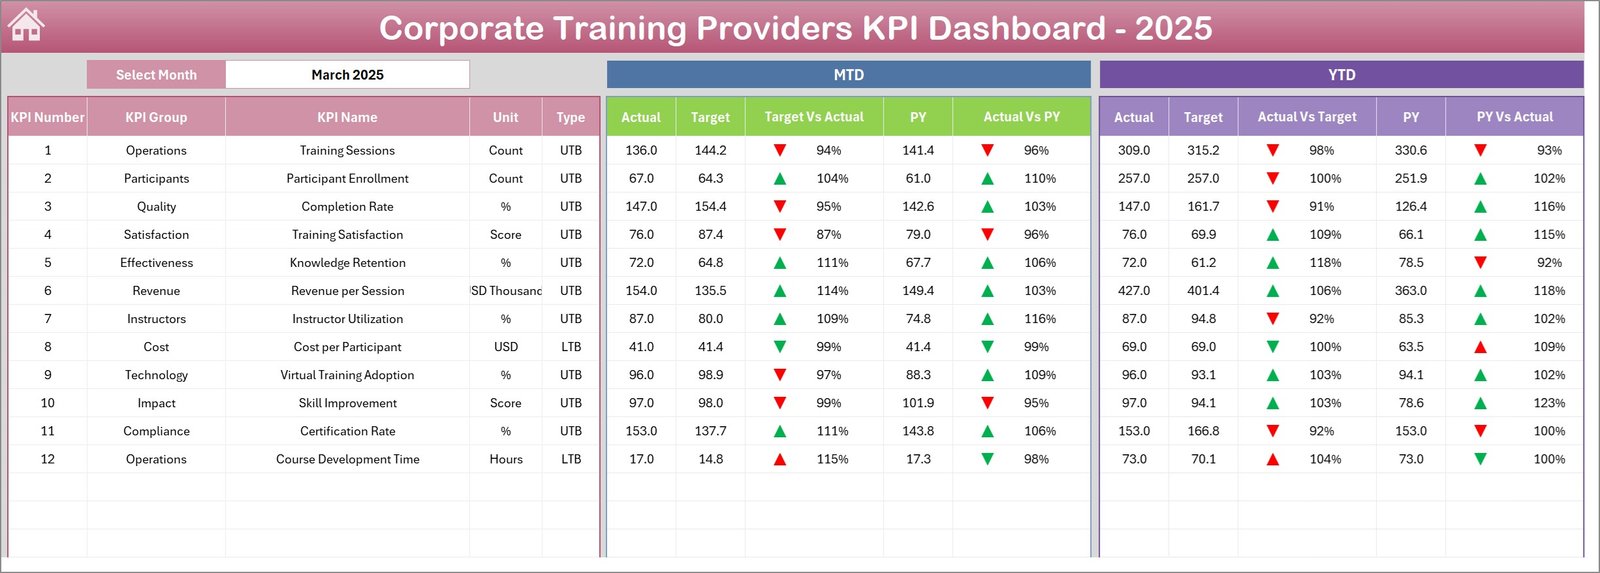
Dashboard Sheet – The Main Performance Overview
The Dashboard sheet serves as the central reporting page.
Here, users can view the performance of all KPIs in a single screen.
Interactive Month Selection
The dashboard includes a Month selection dropdown in cell D3. When users select a specific month, the entire dashboard automatically updates the performance numbers.
Therefore, users can quickly analyze monthly training performance.
KPI Metrics Displayed
The dashboard displays several key metrics including:
- MTD Actual (Month-To-Date performance)
- MTD Target
- Previous Year Data
- Target vs Actual comparison
- Previous Year vs Actual comparison
Additionally, conditional formatting shows up and down arrows that indicate KPI performance trends.
YTD Analysis
In addition to monthly metrics, the dashboard also displays Year-To-Date (YTD) performance.
This section includes:
- YTD Actual
- YTD Target
- YTD Previous Year
- Target vs Actual comparison
- Previous Year vs Actual comparison
Therefore, decision-makers can easily analyze both short-term and long-term performance trends.
Click to buy Corporate Training Providers KPI Dashboard in Excel
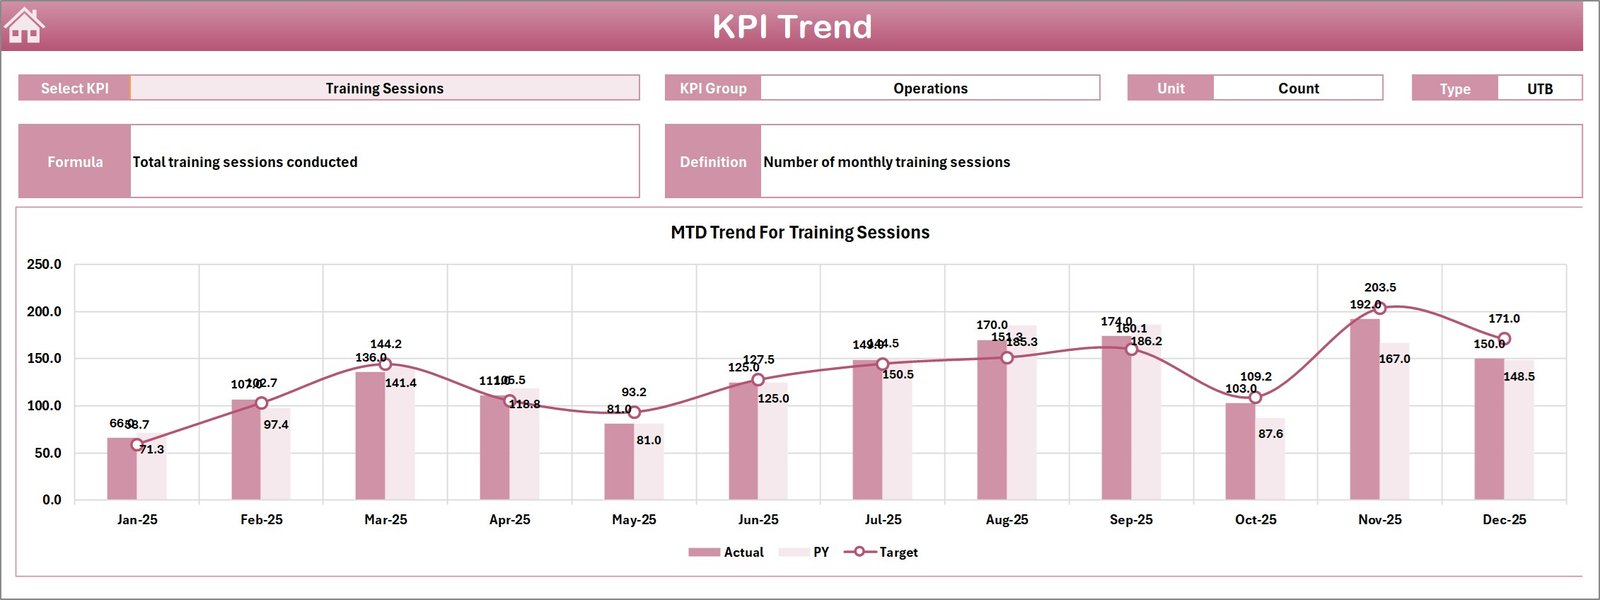
Trend Sheet – KPI Performance Trends
The Trend Sheet helps users analyze the performance trend of individual KPIs.
Users can select a KPI name from the dropdown menu in cell C3.
Once selected, the dashboard automatically displays:
- KPI Group
- KPI Unit
- KPI Type (Higher is Better or Lower is Better)
- KPI Formula
- KPI Definition
Additionally, the sheet displays trend charts for both MTD and YTD performance.
The charts compare three important values:
- Actual values
- Target values
- Previous Year values
Because of this visual representation, managers can easily identify performance trends.
Click to buy Corporate Training Providers KPI Dashboard in Excel
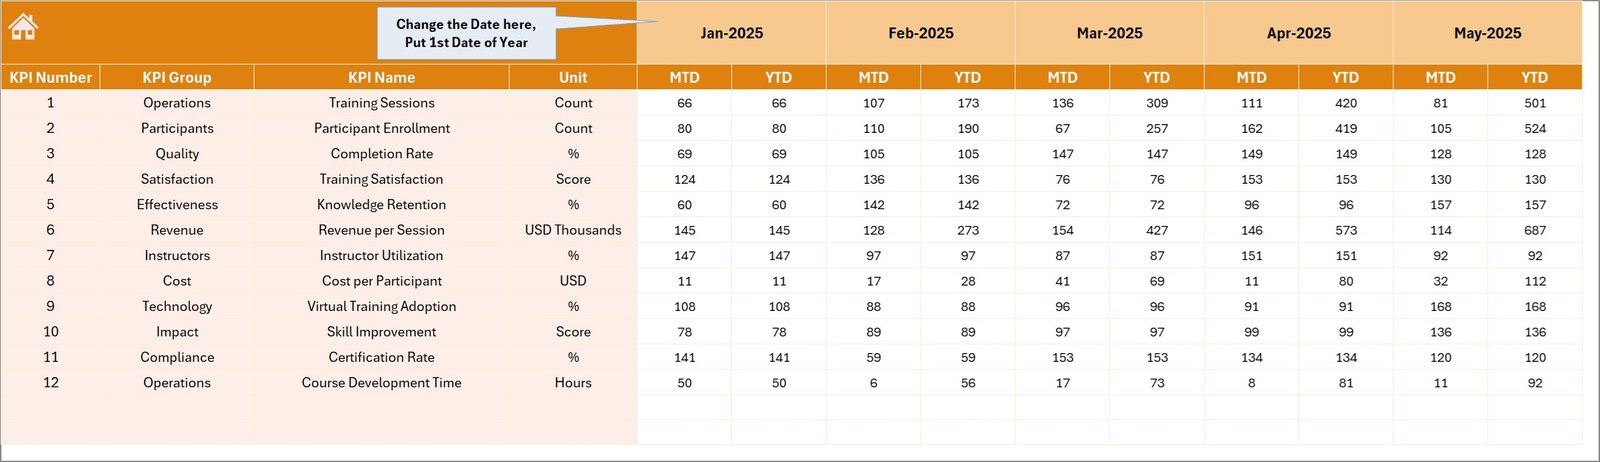
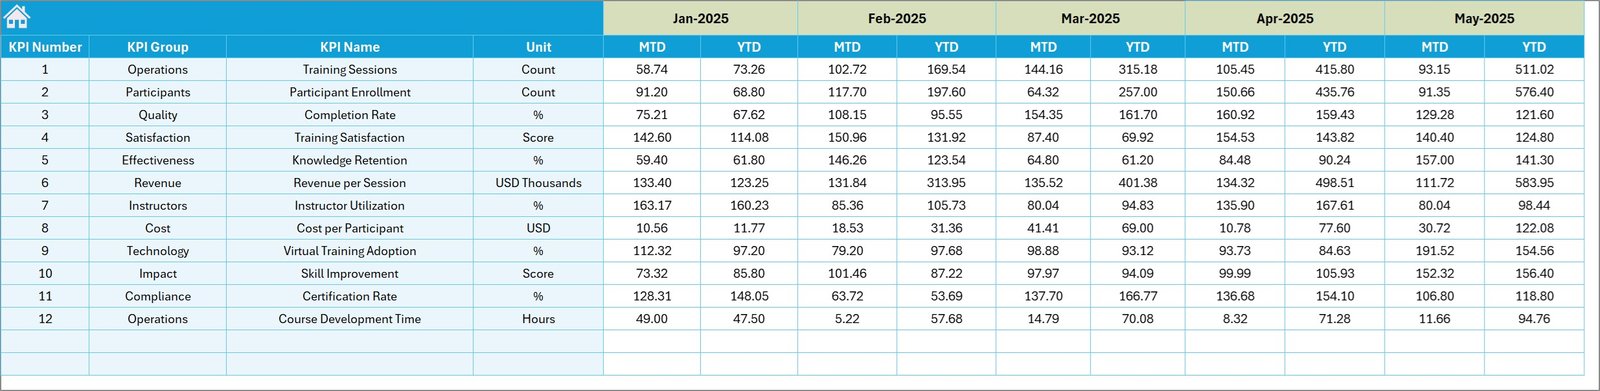
Actual Numbers Input Sheet
The Actual Numbers Input Sheet allows users to enter the actual KPI performance data.
Users must input MTD and YTD values for each KPI.
Flexible Month Configuration
Users can set the starting month of the year using cell E1.
After setting the starting month, the dashboard automatically adjusts all calculations.
This flexible setup allows organizations to use the dashboard for any fiscal year.
Click to buy Corporate Training Providers KPI Dashboard in Excel
Target Sheet – Performance Goals
The Target Sheet stores the target values for each KPI.
Training providers can define:
- Monthly targets (MTD)
- Yearly targets (YTD)
These targets allow organizations to compare actual performance against planned goals.
As a result, managers can identify performance gaps quickly.
Click to buy Corporate Training Providers KPI Dashboard in Excel
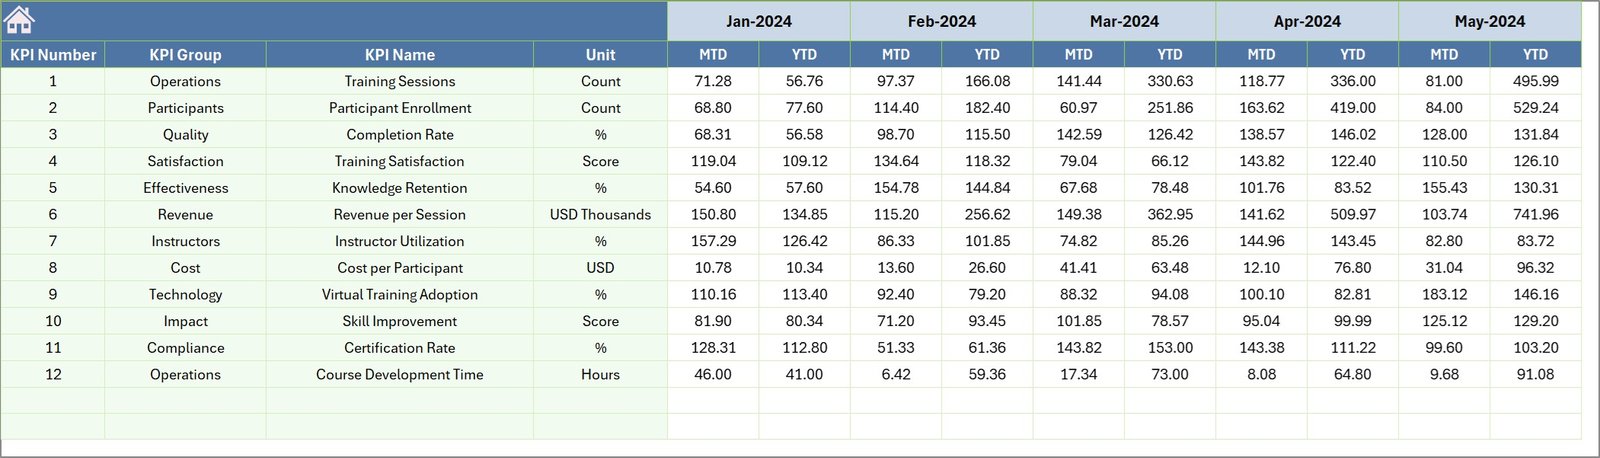
Previous Year Numbers Sheet
The Previous Year Sheet contains historical data from the previous year.
Training providers can enter KPI numbers for the same months as the current year.
This comparison allows organizations to analyze:
- Year-over-year growth
- Performance improvements
- Training demand changes
Therefore, decision-makers gain deeper insights into business trends.
Click to buy Corporate Training Providers KPI Dashboard in Excel
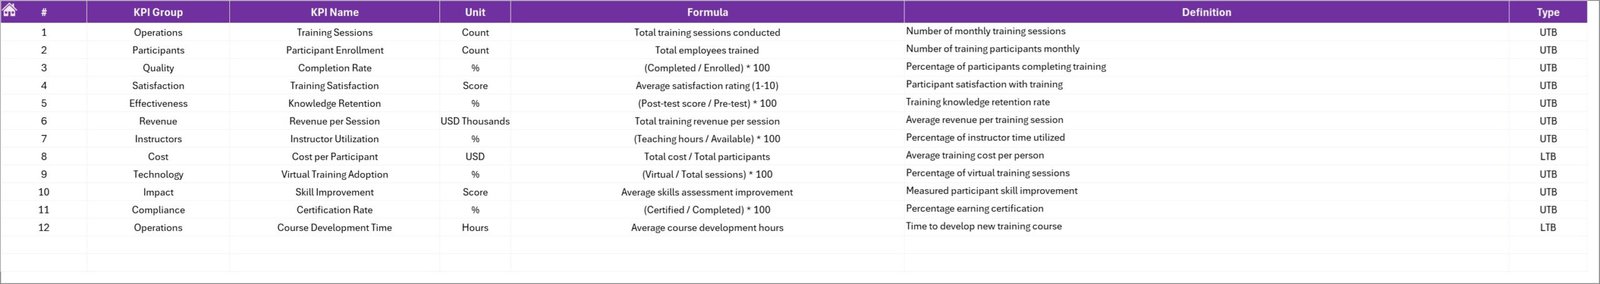
KPI Definition Sheet
The KPI Definition Sheet acts as the central database of KPI information.
In this sheet, users define:
- KPI Name
- KPI Group
- KPI Unit
- KPI Formula
- KPI Definition
This structure ensures consistency across the dashboard.
Additionally, new KPIs can easily be added without modifying the dashboard structure.
Advantages of Corporate Training Providers KPI Dashboard in Excel
Using a KPI dashboard provides many benefits for training organizations.
- Centralized Performance Monitoring
The dashboard consolidates all KPI data into one platform. Therefore, managers can track performance quickly without searching multiple reports.
- Improved Decision-Making
The dashboard presents clear visual insights. Consequently, leaders can make faster and better decisions.
- Better Training Program Evaluation
Organizations can evaluate training programs using real performance metrics.
- Time-Saving Reporting
Instead of preparing manual reports, managers can use automated dashboards.
- Increased Transparency
All stakeholders can easily understand training performance metrics.
- Year-over-Year Comparison
Historical data helps organizations measure progress and identify long-term trends.
Opportunities for Improvement in Training KPI Tracking
Even though KPI dashboards provide powerful insights, organizations must continuously improve their tracking systems.
Some opportunities for improvement include:
- Integrating learning management systems (LMS)
- Automating data collection
- Adding real-time data refresh
- Tracking training ROI
- Including participant satisfaction scores
- Monitoring instructor performance metrics
By improving KPI tracking, training providers can deliver better training outcomes.
Best Practices for the Corporate Training Providers KPI Dashboard in Excel
Organizations should follow several best practices when implementing KPI dashboards.
Define Clear KPIs
First, organizations should identify the most important KPIs such as:
- Training completion rate
- Participant satisfaction score
- Training revenue
- Instructor utilization rate
- Training attendance rate
Maintain Data Accuracy
Always ensure that the input data remains accurate and consistent.
Update Data Regularly
Update KPI data regularly to maintain reliable reporting.
Use Visual Indicators
Use conditional formatting and charts to highlight performance trends.
Focus on Actionable Insights
The dashboard should help managers take action instead of only displaying numbers.
Train Users
Provide proper training to employees who use the dashboard.
How Does Excel Make KPI Dashboards Powerful?
Excel remains one of the most widely used tools for performance tracking.
Excel offers several powerful features that make dashboards effective.
Pivot Tables
Pivot tables allow users to summarize large datasets quickly.
Charts and Graphs
Charts help visualize KPI performance trends.
Conditional Formatting
Conditional formatting highlights important insights automatically.
Formulas and Functions
Excel formulas help automate calculations.
Data Validation
Dropdown menus allow users to interact with the dashboard easily.
Because of these capabilities, Excel remains a powerful tool for KPI dashboards.
Who Can Use the Corporate Training Providers KPI Dashboard?
This dashboard benefits many professionals in the training industry.
These include:
- Corporate training providers
- HR development teams
- Learning and development managers
- Training consultants
- HR analytics teams
- Professional development organizations
Therefore, any organization that provides training services can benefit from this dashboard.
Conclusion
Corporate training providers must track performance carefully to deliver high-quality learning experiences. However, manual reports often fail to provide meaningful insights.
The Corporate Training Providers KPI Dashboard in Excel solves this challenge by transforming training data into clear visual insights. Moreover, the dashboard helps organizations monitor training performance, track targets, compare historical results, and improve decision-making.
Because the dashboard includes multiple worksheets, trend charts, KPI definitions, and interactive filters, users can easily analyze training performance across different metrics.
Therefore, organizations that adopt KPI dashboards can improve operational efficiency, enhance training outcomes, and achieve long-term growth.
Frequently Asked Questions (FAQs)
What is a KPI dashboard for training providers?
A KPI dashboard for training providers tracks important metrics related to training programs, such as attendance, completion rates, revenue, and participant satisfaction.
Why should training companies use Excel dashboards?
Excel dashboards provide visual insights, automate calculations, and allow organizations to monitor performance effectively.
What KPIs should training providers track?
Training providers commonly track KPIs such as training completion rate, participant satisfaction score, training revenue, instructor utilization, and training attendance rate.
Can beginners use this dashboard?
Yes. Because the dashboard includes a structured layout and dropdown selections, beginners can easily use it.
How often should organizations update KPI dashboards?
Organizations should update KPI dashboards regularly, preferably monthly or weekly, depending on reporting requirements.
Click to buy Corporate Training Providers KPI Dashboard in Excel
Visit our YouTube channel to learn step-by-step video tutorials
Watch the step-by-step video tutorial: