The antique market has always fascinated collectors, historians, interior designers, and investors. Rare furniture, vintage jewelry, historical artifacts, and collectible art pieces hold both cultural and financial value. However, managing an antique dealership involves far more than simply buying and selling unique items.
Antique dealers must constantly track inventory, analyze sales performance, evaluate dealer productivity, and understand buyer behavior. Without a structured data system, it becomes extremely difficult to monitor profitability, inventory turnover, and sales trends.
Therefore, antique businesses increasingly rely on data-driven dashboards to simplify operations and improve decision-making.
One powerful solution is the Antique Dealers Dashboard in Excel. This ready-to-use Excel dashboard helps antique dealers track inventory performance, analyze sales trends, monitor dealer productivity, and understand buyer behavior through interactive charts and slicers.
Click to Purchases Antique Dealers Dashboard in Excel
Moreover, Excel dashboards make it easy to convert complex data into clear visual insights. As a result, dealers can identify profitable categories, manage inventory efficiently, and increase revenue.
In this comprehensive guide, we will explore the Antique Dealers Dashboard in Excel, including its structure, features, advantages, and best practices.
What is an Antique Dealers Dashboard in Excel?
An Antique Dealers Dashboard in Excel is a data visualization and analytics tool designed to monitor antique business performance using interactive charts, filters, and performance metrics.
It allows antique dealers to track important business indicators such as:
-
Total antique sales
-
Profit margin
-
Inventory turnover
-
Dealer performance
-
Buyer insights
-
Monthly sales trends
-
High-value item performance
Because Excel automatically updates charts when new data is added, users can monitor performance in real time.
As a result, antique dealers can quickly evaluate which items sell faster, which dealers perform best, and which buyer segments generate the highest revenue.
Why Do Antique Dealers Need a Dashboard?
Running an antique dealership involves multiple activities. Dealers purchase items from auctions, collectors, estate sales, and vintage markets. Afterwards, they authenticate items, store them in inventory, and sell them to collectors, interior designers, or museums.
However, without proper analytics, dealers face several challenges.
For example:
-
Inventory may stay unsold for months.
-
Some dealers may perform better than others.
-
Certain categories may generate higher profits.
-
High-value items may remain unnoticed.
Therefore, businesses need a system that can organize and analyze all operational data.
An Excel dashboard solves these problems by transforming raw data into meaningful insights.
Consequently, antique dealers can make smarter business decisions.
Key Features of the Antique Dealers Dashboard in Excel
The Antique Dealers Dashboard in Excel includes multiple analytical pages designed to track different aspects of the business.
Additionally, a page navigator located on the left side allows users to easily move between pages.
The dashboard contains five main analytical pages.
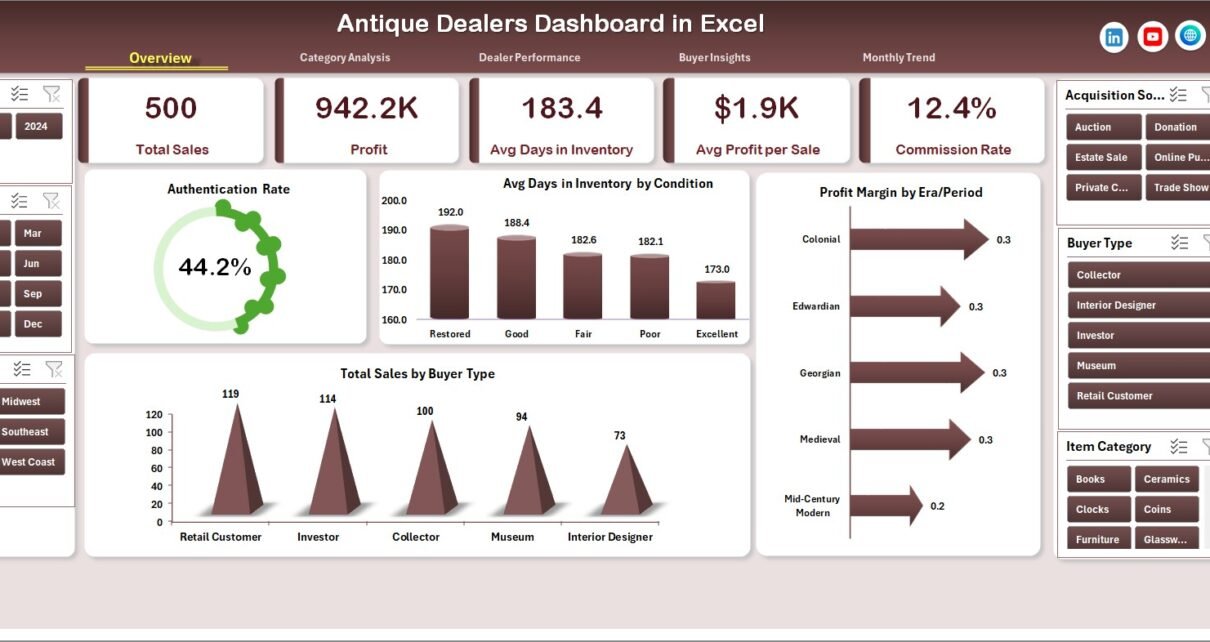
1. Overview Page – What Is Happening in the Business?
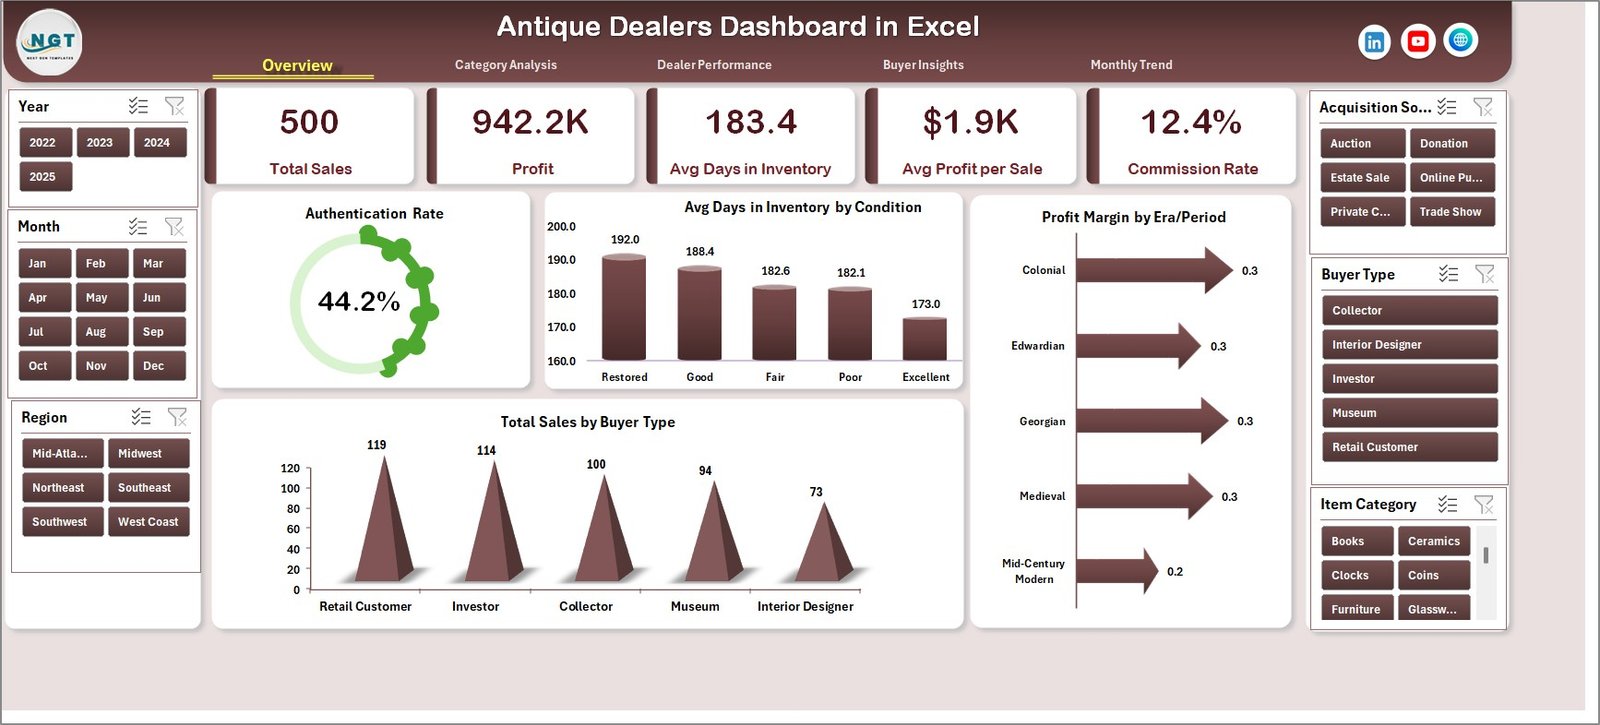
The Overview Page acts as the main dashboard where users can quickly evaluate overall performance.
A slicer located on the right side allows users to filter data dynamically.
The page includes four KPI cards and four visual charts that highlight key metrics.
Key Metrics and Charts
• Authentication Rate %
Shows the percentage of antique items that passed authentication checks.
• Average Days in Inventory by Condition
Displays how long items remain in inventory depending on their condition.
• Profit Margin by Era Period
Analyzes which historical periods generate the highest profit margins.
• Total Sales by Buyer Type
Identifies which buyer categories generate the most revenue.
Because this page summarizes the most important metrics, managers can instantly understand business performance.
2. Category Analysis – Which Antique Categories Perform Best?
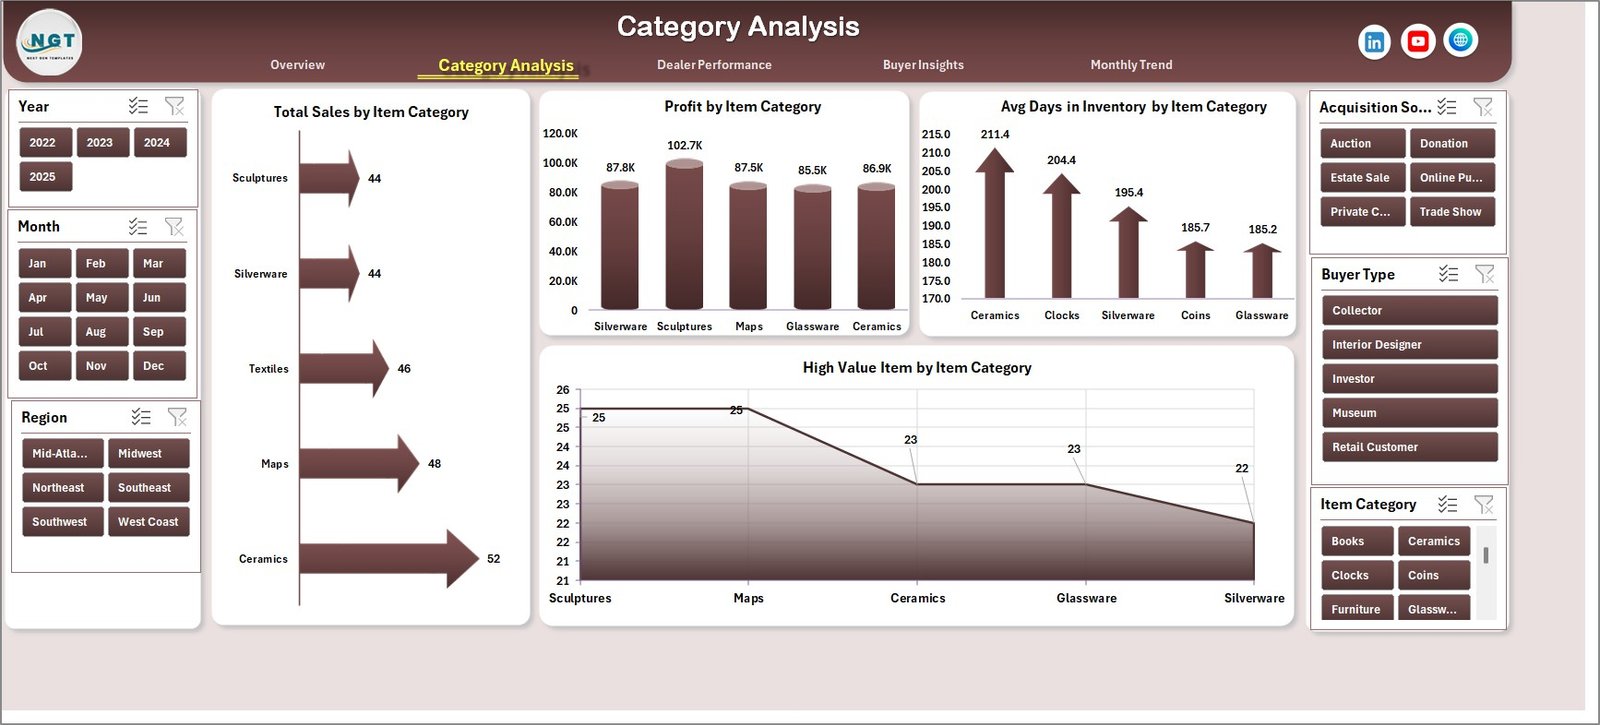
The Category Analysis page provides deeper insights into product categories and sales trends.
A slicer on the right side enables users to filter data based on different dimensions.
Charts Available on this Page
• Total Net Revenue vs Gross Sales by City
Compares revenue performance across different cities.
• Total Net Revenue by Category Type
Shows which antique categories generate the highest revenue.
• Average Revenue per Sale by Category
Helps identify the most profitable product categories.
• Total Net Revenue by Month
Tracks revenue trends across months.
Because this analysis reveals category performance, dealers can focus on the most profitable antique segments.
Click to Purchases Antique Dealers Dashboard in Excel
3. Dealer Performance – Which Dealers Drive the Most Sales?
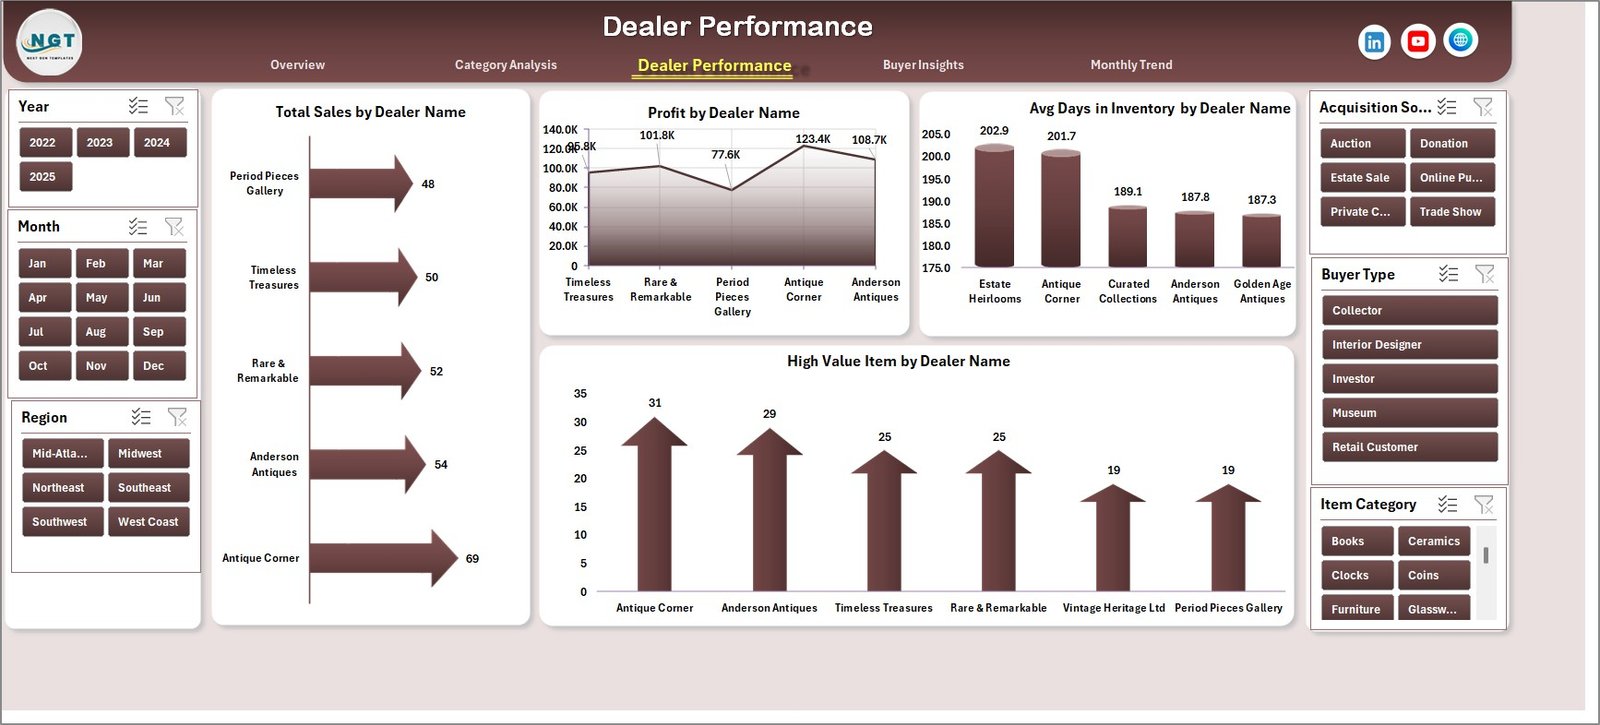
Antique businesses often work with multiple dealers, collectors, and agents. Therefore, monitoring dealer productivity becomes essential.
The Dealer Performance Page helps businesses evaluate individual dealer contributions.
Charts on This Page
• Total Sales by Dealer Name
Displays the revenue generated by each dealer.
• Profit by Dealer Name
Highlights the most profitable dealers.
• Average Days in Inventory by Dealer
Shows how efficiently dealers move inventory.
• High-Value Item Sales by Dealer
Identifies which dealers sell premium antiques.
Consequently, businesses can reward high-performing dealers and support those who need improvement.
4. Buyer Insights – Who Are the Customers?
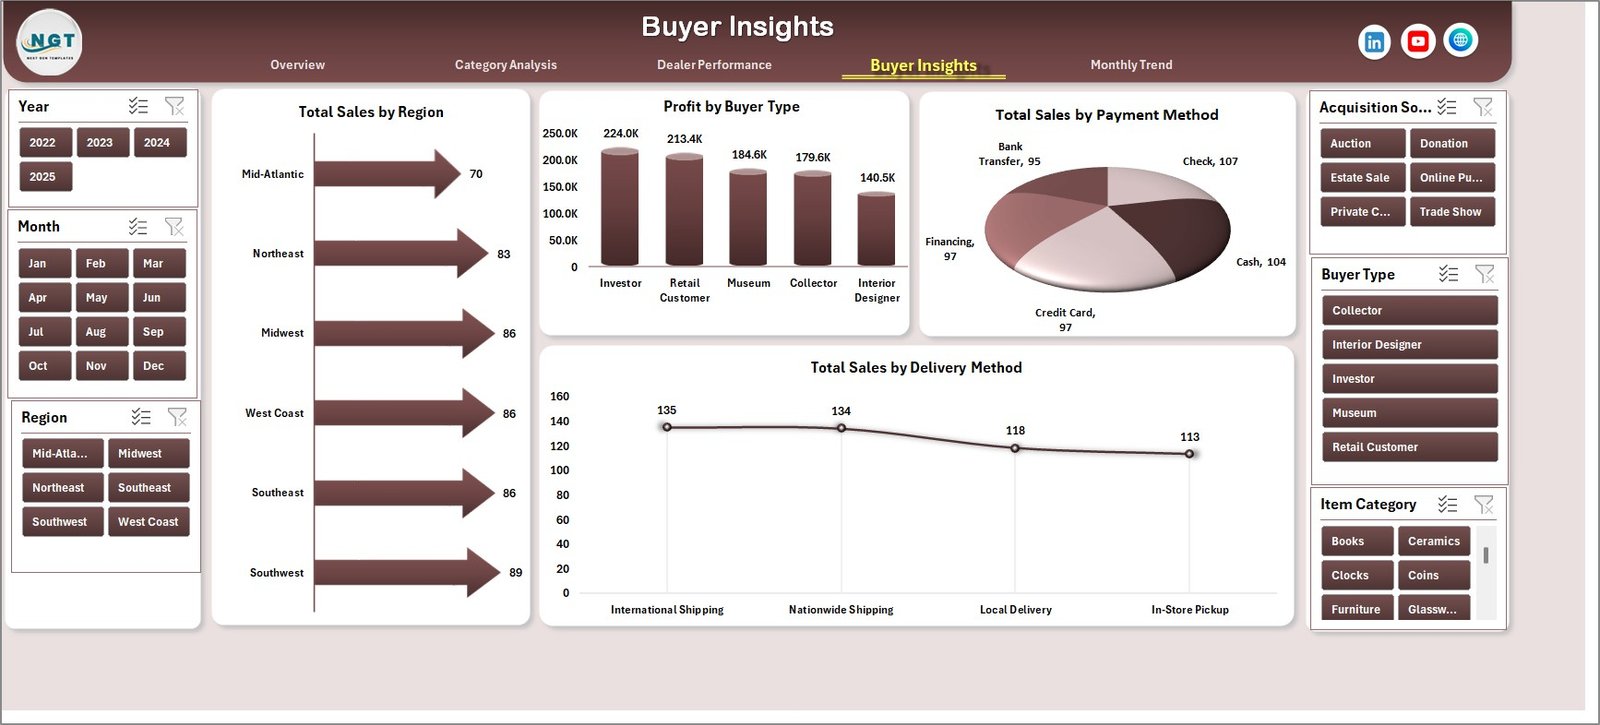
Understanding customer behavior helps antique dealers develop better sales strategies.
The Buyer Insights Page analyzes different buyer segments and purchasing patterns.
Charts Available
• Total Sales by Region
Shows geographic demand for antiques.
• Profit by Buyer Type
Compares profits generated by collectors, retailers, and museums.
• Total Sales by Payment Method
Analyzes payment preferences.
• Total Sales by Delivery Method
Tracks delivery trends such as shipping or pickup.
Because these insights highlight buyer behavior, businesses can improve marketing strategies and customer engagement.
5. Month Analysis – How Does Sales Change Over Time?
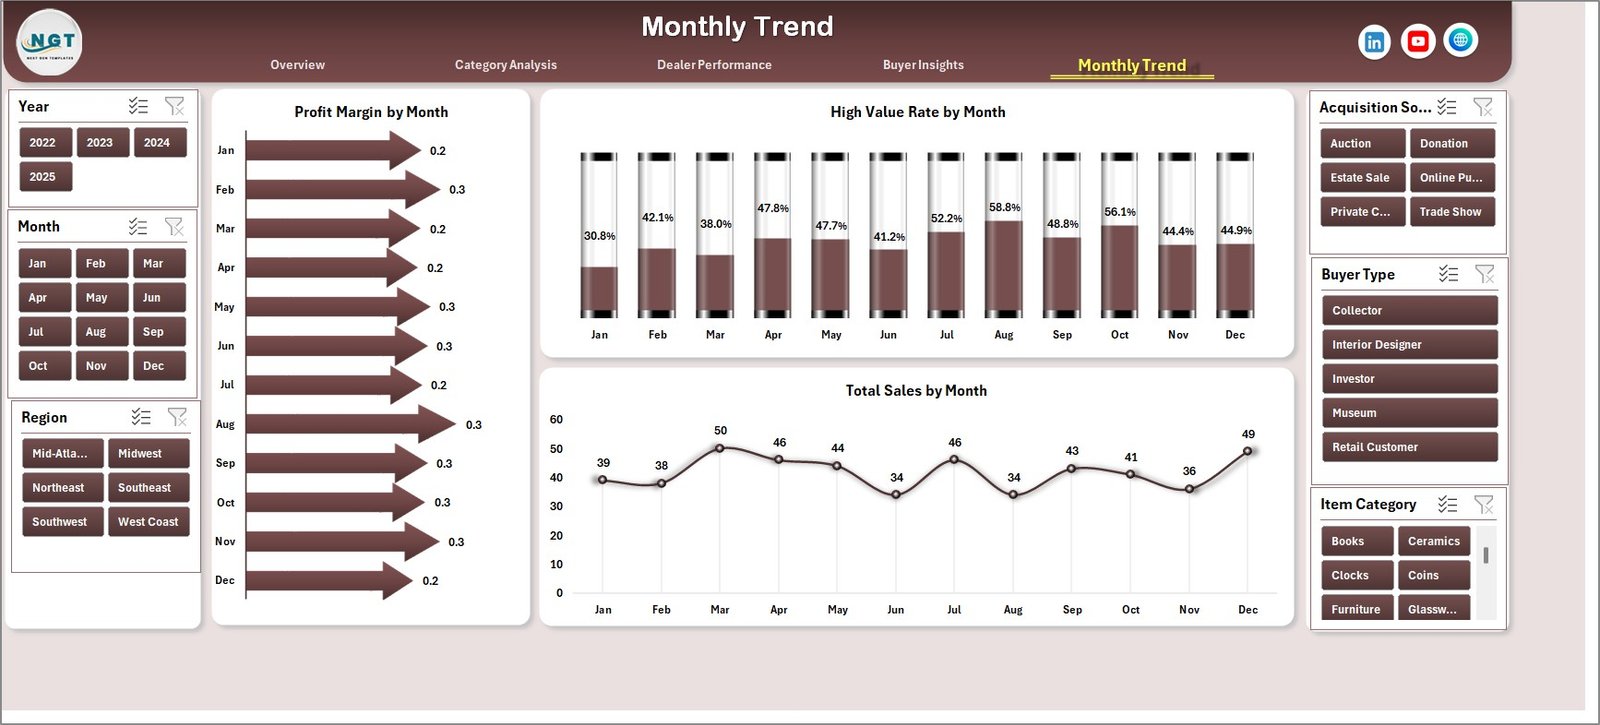
Sales performance often changes throughout the year. Therefore, businesses must analyze seasonal trends.
The Month Analysis Page provides time-based performance insights.
Charts Included
• Profit Margin % by Month
• High-Value Item Rate by Month
• Total Sales by Month
This analysis helps businesses plan inventory purchases and promotional strategies.
Click to Purchases Antique Dealers Dashboard in Excel
What Supporting Sheets Are Included?
The dashboard also includes supporting worksheets that power the entire analysis.
Support Sheet
The Support Sheet stores lookup tables, category lists, and calculation references used by the dashboard.
It helps maintain structured data and ensures accurate calculations.
Data Sheet
The Data Sheet acts as the primary database.
It contains all transaction records such as:
-
Antique ID
-
Item name
-
Category
-
Era period
-
Dealer name
-
Buyer type
-
Sales amount
-
Profit
-
Inventory days
-
Payment method
-
Delivery method
-
Condition
-
City
-
Region
-
Date
Because the dashboard pulls data directly from this sheet, users can simply update the data to refresh all charts.
Advantages of the Antique Dealers Dashboard in Excel
An Excel dashboard provides numerous benefits for antique businesses.
1. Better Business Visibility
The dashboard organizes complex data into easy-to-understand charts. Therefore, managers can quickly understand performance.
2. Improved Inventory Management
Dealers can track how long items remain in inventory. As a result, they can adjust pricing or promotions.
3. Faster Decision-Making
Instead of reviewing multiple spreadsheets, managers can analyze all information in one place.
4. Higher Profitability
The dashboard highlights profitable categories and high-value items. Consequently, businesses can focus on the most profitable antiques.
5. Dealer Performance Tracking
Businesses can identify top-performing dealers and motivate them with incentives.
6. Customer Insights
Understanding buyer behavior allows businesses to target marketing campaigns effectively.
Who Can Benefit from This Dashboard?
Many professionals in the antique industry can use this dashboard.
For example:
-
Antique dealers
-
Auction houses
-
Vintage store owners
-
Collectors
-
Antique market analysts
-
Art galleries
-
Estate sale managers
-
Interior designers sourcing vintage pieces
Because the dashboard organizes business data clearly, it helps both small and large antique businesses.
Best Practices for Using the Antique Dealers Dashboard
Click to Purchases Antique Dealers Dashboard in Excel
To get the maximum value from the dashboard, businesses should follow several best practices.
Maintain Clean Data
Always keep the data sheet accurate and updated. Clean data ensures reliable insights.
Update Data Regularly
Add new sales records regularly so the dashboard reflects current performance.
Use Filters for Analysis
The dashboard includes slicers. Use them to analyze different categories, dealers, and buyer types.
Track Inventory Turnover
Monitor how long items stay in inventory. Slow-moving inventory may require promotional strategies.
Analyze Monthly Trends
Study monthly sales patterns to plan inventory purchases and marketing campaigns.
Focus on High-Value Items
Track which items generate the highest profit margins. Prioritize acquiring similar items.
How Does Excel Make Dashboard Analysis Powerful?
Excel offers several features that make dashboards extremely powerful.
For example:
-
Pivot Tables
-
Pivot Charts
-
Slicers
-
Conditional Formatting
-
Dynamic Formulas
-
Data Validation
-
Interactive Visualizations
Because these tools automate calculations and visualization, Excel dashboards provide professional analytics without expensive software.
Future Opportunities for Antique Dealers Using Data
The antique market continues to grow globally. As online marketplaces expand, dealers must rely on data analytics to stay competitive.
Therefore, dashboards will play a critical role in:
-
Predicting antique demand
-
Tracking global buyer trends
-
Managing international shipments
-
Monitoring online marketplace performance
-
Evaluating auction house performance
Consequently, data-driven antique businesses will outperform competitors.
Conclusion
Managing an antique dealership involves many moving parts. Dealers must track inventory, analyze sales trends, monitor dealer performance, and understand buyer behavior.
Without a structured analytics system, these tasks quickly become overwhelming.
The Antique Dealers Dashboard in Excel provides a powerful yet simple solution. It organizes antique business data into interactive charts and performance metrics that help dealers make smarter decisions.
With features such as Overview analytics, category insights, dealer performance tracking, buyer analysis, and monthly trend monitoring, this dashboard offers complete visibility into antique business operations.
Therefore, antique dealers who adopt data-driven dashboards can improve inventory management, increase profitability, and grow their business effectively.
Frequently Asked Questions (FAQs)
Click to Purchases Antique Dealers Dashboard in Excel
What is an Antique Dealers Dashboard?
An Antique Dealers Dashboard is a data analytics tool that tracks antique sales, inventory performance, dealer productivity, and buyer insights using visual charts and metrics.
Why should antique dealers use Excel dashboards?
Excel dashboards help antique dealers analyze business data quickly, monitor performance, and make informed decisions.
Can small antique businesses use this dashboard?
Yes. Small antique shops, individual dealers, and collectors can easily use this dashboard because Excel is simple and widely available.
What type of data is required for this dashboard?
The dashboard requires sales and inventory data such as item category, dealer name, buyer type, revenue, profit, payment method, and sale date.
How often should the dashboard be updated?
Businesses should update the dashboard whenever new sales occur. Regular updates ensure accurate insights.
Can the dashboard track high-value antique items?
Yes. The dashboard includes charts that analyze high-value item performance, helping dealers identify premium products.
Is Excel suitable for antique business analytics?
Yes. Excel provides powerful tools like pivot tables, charts, and slicers, which make it ideal for business analytics dashboards.
Visit our YouTube channel to learn step-by-step video tutorials