The antique business operates in a unique market where historical value, rarity, and collector demand determine pricing and profitability. Antique dealers handle a wide range of items such as vintage furniture, rare paintings, collectibles, coins, jewelry, and historical artifacts. However, managing antique inventory and sales becomes complex when dealers rely only on spreadsheets and manual tracking.
Therefore, antique dealers increasingly use business intelligence tools like Microsoft Power BI to analyze sales performance, track inventory movement, and understand buyer behavior.
Click to Purchases Antique Dealers Dashboard in Power BI
An Antique Dealers Dashboard in Power BI helps dealers transform raw business data into interactive visual insights. As a result, antique shop owners, collectors, and dealers can easily monitor sales trends, inventory aging, dealer performance, and buyer preferences.
Moreover, this dashboard consolidates important antique business metrics into one centralized analytics platform. Consequently, decision-makers can identify profitable antique categories, optimize inventory turnover, and improve sales strategies.
In this comprehensive guide, we will explore everything about the Antique Dealers Dashboard in Power BI, including its features, structure, advantages, best practices, and frequently asked questions.
What Is an Antique Dealers Dashboard in Power BI?
An Antique Dealers Dashboard in Power BI is an interactive analytics solution that helps antique dealers monitor inventory, evaluate dealer performance, track buyer trends, and analyze sales data.
Instead of reviewing multiple spreadsheets, users can view important metrics in one dashboard.
For example, the dashboard may track:
-
Total antique sales
-
Average days items stay in inventory
-
Sales by historical era
-
Buyer category trends
-
Dealer performance
-
Item category sales performance
-
Monthly revenue patterns
Therefore, antique dealers gain clear insights into how their business performs.
Furthermore, Power BI dashboards provide dynamic filters, charts, and slicers. As a result, users can quickly analyze data based on time period, category, dealer, or buyer type.
Why Do Antique Dealers Need a Power BI Dashboard?
Many antique businesses manage inventory manually. However, this approach often creates several challenges.
For example:
-
Dealers struggle to track which items sell faster.
-
Inventory may remain unsold for long periods.
-
Sales performance across dealers becomes unclear.
-
Buyer preferences become difficult to analyze.
However, a Power BI dashboard solves these issues.
Key Reasons Antique Dealers Use Power BI Dashboards
-
📊 Centralized antique business analytics
-
📈 Real-time sales and inventory insights
-
🔎 Better understanding of buyer preferences
-
💰 Improved profitability tracking
-
📦 Faster inventory turnover analysis
Therefore, dealers can make faster and smarter decisions.
Key Features of the Antique Dealers Dashboard in Power BI
The Antique Dealers Dashboard includes five interactive pages inside the Power BI Desktop application. Each page analyzes different aspects of the antique business.
Click to Purchases Antique Dealers Dashboard in Power BI
1. Overview Page
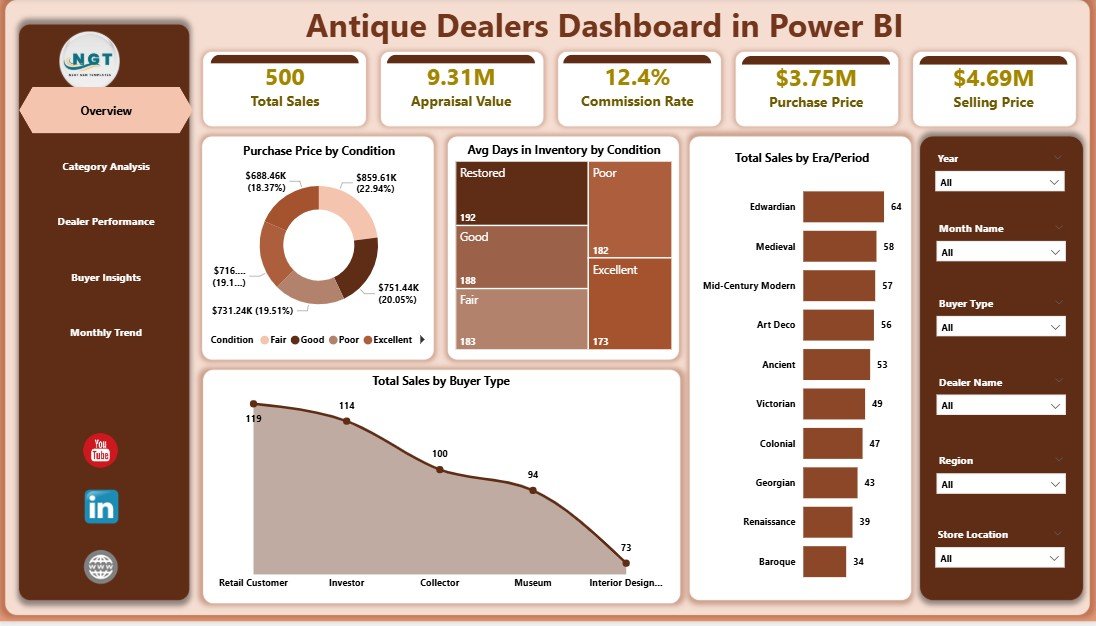
The Overview Page acts as the main summary dashboard.
Here, users immediately see key performance indicators that reflect the overall business performance.
Key Metrics on the Overview Page
-
Purchase Price by Condition
-
Average Days in Inventory by Condition
-
Total Sales by Era Period
-
Total Sales by Buyer Type
Moreover, users can apply slicers to filter the data based on different parameters.
Insights From the Overview Page
This page helps dealers answer important questions such as:
-
Which antique condition category generates the highest purchase value?
-
Which historical era generates the most sales?
-
Which buyer type purchases the most antiques?
-
How long do items remain in inventory?
Therefore, dealers gain a quick overview of business health.
2. Category Analysis Page
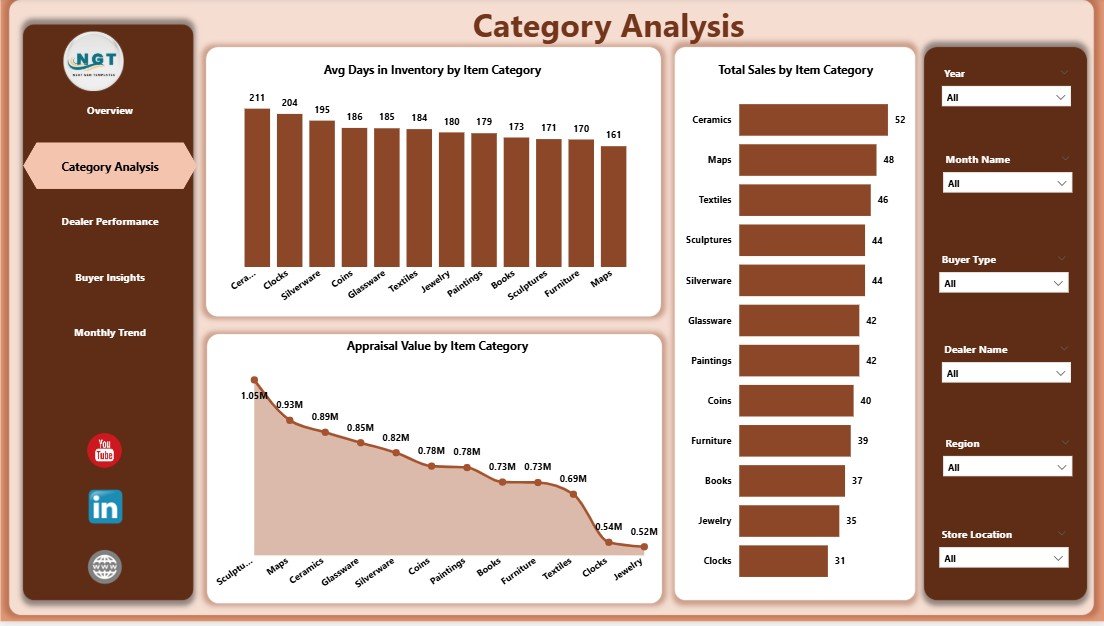
The Category Analysis Page focuses on analyzing antiques based on item categories.
Antique businesses often sell many product types, including:
-
Antique furniture
-
Vintage jewelry
-
Rare books
-
Historical artifacts
-
Decorative collectibles
Therefore, category-level analysis becomes extremely important.
Charts in the Category Analysis Page
-
Average Days in Inventory by Item Category
-
Total Sales by Item Category
-
Appraisal Value by Item Category
Insights Provided by This Page
This page helps dealers understand:
-
Which categories sell faster
-
Which antique categories generate the most revenue
-
Which categories hold the highest appraisal value
As a result, dealers can focus on acquiring high-performing antique categories.
3. Dealer Performance Page
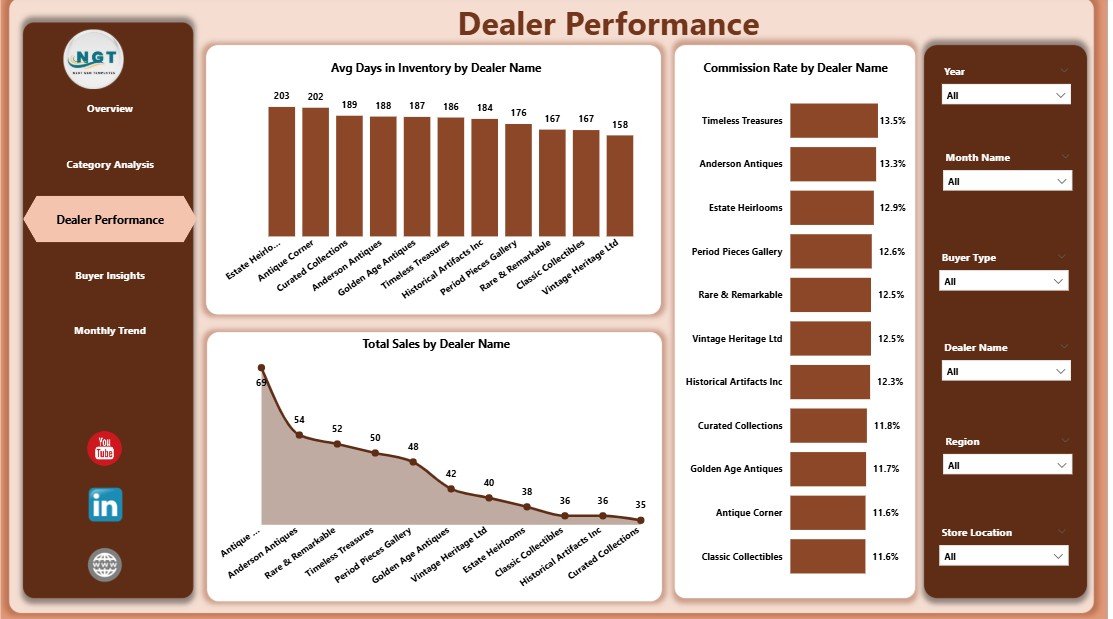
The Dealer Performance Page evaluates how individual antique dealers perform.
Antique businesses often work with multiple dealers, each responsible for sourcing or selling antiques.
Therefore, performance tracking becomes essential.
Charts Included in Dealer Performance
-
Average Days in Inventory by Dealer Name
-
Commission Rate by Dealer Name
-
Total Sales by Dealer Name
Business Insights From This Page
This page answers important questions such as:
-
Which dealer generates the highest sales?
-
Which dealer maintains faster inventory turnover?
-
Which dealer receives higher commissions?
Therefore, antique business owners can reward top performers and improve dealer productivity.
4. Buyer Insights Page
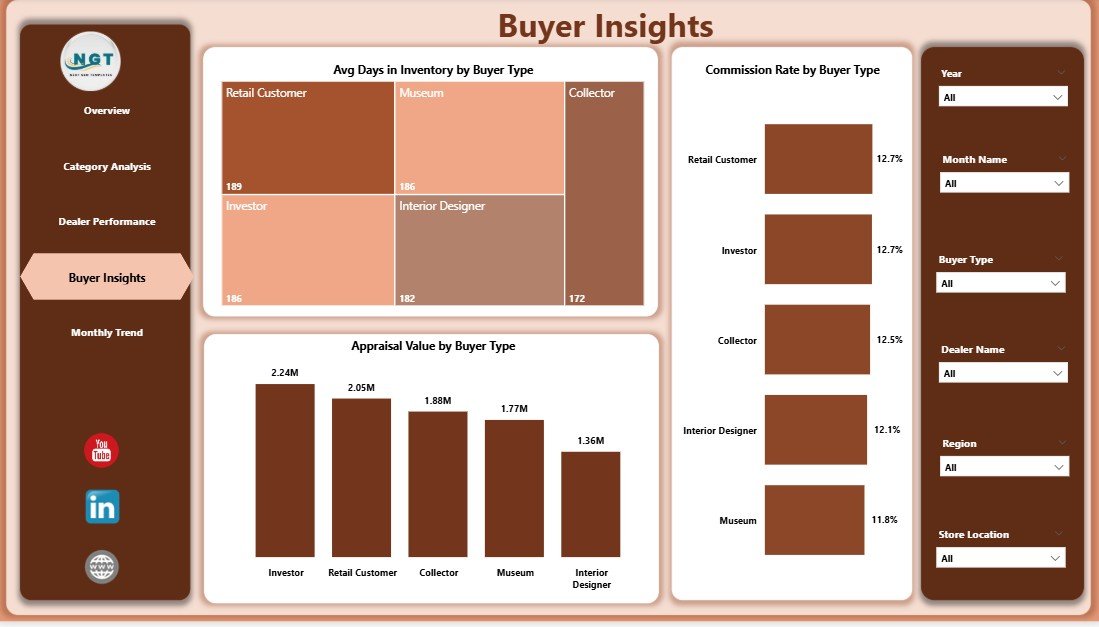
The Buyer Insights Page analyzes customer purchasing behavior.
Antique buyers often belong to different segments such as:
-
Collectors
-
Museums
-
Auction buyers
-
Interior designers
-
Private buyers
Understanding buyer behavior helps dealers improve their sales strategy.
Charts in Buyer Insights
-
Average Days in Inventory by Buyer Type
-
Commission Rate by Buyer Type
-
Appraisal Value by Buyer Type
Insights Generated
This page helps dealers identify:
-
Which buyer segment purchases the most antiques
-
Which buyer types buy higher-value items
-
Which buyers drive faster sales
As a result, dealers can focus marketing efforts on high-value buyers.
Click to Purchases Antique Dealers Dashboard in Power BI
5. Month Analysis Page
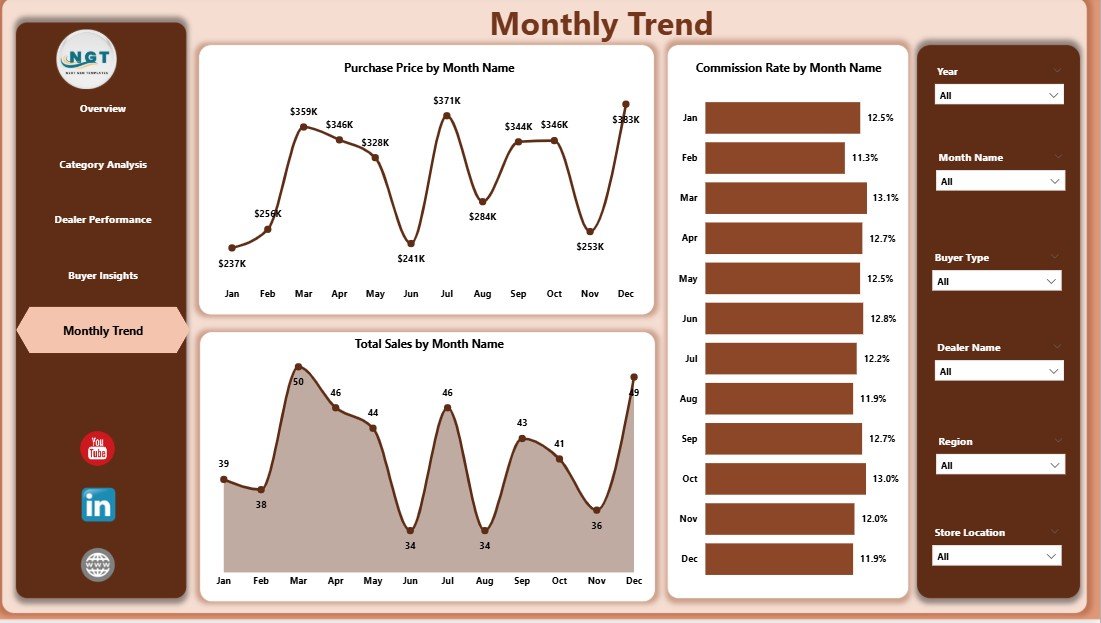
The Month Analysis Page focuses on time-based business trends.
Antique sales often fluctuate due to seasonal demand, auctions, exhibitions, and tourism seasons.
Charts Included in Month Analysis
-
Purchase Price by Month
-
Commission Rate by Month
-
Total Sales by Month
Insights Provided
This page helps dealers analyze:
-
Seasonal antique sales patterns
-
Monthly purchase trends
-
Commission changes across months
Therefore, antique businesses can plan inventory purchases and marketing campaigns accordingly.
Advantages of the Antique Dealers Dashboard in Power BI
The Antique Dealers Dashboard provides many advantages for antique businesses.
1. Better Business Visibility
The dashboard gives a clear overview of the entire antique business.
Therefore, owners can quickly identify performance trends.
2. Faster Decision Making
Because the dashboard shows visual insights, decision-makers do not need to analyze raw spreadsheets.
As a result, they can take faster business actions.
3. Improved Inventory Management
Antique items often remain unsold for long periods.
However, the dashboard highlights inventory aging.
Therefore, dealers can focus on selling slow-moving items.
4. Dealer Performance Monitoring
Managers can evaluate dealer productivity.
Consequently, they can reward high-performing dealers and improve underperforming ones.
5. Better Buyer Understanding
The dashboard reveals which buyer segments generate the most revenue.
Therefore, businesses can design targeted sales strategies.
6. Category-Level Profitability Insights
Different antique categories generate different profit margins.
Therefore, dealers can invest in high-performing categories.
Opportunities for Improvement in Antique Business Analytics
Although dashboards provide powerful insights, businesses must continuously improve their analytics.
Possible Improvement Areas
-
Add inventory aging alerts
-
Track profit margin by item
-
Monitor auction performance
-
Analyze supplier sourcing performance
-
Include geographic buyer trends
Therefore, businesses can further enhance decision-making.
Best Practices for Using an Antique Dealers Dashboard in Power BI
To gain maximum value from the dashboard, businesses should follow several best practices.
1. Maintain Accurate Data
Always record accurate information about:
-
Purchase price
-
Appraisal value
-
Dealer details
-
Buyer information
-
Sales transactions
Accurate data ensures reliable insights.
2. Update Data Regularly
Businesses should update the dashboard frequently.
Therefore, managers can track real-time performance.
3. Use Interactive Filters
Power BI slicers allow users to filter data by:
-
Dealer
-
Category
-
Month
-
Buyer type
Therefore, users can perform deeper analysis.
4. Monitor Inventory Turnover
Antique inventory turnover indicates business efficiency.
Therefore, businesses should analyze items with long inventory periods.
5. Focus on High-Value Buyers
Buyers who purchase rare antiques generate higher profits.
Therefore, businesses should build relationships with such buyers.
How Does Power BI Transform Antique Business Analytics?
Traditional antique businesses rely on manual reporting.
However, modern tools like Microsoft Power BI transform data analysis.
Power BI offers many advantages:
-
Interactive dashboards
-
Automated data refresh
-
Advanced visualization tools
-
Real-time analytics
-
Custom performance metrics
Therefore, antique businesses gain modern data-driven capabilities.
Click to Purchases Antique Dealers Dashboard in Power BI
Who Can Benefit From the Antique Dealers Dashboard?
Several professionals in the antique industry can benefit from this dashboard.
Antique Shop Owners
They can monitor sales performance and inventory value.
Antique Dealers
They can evaluate their sales productivity.
Collectors
They can analyze historical item performance.
Auction Houses
They can track auction trends and buyer behavior.
Antique Business Analysts
They can generate deeper insights into antique markets.
How to Implement an Antique Dealers Dashboard?
Businesses can follow a simple process to implement the dashboard.
Step 1: Collect Antique Business Data
Gather data such as:
-
Item categories
-
Purchase price
-
Appraisal value
-
Dealer name
-
Buyer type
-
Sales value
-
Inventory days
Step 2: Prepare Data for Analysis
Clean and structure the dataset.
Therefore, Power BI can easily analyze it.
Step 3: Build Power BI Visualizations
Create charts such as:
-
Sales charts
-
Inventory aging charts
-
Dealer performance charts
-
Buyer behavior charts
Step 4: Add Filters and Interactivity
Use slicers and drill-down features.
Therefore, users can explore data easily.
Step 5: Monitor Dashboard Insights
Review dashboard metrics regularly.
As a result, businesses can improve strategy continuously.
Conclusion
The Antique Dealers Dashboard in Power BI provides a powerful analytics solution for antique businesses. It transforms complex antique sales and inventory data into clear visual insights.
Moreover, the dashboard helps dealers track inventory aging, analyze buyer behavior, evaluate dealer performance, and monitor category profitability.
Because antique businesses deal with unique and valuable items, data-driven decisions become extremely important. Therefore, implementing a Power BI dashboard helps dealers optimize inventory turnover, improve sales strategies, and increase profitability.
Consequently, antique businesses that adopt modern analytics tools gain a competitive advantage in the growing antique market.
Frequently Asked Questions (FAQs)
What is an Antique Dealers Dashboard?
An Antique Dealers Dashboard is a business analytics tool that helps antique dealers track sales, inventory, buyer trends, and dealer performance using visual charts.
Why should antique dealers use Power BI?
Antique dealers should use Power BI because it converts raw sales data into interactive dashboards that provide faster and clearer business insights.
What data is required for an Antique Dealers Dashboard?
Typical dashboard data includes:
-
Item category
-
Purchase price
-
Appraisal value
-
Dealer name
-
Buyer type
-
Sales value
-
Inventory days
Can small antique shops use Power BI dashboards?
Yes. Even small antique shops can use Power BI dashboards to track inventory, analyze sales, and improve business decisions.
How often should antique dealers update the dashboard?
Dealers should update the dashboard regularly. Many businesses update data daily or weekly to monitor real-time performance.
Visit our YouTube channel to learn step-by-step video tutorials