Legal disputes have become increasingly common in modern business environments. Organizations handle contract disputes, financial claims, regulatory disagreements, and partnership conflicts almost every day. Because of this, companies need efficient systems to monitor arbitration and mediation cases.
However, many legal teams still rely on scattered spreadsheets, emails, and manual reports. As a result, decision-makers struggle to track case progress, settlement outcomes, claim amounts, and resolution performance. Therefore, organizations now adopt data-driven dashboards to simplify dispute tracking and analysis.
Click to Purchases Arbitration and Mediation Dashboard in Excel
One powerful solution is the Arbitration and Mediation Dashboard in Excel. This dashboard converts complex legal case data into easy-to-understand visual reports. Consequently, legal departments, arbitration centers, and law firms can quickly analyze case performance and make better decisions.
In this article, you will learn everything about the Arbitration and Mediation Dashboard in Excel, including its features, structure, advantages, best practices, and frequently asked questions.
What Is an Arbitration and Mediation Dashboard in Excel?
An Arbitration and Mediation Dashboard in Excel is an interactive reporting tool that helps legal teams monitor and analyze dispute resolution cases using charts, KPIs, and filters.
The dashboard collects legal case data such as:
-
Case ID
-
Case Type
-
Dispute Category
-
Claim Amount
-
Settlement Amount
-
Resolution Method (Arbitration or Mediation)
-
Arbitrator Name
-
Claimant Type
-
Legal Representation
-
Case Status
-
Resolution Dates
Then, Excel transforms this data into visual insights using charts and KPI cards.
As a result, legal professionals can:
-
Track dispute trends
-
Monitor case resolution performance
-
Analyze claim and settlement amounts
-
Evaluate arbitrator performance
-
Identify financial outcomes
Therefore, instead of manually reviewing long spreadsheets, users can instantly understand case performance through interactive visuals.
Click to Purchases Arbitration and Mediation Dashboard in Excel
Why Do Legal Teams Need an Arbitration and Mediation Dashboard?
Legal departments often deal with large volumes of dispute cases. Without a centralized monitoring system, analyzing dispute trends becomes difficult.
However, an Excel dashboard simplifies this process.
Here are the main reasons organizations use this dashboard:
-
Centralized case monitoring
The dashboard brings all dispute data into one visual reporting system. -
Improved decision-making
Managers quickly analyze claim trends and settlement outcomes. -
Better case management
Teams can track pending and resolved cases easily. -
Financial transparency
The dashboard shows claim amounts, settlements, and recovery rates. -
Time-saving analysis
Automated charts eliminate manual reporting work.
Therefore, organizations can manage dispute resolution processes more efficiently.
Key Features of the Arbitration and Mediation Dashboard in Excel
This dashboard includes several interactive features that make analysis easier and faster.
1. Page Navigator
The Page Navigator appears on the left side of the dashboard.
This feature allows users to switch between analytical pages instantly. As a result, users can explore different insights without searching through multiple sheets.
Benefits of Page Navigator
-
Quick navigation between dashboard pages
-
Better user experience
-
Structured data exploration
-
Improved reporting workflow
Therefore, users can access different analytical views with just one click.
How Is the Arbitration and Mediation Dashboard Structured?
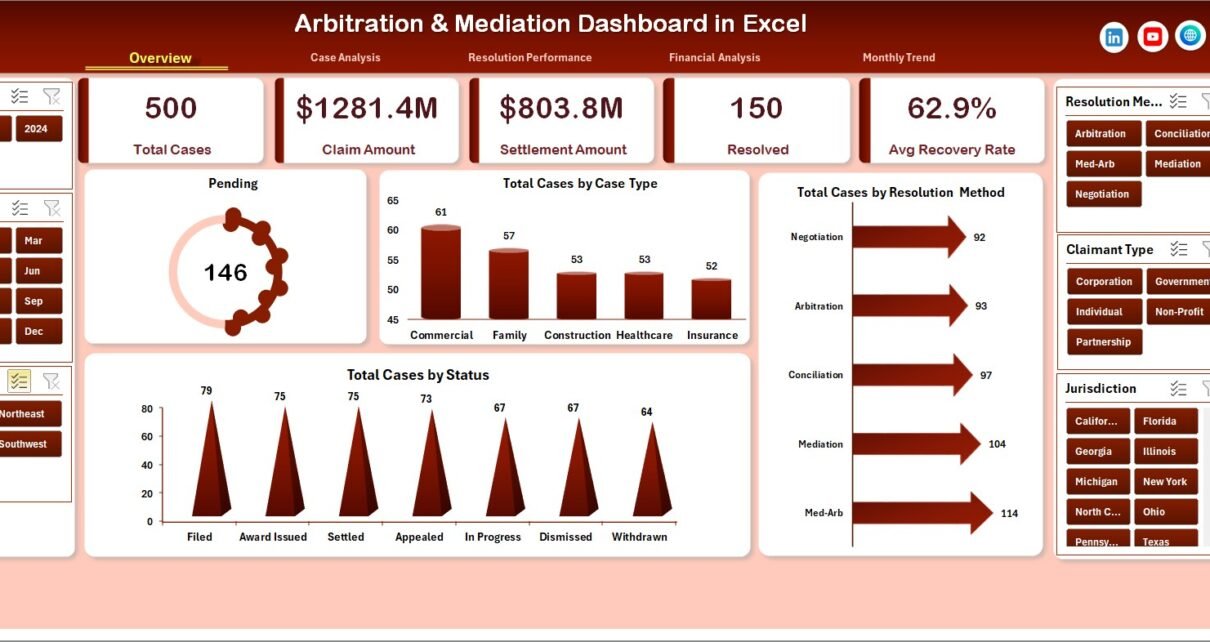
The Arbitration and Mediation Dashboard in Excel contains five analytical pages, each designed to analyze dispute cases from different perspectives.
1. Overview Page – What Insights Does It Provide?
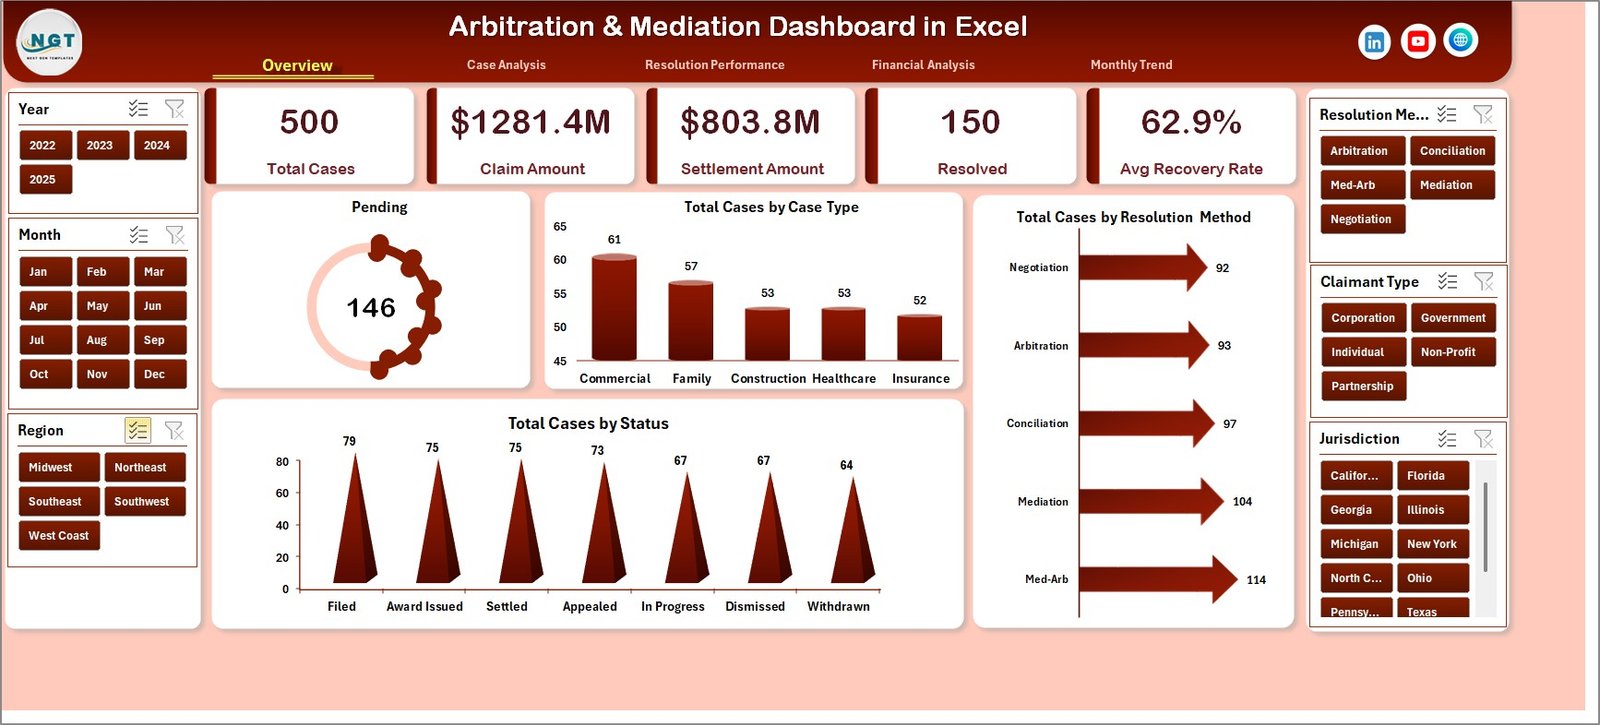
The Overview Page acts as the central summary of the entire dashboard.
Users can quickly understand dispute trends, case distribution, and resolution status from this page.
Dashboard Elements
Slicer (Filter):
-
Located on the right side of the dashboard
-
Allows filtering by different categories
KPI Cards
The page contains 4 key performance cards:
-
Pending Cases
-
Total Cases by Case Type
-
Total Cases by Resolution Method
-
Total Cases by Status
Charts on the Overview Page
The page also contains four analytical charts:
-
Pending Cases Overview
-
Total Cases by Case Type
-
Total Cases by Resolution Method
-
Total Cases by Status
Because of these visuals, users can quickly identify:
-
Active cases
-
Resolved cases
-
Arbitration vs mediation distribution
Therefore, the overview page provides a quick snapshot of dispute resolution performance.
2. Case Analysis Page – How Does It Analyze Dispute Types?
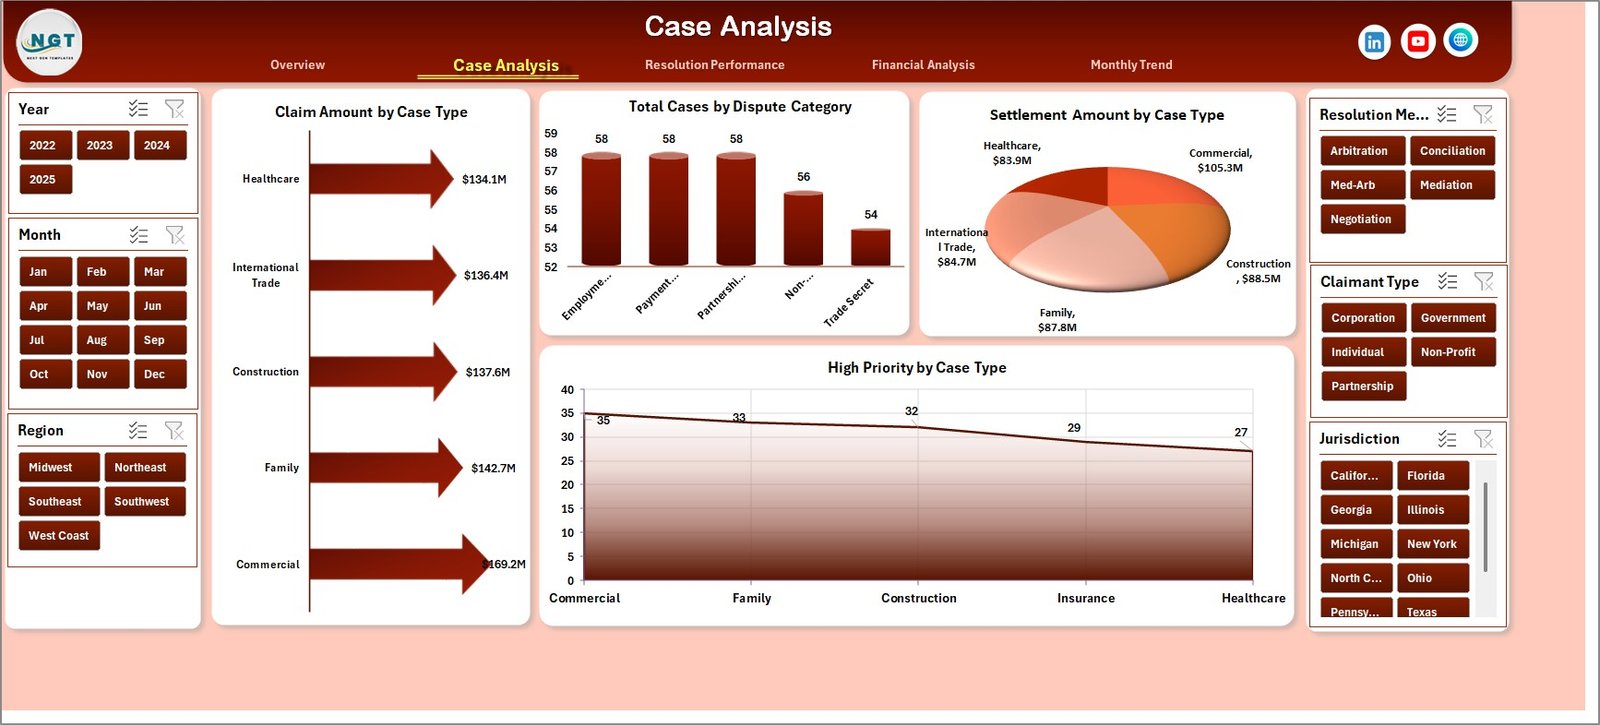
The Case Analysis Page focuses on dispute categories and claim values.
This page helps legal teams understand which case types generate the highest claim amounts and dispute volumes.
Filters
The right-side slicer allows users to filter data based on specific parameters.
Charts on Case Analysis Page
The page contains four analytical charts:
Click to Purchases Arbitration and Mediation Dashboard in Excel
-
Claim Amount by Case Type
-
Total Cases by Dispute Category
-
Settlement Amount by Case Type
-
High Priority Cases by Case Type
Insights Provided
Using these charts, legal teams can analyze:
-
Which case types involve higher claims
-
Which disputes occur most frequently
-
Which cases require urgent attention
Therefore, organizations can prioritize legal resources more effectively.
3. Resolution Performance Page – How Effective Is the Resolution Process?
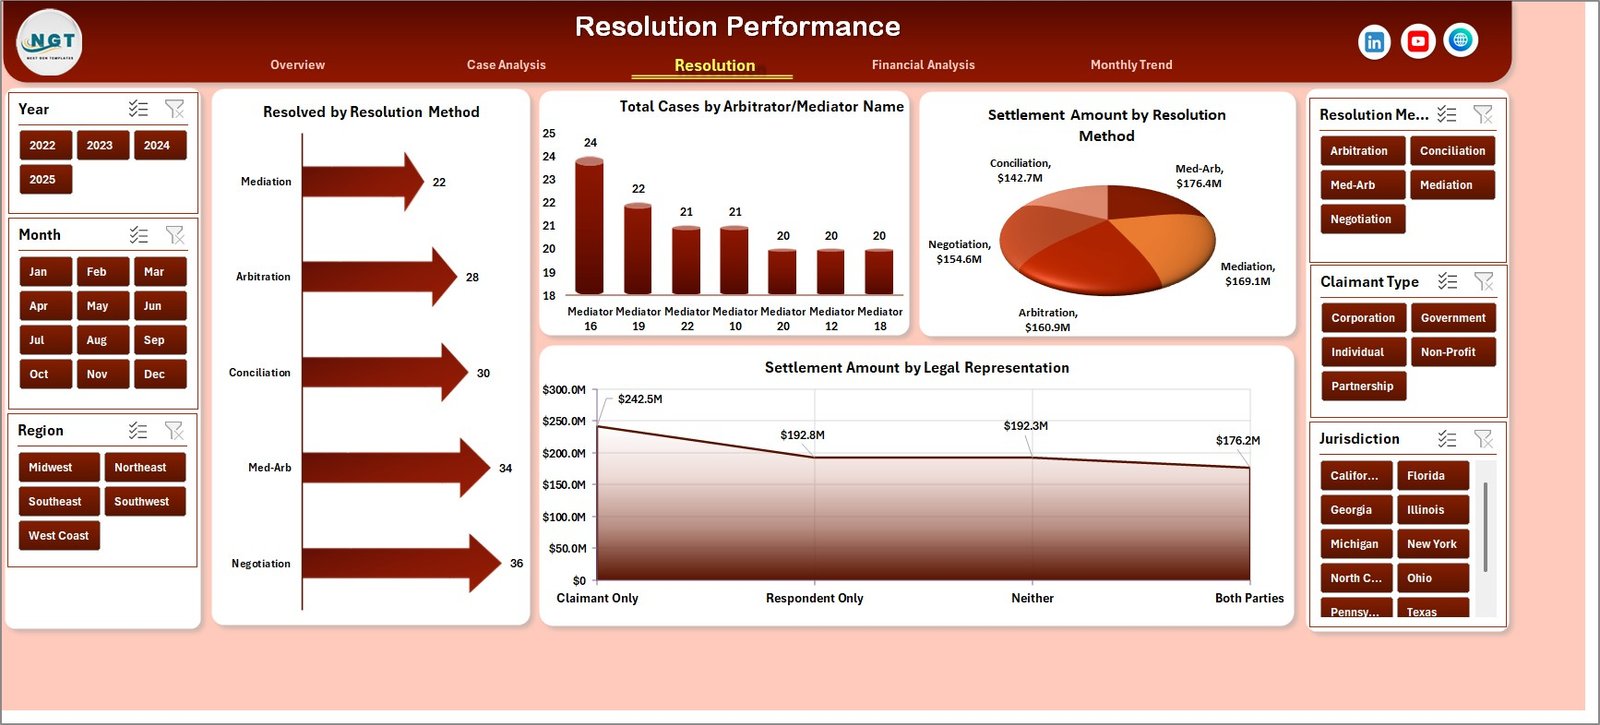
The Resolution Performance Page focuses on dispute resolution effectiveness.
Because arbitration and mediation involve multiple stakeholders, organizations must monitor performance closely.
Charts on Resolution Performance Page
This page contains four important charts:
-
Resolved Cases by Resolution Method
-
Total Cases by Arbitrator
-
Settlement Amount by Resolution Method
-
Settlement Amount by Legal Representation
Insights from This Page
These visuals help organizations evaluate:
-
Arbitrator performance
-
Effectiveness of arbitration vs mediation
-
Legal representation outcomes
-
Settlement patterns
Consequently, legal teams can improve dispute resolution strategies.
4. Financial Analysis Page – What Financial Insights Can You Track?
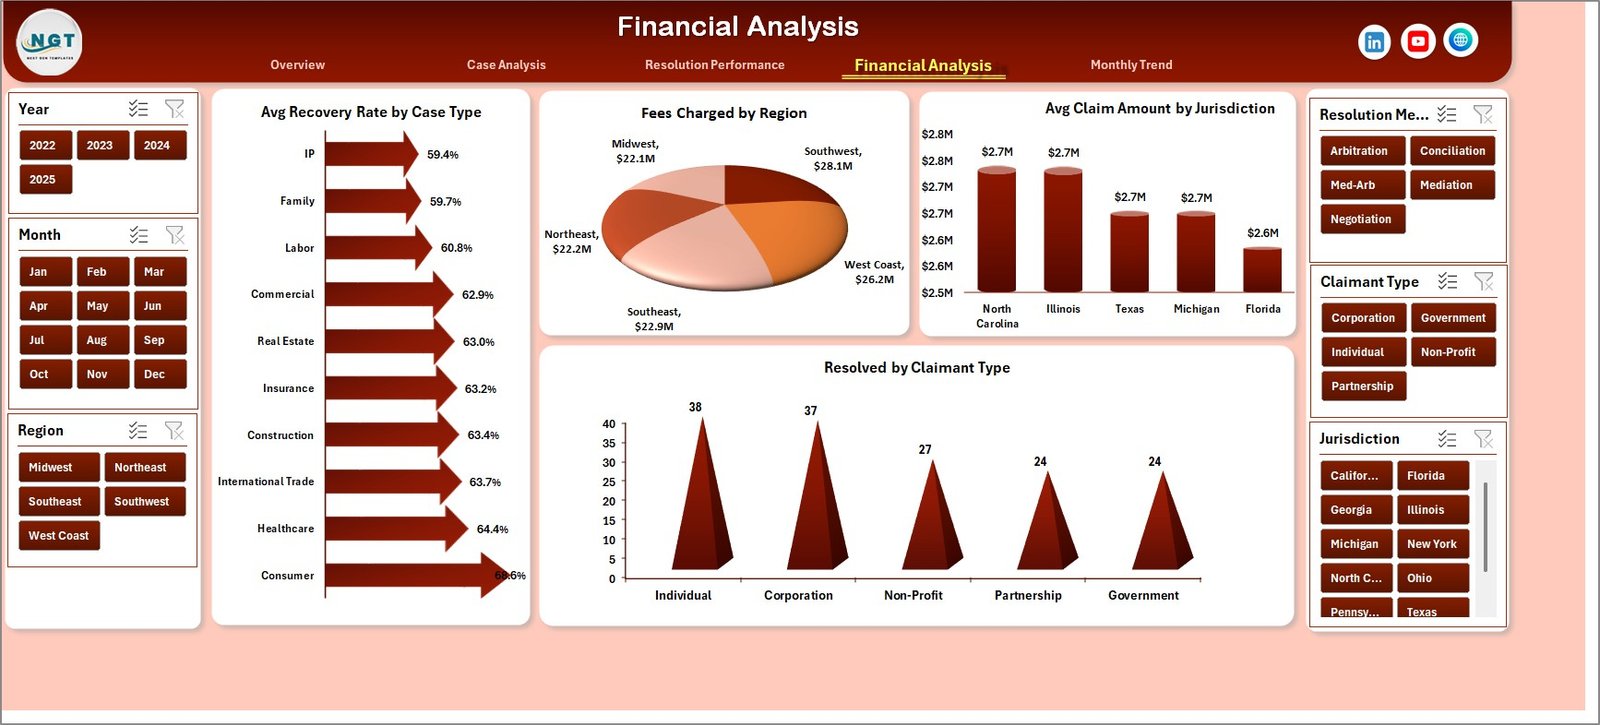
Legal disputes often involve significant financial implications. Therefore, monitoring financial outcomes becomes essential.
The Financial Analysis Page focuses on claim amounts, settlements, and recovery rates.
Charts on Financial Analysis Page
This page includes four financial analysis charts:
-
Average Recovery Rate by Case Type
-
Fees Charged by Region
-
Average Claim Amount by Jurisdiction
-
Resolved Cases by Claimant Type
Key Financial Insights
Using this page, organizations can evaluate:
-
Recovery efficiency
-
Regional legal cost distribution
-
Jurisdiction-based claim values
-
Claimant success rates
Therefore, decision-makers can understand the financial impact of dispute cases.
5. Month Analysis Page – How Do Cases Change Over Time?
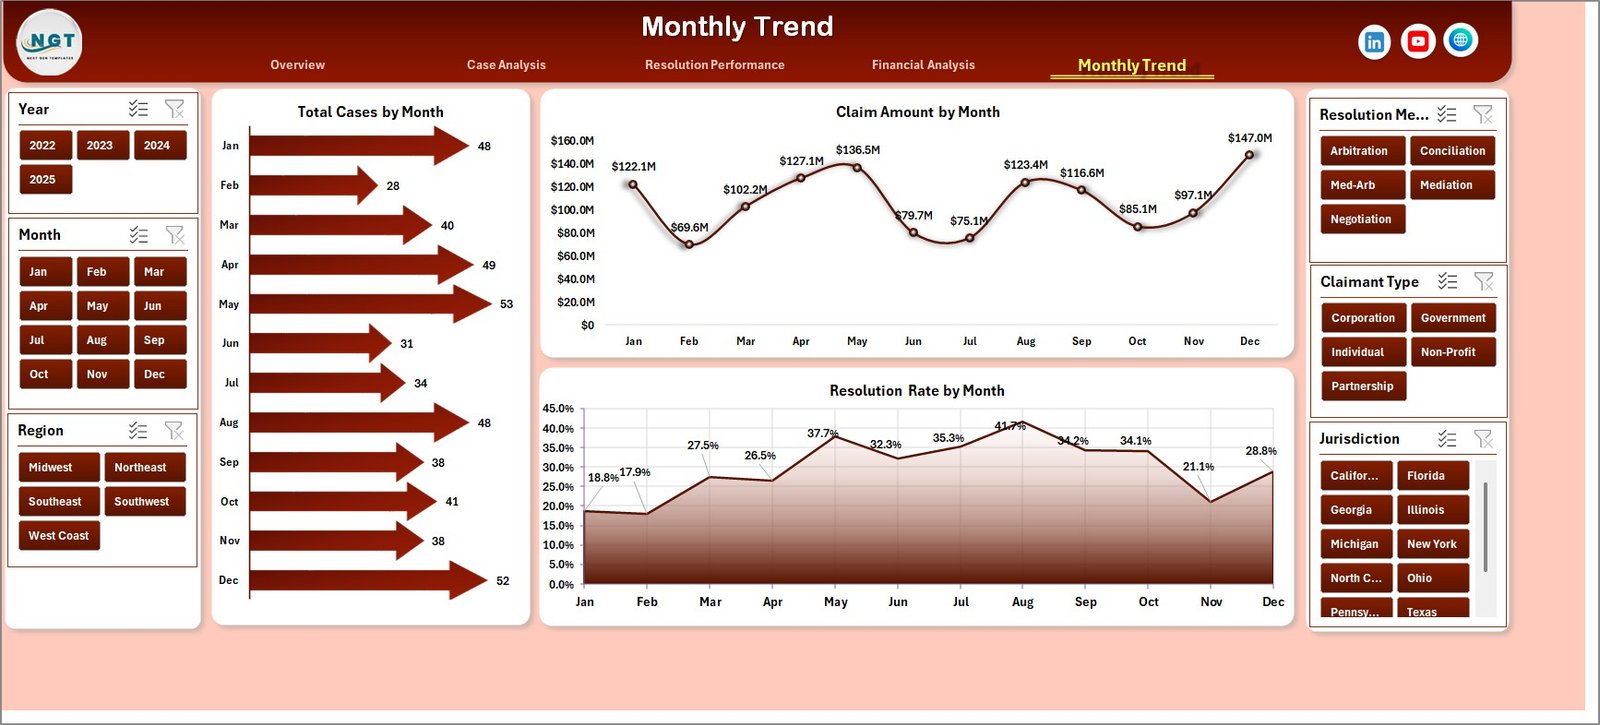
Legal case trends often change over time. Because of this, organizations need monthly performance analysis.
The Month Analysis Page helps track dispute trends across months.
Charts on Month Analysis Page
The page includes three time-based charts:
-
Total Cases by Month
-
Claim Amount by Month
-
Resolution Rate by Month
Insights from Monthly Analysis
These visuals help organizations analyze:
-
Monthly case volume trends
-
Changes in claim values
-
Resolution performance over time
As a result, legal teams can identify seasonal trends and workload patterns.
What Supporting Sheets Are Used in the Dashboard?
The dashboard uses additional sheets to manage and process data effectively.
Support Sheet
The Support Sheet performs backend calculations and data transformations.
It prepares data for charts and KPIs.
Data Sheet
The Data Sheet contains the raw case information entered by users.
Users can update:
-
Case details
-
Claim amounts
-
Settlement data
-
Arbitrator information
After data entry, the dashboard automatically updates charts and KPIs.
Click to Purchases Arbitration and Mediation Dashboard in Excel
Advantages of the Arbitration and Mediation Dashboard in Excel
The Arbitration and Mediation Dashboard in Excel offers several benefits for legal teams and organizations.
1. Centralized Case Monitoring
The dashboard collects all dispute data in one place. Therefore, legal teams can track case performance easily.
2. Faster Decision-Making
Interactive charts help managers identify trends quickly. As a result, decision-making becomes faster.
3. Improved Dispute Tracking
Users can track arbitration and mediation cases in real time.
4. Financial Transparency
The dashboard clearly shows claim amounts, settlements, and recovery rates.
5. Better Resource Allocation
Managers can identify high-priority cases and allocate legal resources effectively.
6. Time-Saving Reporting
Automated charts reduce manual reporting work.
Best Practices for the Arbitration and Mediation Dashboard
To maximize the value of this dashboard, organizations should follow several best practices.
1. Maintain Accurate Data Entry
Always enter correct case information. Because dashboards rely on data accuracy, incorrect data will affect insights.
2. Update Data Regularly
Update case records frequently so that the dashboard reflects the latest case status.
3. Use Standardized Case Categories
Standardized case types improve data analysis.
4. Monitor Key Performance Metrics
Focus on metrics such as:
-
Resolution rate
-
Settlement value
-
Recovery percentage
5. Review Trends Regularly
Monthly analysis helps identify patterns and potential risks.
How Can Organizations Use This Dashboard?
Many organizations can benefit from the Arbitration and Mediation Dashboard.
Common Users
-
Corporate legal departments
-
Arbitration centers
-
Law firms
-
Compliance teams
-
Government dispute resolution departments
These organizations can track dispute trends and financial outcomes effectively.
How Does Excel Make This Dashboard Powerful?
Excel provides several powerful features that enhance this dashboard.
Excel Features Used
-
Pivot tables
-
Pivot charts
-
Slicers for filtering
-
Conditional formatting
-
Data tables
-
Automated calculations
Because Excel is widely used, most organizations can implement this dashboard easily without advanced software.
Future Improvements for Arbitration Dashboards
Organizations can further enhance their dashboards by adding advanced features.
Possible Enhancements
-
Automated data import
-
Power Query data transformation
-
Power BI integration
-
Case risk scoring
-
Predictive dispute analytics
These improvements can make dispute management even more efficient.
Conclusion
Dispute resolution plays a crucial role in modern business operations. Organizations handle numerous arbitration and mediation cases that involve financial risks and legal complexities.
Therefore, companies need efficient tools to track and analyze dispute cases.
The Arbitration and Mediation Dashboard in Excel provides a powerful and user-friendly solution. It converts complex case data into clear visual insights using charts, KPIs, and filters.
Because the dashboard includes pages such as Overview, Case Analysis, Resolution Performance, Financial Analysis, and Month Analysis, legal teams gain a comprehensive understanding of dispute trends and outcomes.
As a result, organizations can improve decision-making, monitor legal performance, and manage dispute cases more effectively.
Frequently Asked Questions (FAQs)
Click to Purchases Arbitration and Mediation Dashboard in Excel
What is an Arbitration and Mediation Dashboard in Excel?
An Arbitration and Mediation Dashboard in Excel is a reporting tool that tracks dispute resolution cases using charts, KPIs, and interactive filters.
Who can use this dashboard?
Many professionals can use this dashboard, including:
-
Legal departments
-
Arbitration centers
-
Law firms
-
Compliance teams
-
Corporate dispute management teams
What data is required for the dashboard?
The dashboard requires dispute case data such as:
-
Case type
-
Claim amount
-
Settlement amount
-
Arbitrator name
-
Resolution method
-
Case status
-
Jurisdiction
Can beginners use this Excel dashboard?
Yes. Because the dashboard uses simple Excel features like pivot tables and slicers, beginners can easily use it.
Can the dashboard handle large volumes of case data?
Yes. Excel dashboards can analyze thousands of rows of dispute data using pivot tables and charts.
Can organizations customize the dashboard?
Yes. Organizations can modify charts, KPIs, and filters according to their legal reporting requirements.
Visit our YouTube channel to learn step-by-step video tutorials