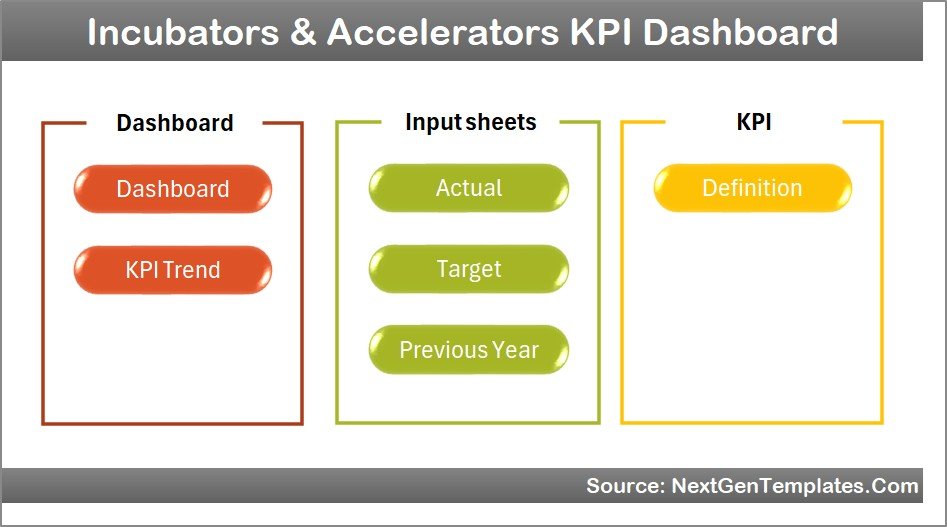
Incubators and Accelerators KPI Dashboard
Introduction
Click to Purchases Incubators and Accelerators KPI Dashboard in Excel
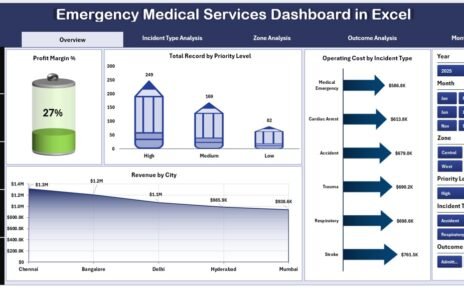
The Incubators & Accelerators KPI Dashboard is a ready-to-use Excel template designed to help program managers, analysts, and stakeholders track performance across key metrics. This dashboard provides month-to-date (MTD) and year-to-date (YTD) insights, trend charts, target comparisons, and clear KPI definitions for faster decision-making.
Key Features of Incubators & Accelerators KPI Dashboard
- Interactive dashboard with month selector to view MTD and YTD results.
- Conditional formatting for Target vs Actual and PY vs Actual comparisons using up/down arrows.
- KPI trend charts for Actual, Target, and Previous Year (PY).
- Separate input sheets for Actuals, Targets, Previous Year, and KPI Definitions.
- Ready-to-use template—plug in your numbers and start reporting immediately.
Dashboard Pages Explanation
This template includes 7 worksheets. Each sheet is designed to be intuitive and fast to update.
-
Home sheet
The Home sheet serves as an index with navigation buttons to jump to other sheets quickly. Use this as your starting point for the dashboard.
Home Page -
Dashboard sheet
This is the main analytics sheet. Select the month from the drop-down (cell D3) to update all MTD and YTD numbers. See Actual, Target, Previous Year and comparative arrows for quick performance checks.
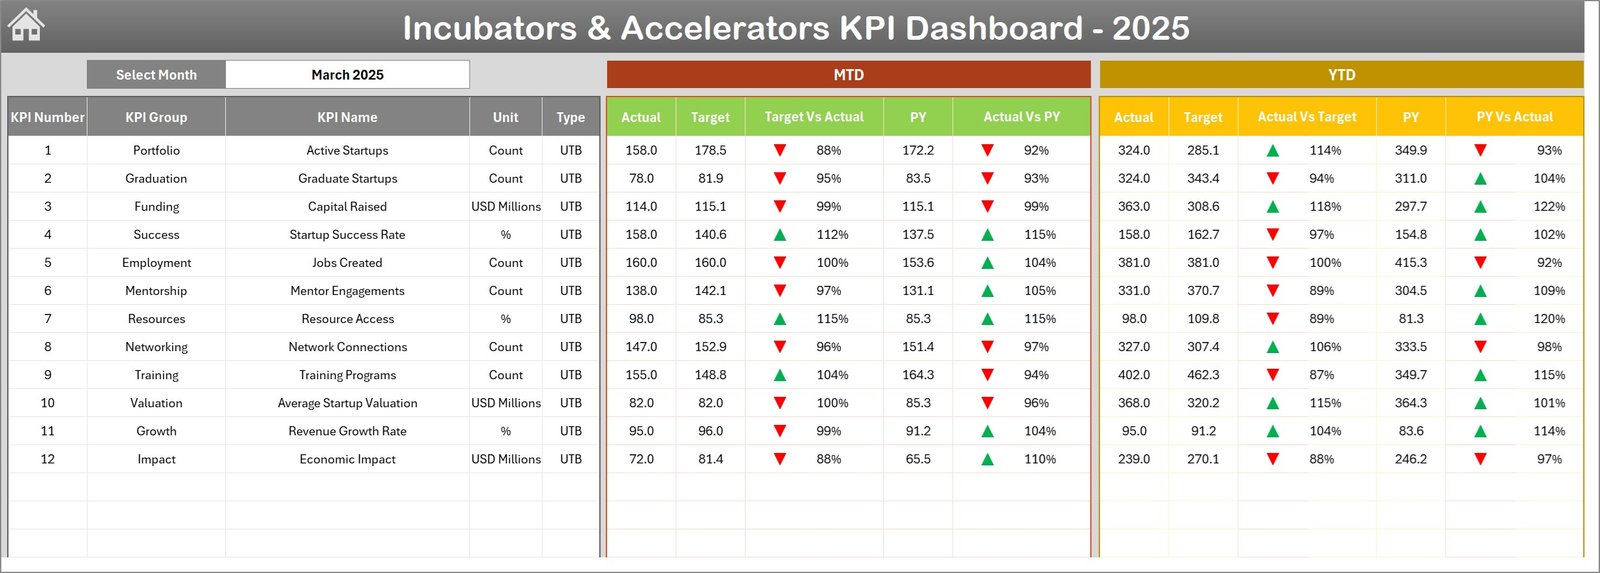
Incubators and Accelerators KPI Dashboard Incubators & Accelerators KPI Dashboard -
KPI Trend sheet
Select a KPI (cell C3) to view KPI group, units, type (LTB or UTB), formula and definition. Trend charts display MTD and YTD Actual, Target and PY values to visualize performance over time.
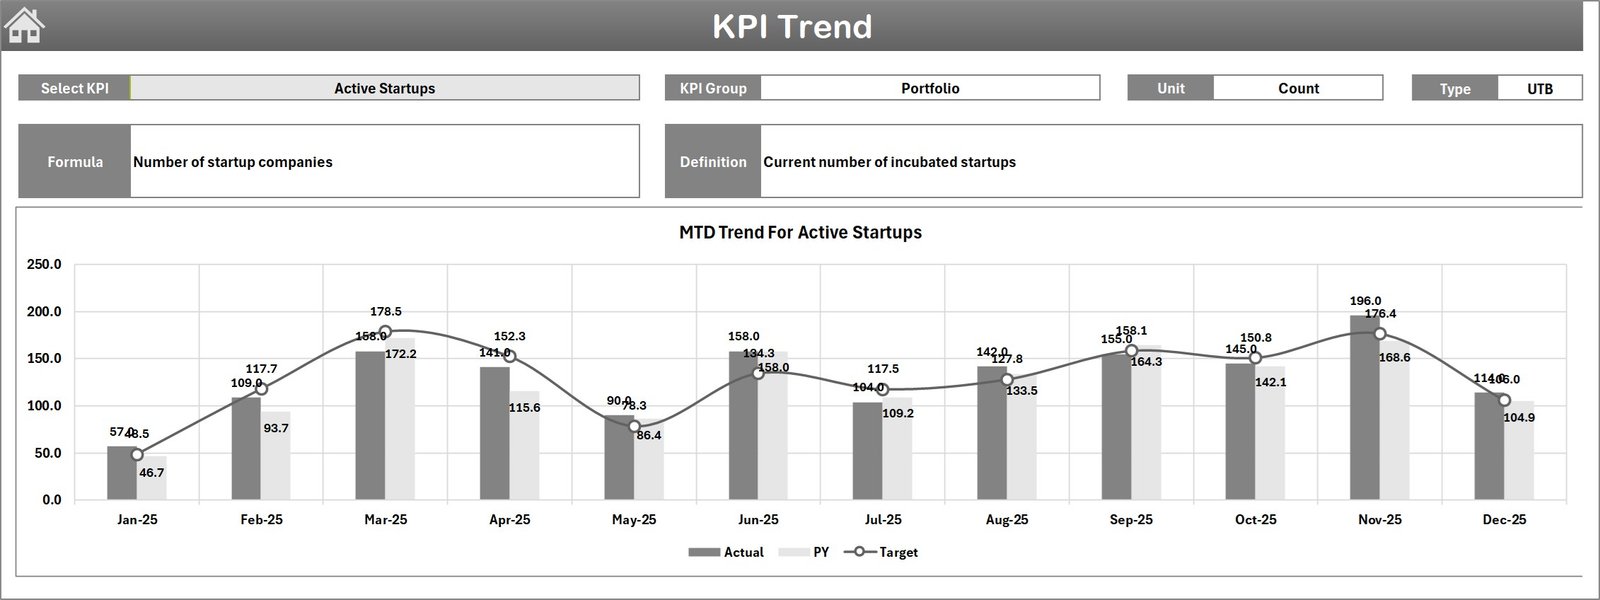
KPI Trend Sheet -
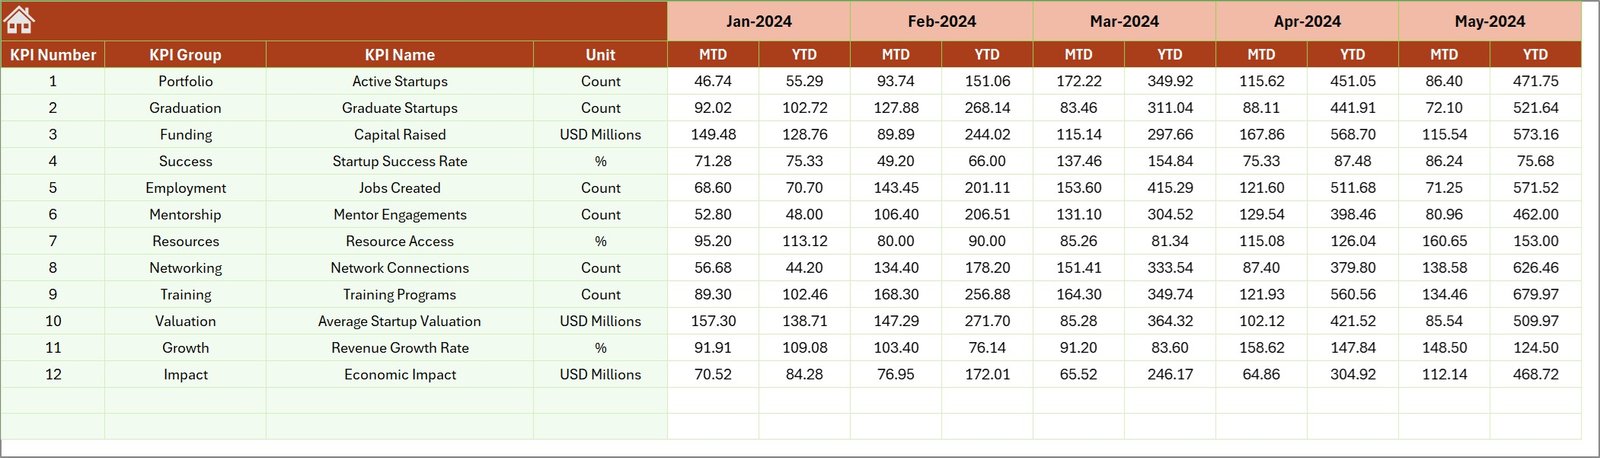
Actual Numbers Input sheet
Enter actual MTD and YTD figures for each KPI. Change the starting month of the year in cell E1 to align YTD calculations with your fiscal calendar.
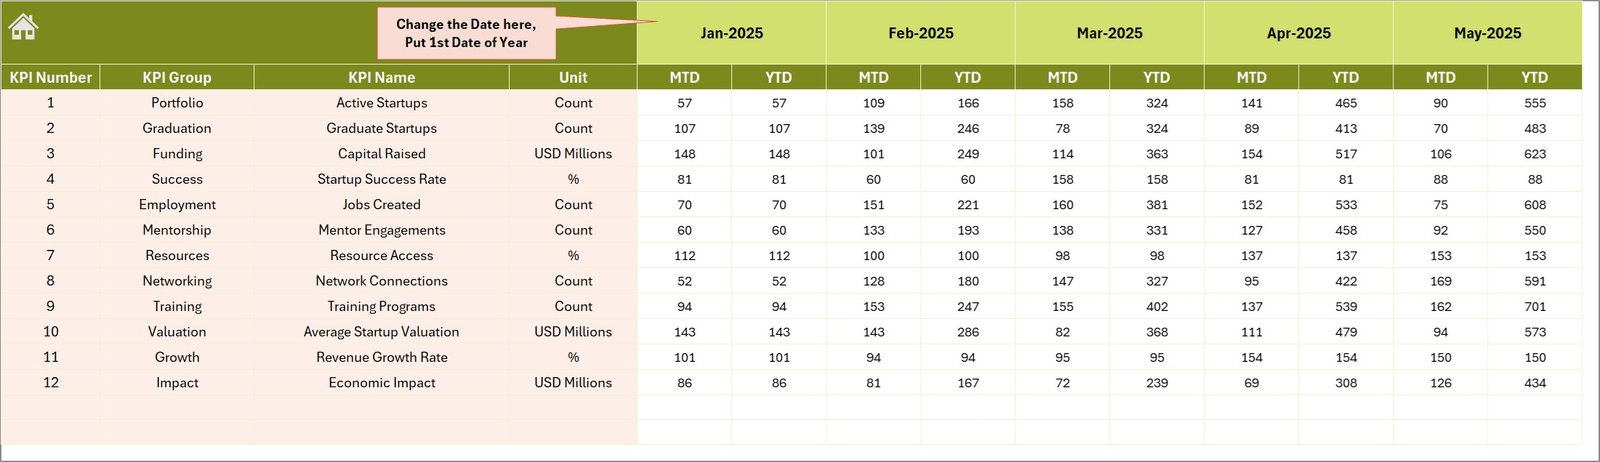
Actual Numbers Input sheet -
Target Number Input sheet
Input monthly Target numbers for each KPI. Targets can be entered both as MTD and cumulative YTD values to allow direct comparison against actuals.
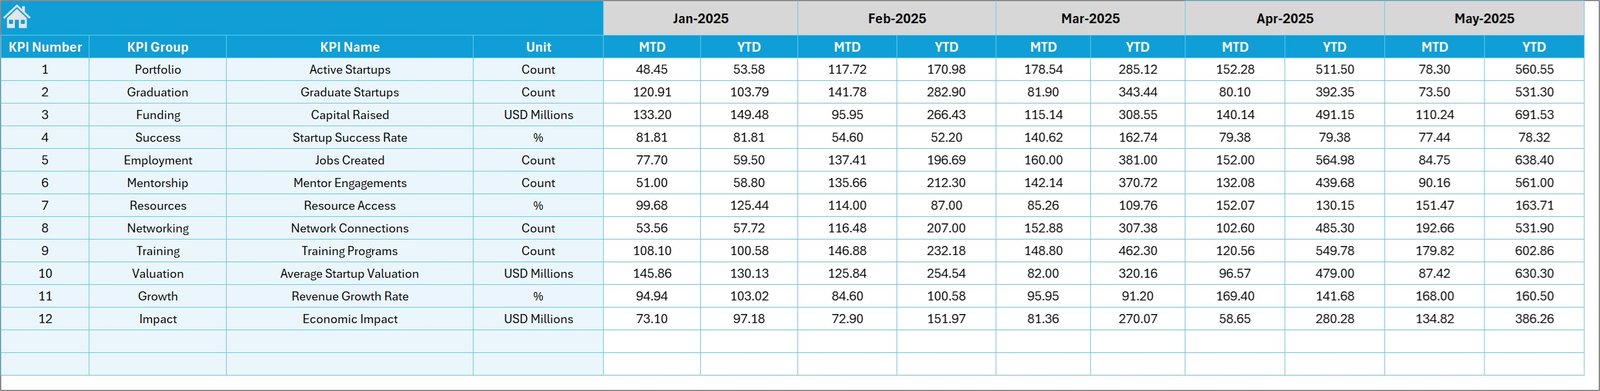
Target Number Input sheet -
Previous Year Number sheet
Enter last year’s monthly numbers in the same structure as current year inputs for side-by-side year-over-year comparison on the dashboard.
Previous Year Number Input sheet -
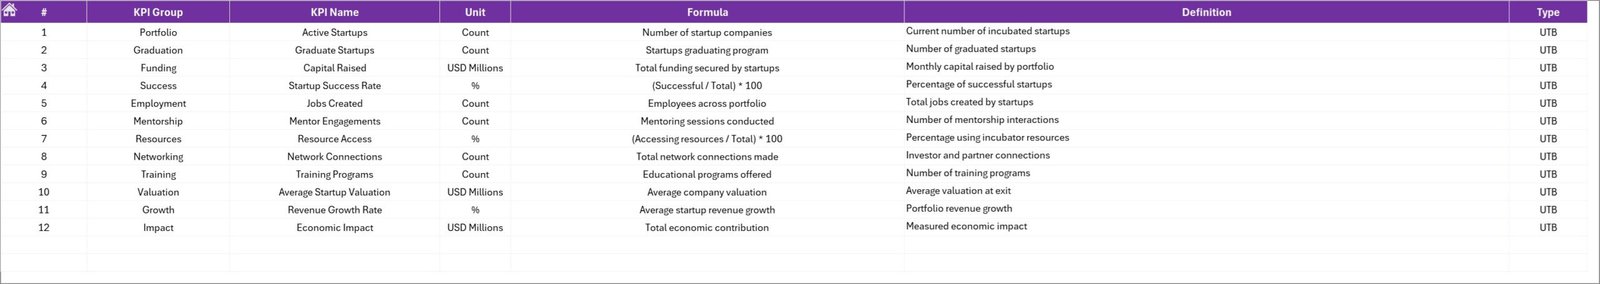
KPI Definition sheet
List KPI Name, KPI Group, Unit, Formula and Definition. Mark KPI type as LTB (Lower the Better) or UTB (Upper the Better) in the last column to drive correct conditional formatting and interpretation.
KPI Definition sheet
Advantages of Incubators & Accelerators KPI Dashboard
- Fast setup: pre-built structure reduces time to insight.
- Consistency: one source of truth for Actuals, Targets and PY values.
- Visibility: trend charts and conditional formatting highlight issues early.
- Flexibility: easy to update as program goals evolve.
Opportunities for Improvement
Click to Purchases Incubators and Accelerators KPI Dashboard in Excel
- Add automated data connectors (e.g., Excel Power Query or Power BI) to pull data directly from CRMs or program management tools.
- Introduce role-based views or filters for stakeholders (e.g., mentors, funders, program leads).
- Expand KPI metadata to include ownership, frequency, and target-setting rationale to improve governance.
Best Practices
- Standardize definitions: keep KPI formulas and units consistent in the KPI Definition sheet.
- Validate inputs monthly: reconcile Actuals and Targets to source systems before publishing.
- Use conditional formatting sparingly: focus attention on meaningful deviations.
- Backup regularly: keep versioned copies when making structural changes.
FAQs
How do I change the reporting month?
Select the month from the drop-down (Dashboard sheet cell D3). The dashboard will update MTD and YTD values accordingly.
How do I add a new KPI?
Add the KPI in the KPI Definition sheet with name, group, unit, formula and LTB/UTB type. Then enter Targets, Actuals and PY numbers in the respective input sheets.
Can I use Power BI with this template?
Yes. Export the Excel tables to Power BI or connect via Power Query for automated refresh and advanced visualizations.
Conclusion
The Incubators & Accelerators KPI Dashboard is a practical, ready-to-use template that streamlines performance tracking for incubation and acceleration programs. With clear inputs, defined KPIs, and visual trend analysis, teams can focus on driving outcomes rather than building reports.
External resources for further reading and integration:
Visit our YouTube channel to watch the demo.