Knowledge Management KPI Scorecard – Introduction
The Knowledge Management KPI Scorecard is a ready-to-use Excel template designed to help teams measure, visualize, and improve knowledge management (KM) performance. This post explains the scorecard layout, how each dashboard page works, advantages, improvement opportunities, and best practices for getting the most from the template.
Click to Purchases Knowledge Management KPI Scorecard in Excel
Key Features of Knowledge Management KPI Scorecard
- Pre-built scorecard and trend charts for fast implementation.
- Flexible data entry sheet to capture Actual, Target, and Prior Year values.
- Visual indicators and conditional formatting to highlight performance quickly.
- Dedicated KPI definition sheet to standardize metrics and formulas.
- Supports MTD (Month-To-Date) and YTD (Year-To-Date) analysis.
Dashboard Pages Explanation
The workbook contains four worksheets. Below is a clear explanation of each tab and how to use them.
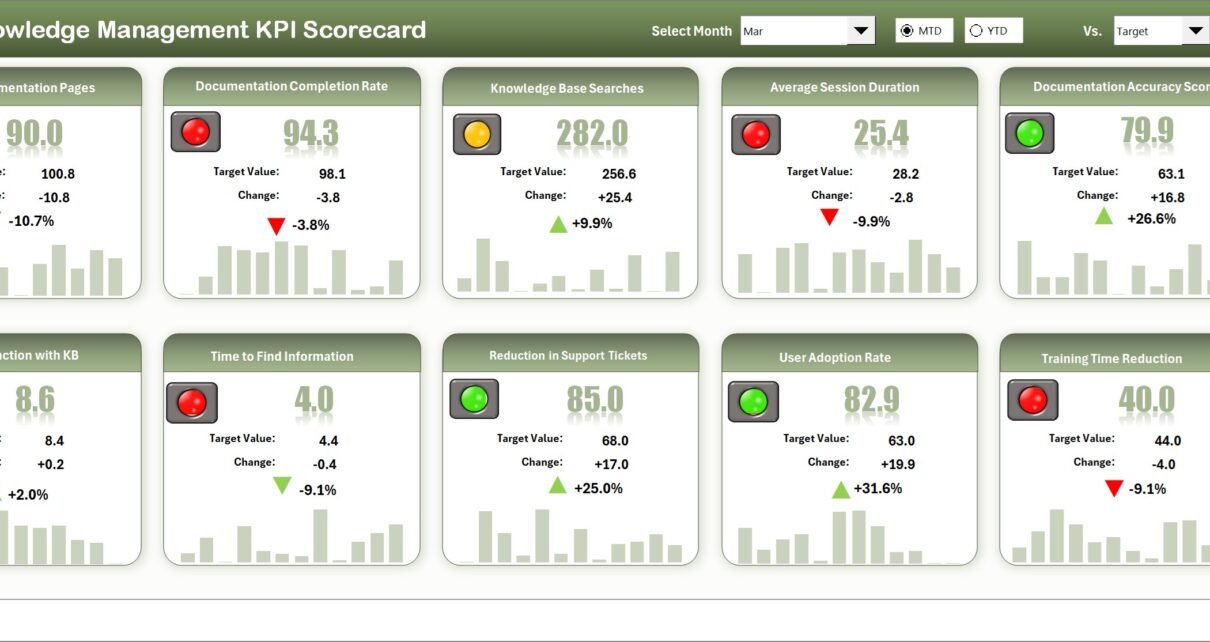
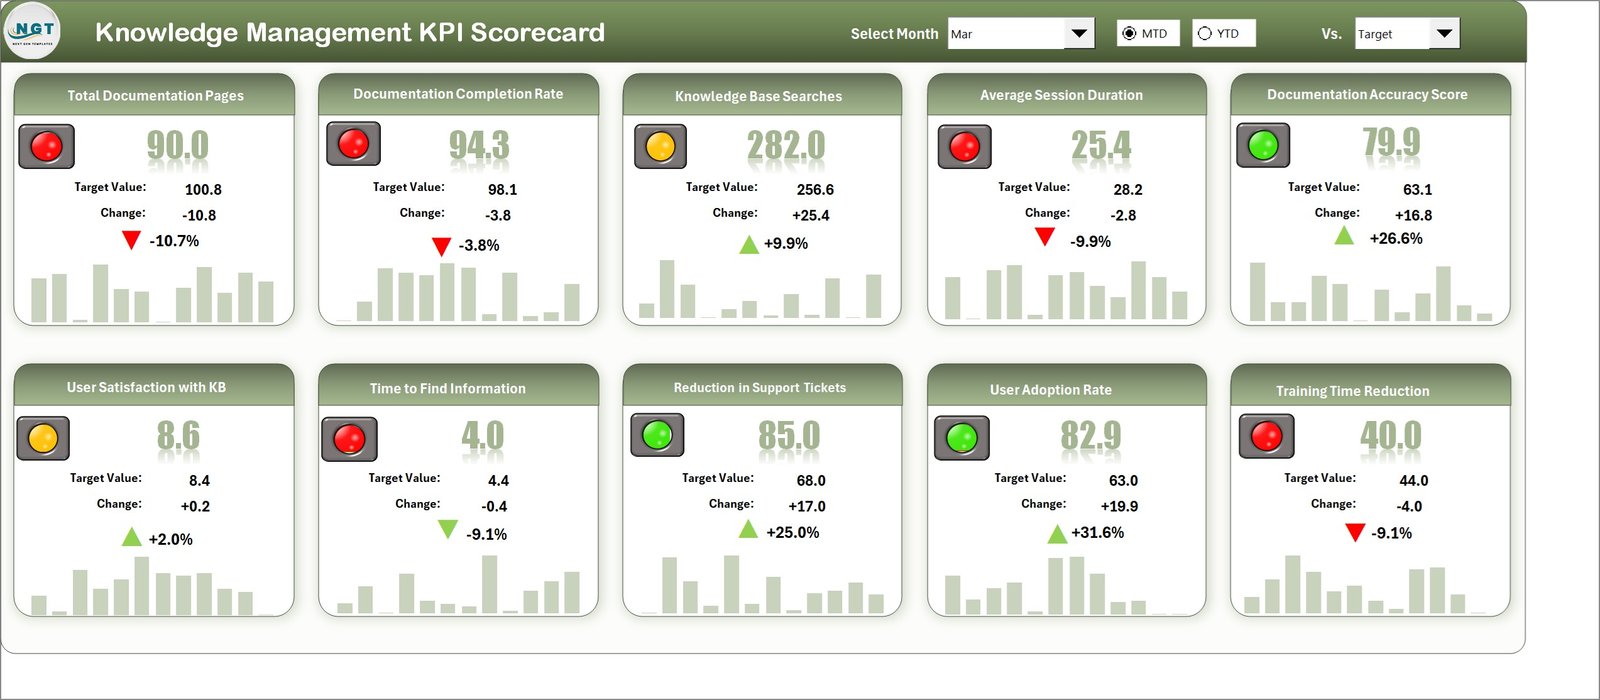
1. Scorecard Sheet
This is the main interface where you can view KPI performance at a glance.
- Dropdown Menus: Choose the month and toggle between MTD or YTD for performance context.
- Actual vs Target Values: Compare actuals against targets for each KPI.
- Visual Indicators: Color-coded visuals and conditional formatting show status quickly.
- Comprehensive Overview: See MTD and YTD comparisons for every KPI in one place.
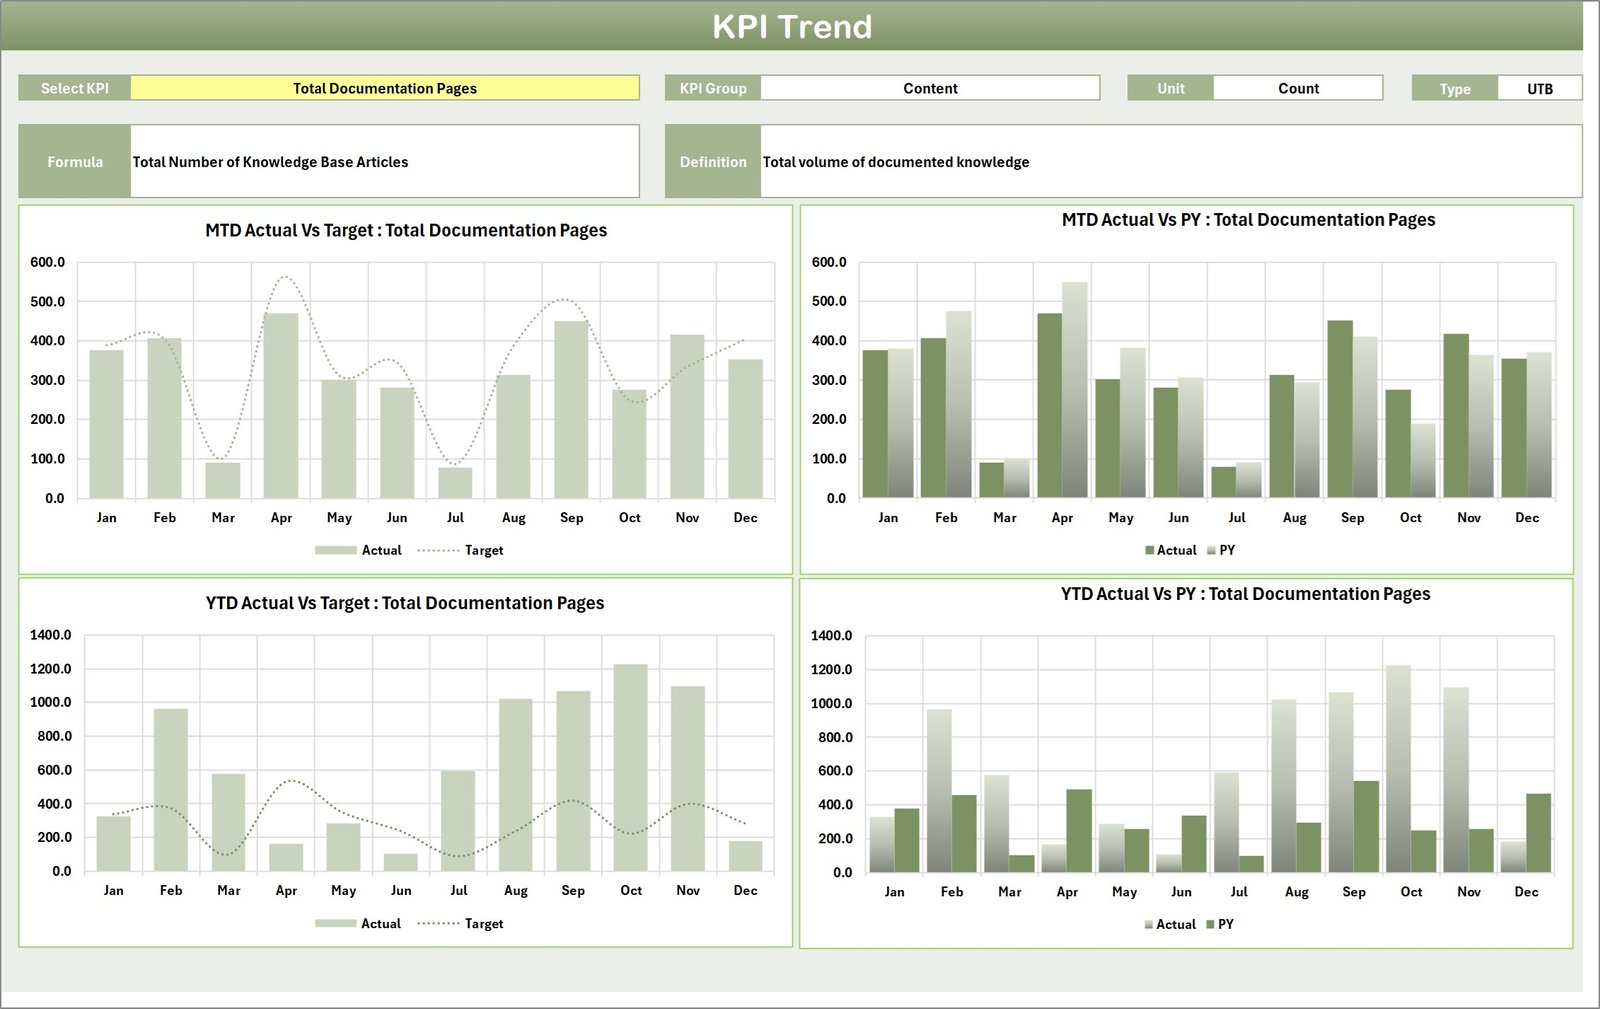
2. KPI Trend Sheet
Use this sheet to view trends and drill into any KPI over time.
- Select the KPI name from the dropdown in cell C3 to load details.
- View KPI Group, Unit, Type (Lower the Better or Upper the Better), Formula, and Definition.
- MTD and YTD trend charts display Actual, Target, and Prior Year (PY) values for easy comparison.
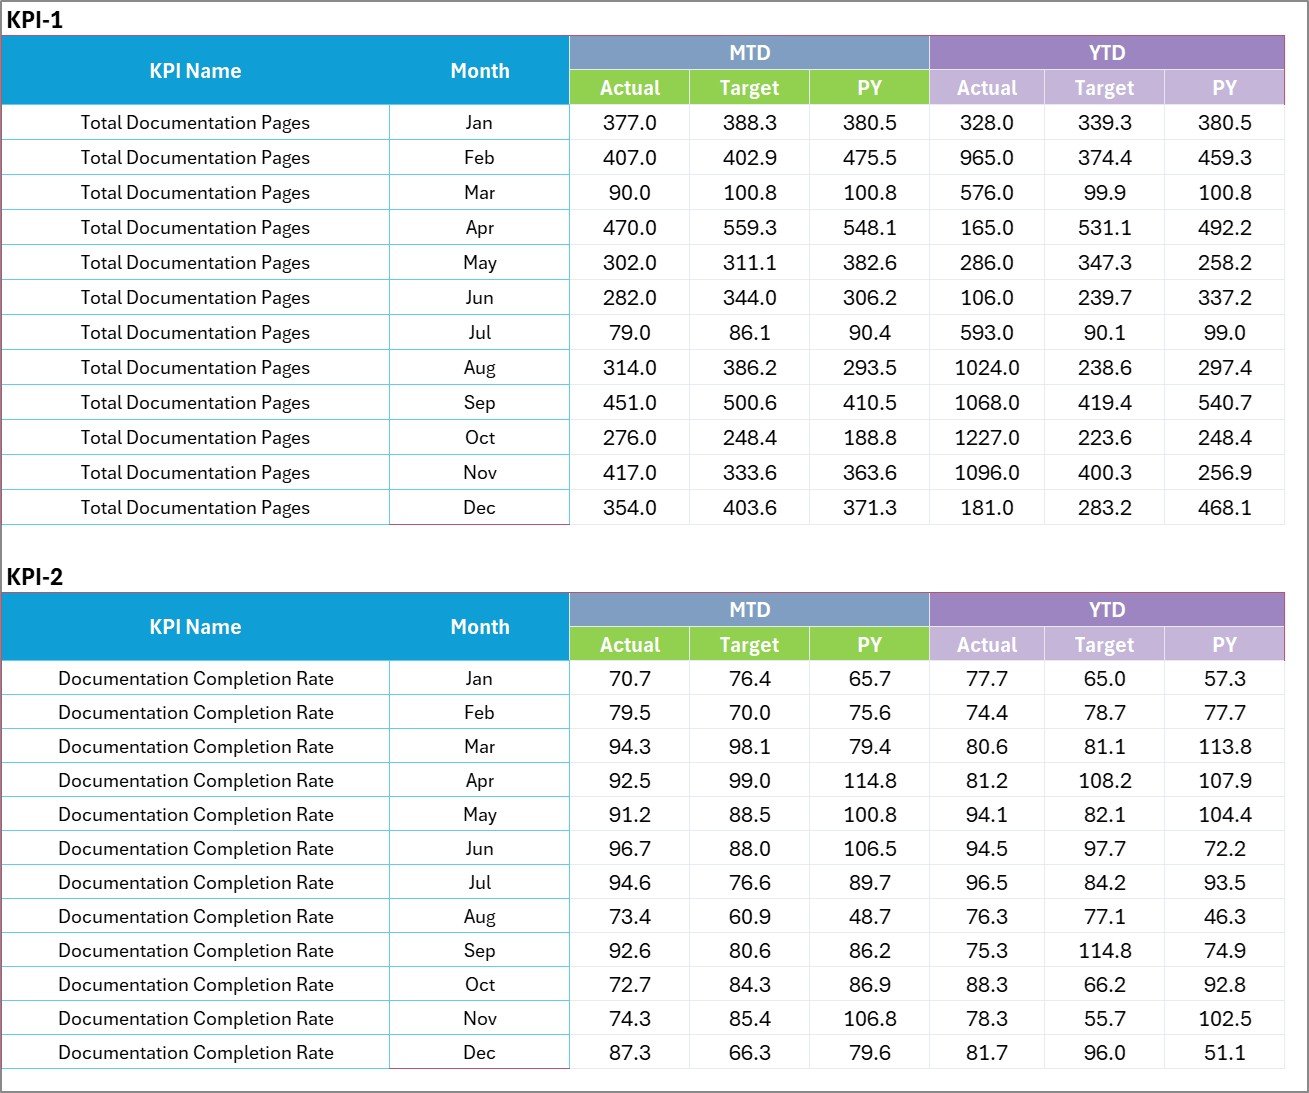
3. Input Data Sheet
This sheet is the single source of truth for all KPI values.
- Data Entry: Record Actual values, Targets, and other metrics for each KPI and period.
- Flexibility: The layout supports easy updates as new monthly results become available.
- Automation: Scorecard and trend charts pull from this sheet, so updating data refreshes the dashboards.
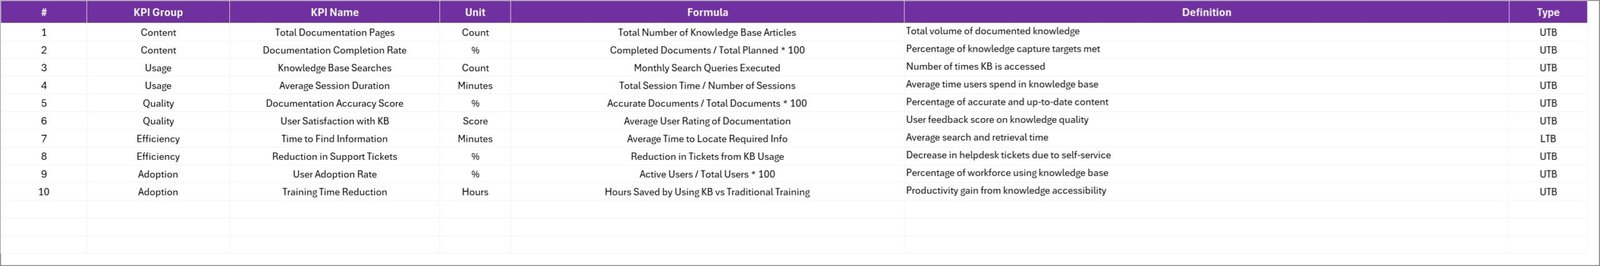
4. KPI Definition Sheet
Standardize and document every KPI to ensure consistent reporting.
- Enter KPI Name, KPI Group, Unit, Formula, and a clear KPI Definition.
- Definitions ensure stakeholders interpret KPIs consistently across the organization.
Advantages of Knowledge Management KPI Scorecard
- Fast deployment: Pre-built formulas and visuals reduce setup time.
- Clarity: Centralized KPIs and definitions reduce ambiguity.
- Actionable insights: Visual indicators make underperforming areas obvious.
- Scalable: Add new KPIs or time periods without redesigning the workbook.
Opportunities for Improvement
- Integrate with Power BI or other BI tools for interactive web dashboards.
- Automate data import from HR, LMS, or knowledge platforms using connectors or macros to reduce manual entry.
- Add permissions and version control if multiple contributors update the Input Data sheet.
- Expand KPI types to include qualitative measures (e.g., user satisfaction surveys) alongside quantitative KPIs.
Best Practices
- Define KPIs clearly on the KPI Definition sheet before tracking begins.
- Use consistent time windows (MTD/YTD) so trends are comparable.
- Review targets quarterly to keep them aligned with strategic goals.
- Share the scorecard with stakeholders and schedule regular reviews to drive action.
FAQs
What is the Knowledge Management KPI Scorecard?
It is an Excel template that centralizes KM KPIs, showing actuals vs targets, trends, and definitions to support decision-making.
Can I add my own KPIs?
Yes. Use the KPI Definition sheet to add new KPIs, then populate the Input Data sheet so dashboards update automatically.
Does this support automated data feeds?
Out of the box it uses manual entry, but you can connect it to automated feeds via Power Query, macros, or external BI tools.
How do I interpret color indicators?
Indicators are typically set so green means meeting/exceeding target, yellow for near-target, and red for below target. Adjust thresholds on the Scorecard sheet if needed.
Can I use this with Power BI?
Yes — export or link the Input Data sheet to Power BI for advanced visualizations and interactive reporting.
Conclusion
The Knowledge Management KPI Scorecard is a practical template to start tracking and improving KM outcomes quickly. With defined KPIs, centralized data input, and clear visuals, teams can focus on closing gaps and demonstrating KM value.
Click to Purchases Knowledge Management KPI Scorecard in Excel
SEO & Sharing
Suggested SEO Title: Knowledge Management KPI Scorecard — Ready-to-Use Excel Template
Suggested URL Slug: /knowledge-management-kpi-scorecard
Resources: For more on KPIs and dashboards, see Microsoft’s guide to Power BI KPIs: https://learn.microsoft.com/en-us/power-bi/create-reports/service-kpis.
Visit our YouTube channel to watch the demo. Youtube.com/@NextGenTemplates