Astrology apps have become extremely popular in recent years. Millions of users open astrology apps every day to check horoscopes, zodiac predictions, birth charts, compatibility reports, and spiritual guidance. Because of this growing demand, astrology app developers and businesses must track user behavior, revenue, engagement, and performance carefully.
However, many organizations still store app data across multiple spreadsheets, reports, and analytics tools. As a result, analyzing user engagement, subscription revenue, and app performance becomes difficult. Therefore, businesses increasingly use data dashboards to monitor key metrics in one centralized place.
Click to Purchases Astrology Apps Dashboard in Excel
The Astrology Apps Dashboard in Excel provides a powerful and ready-to-use analytical solution. This dashboard converts raw astrology app data into meaningful charts, KPIs, and visual insights. Because Excel automatically updates charts when new data is entered, users can quickly monitor performance and identify trends.
In this article, you will learn everything about the Astrology Apps Dashboard in Excel, including its features, structure, advantages, best practices, and frequently asked questions.
What Is an Astrology Apps Dashboard in Excel?
An Astrology Apps Dashboard in Excel is a data visualization tool designed to analyze the performance of astrology applications using key metrics such as:
-
App usage
-
User engagement
-
Revenue
-
Subscription trends
-
Platform performance
-
Zodiac preferences
This dashboard collects app data in a structured format and then converts it into visual charts and KPI cards. As a result, app owners and analysts can quickly evaluate performance without manually analyzing large datasets.
Moreover, Excel dashboards allow users to apply filters and slicers. Therefore, decision-makers can instantly analyze specific platforms, features, or user segments.
Why Do Astrology Apps Need a Data Dashboard?
Astrology apps generate large amounts of user data daily. For example, users interact with different horoscope features, purchase premium subscriptions, and access personalized reports.
Without proper analytics, companies struggle to answer important questions such as:
-
Which astrology features do users prefer most?
-
Which platform generates more revenue?
-
Which zodiac sign group engages more with the app?
-
How long do users stay in the app?
-
Which referral sources bring the most users?
Therefore, a dashboard provides a centralized reporting system that helps businesses analyze all these metrics efficiently.
Key Features of the Astrology Apps Dashboard in Excel
The Astrology Apps Dashboard in Excel offers several powerful features that simplify analytics and reporting.
1. Ready-to-Use Excel Template
The dashboard comes with a structured Excel template. Users only need to enter data in the data sheet. After that, charts and metrics update automatically.
2. Interactive Slicers
Each dashboard page includes slicers on the right side. These slicers allow users to filter data by various categories instantly.
3. Multi-Page Analytical Dashboard
The dashboard includes multiple analytical pages. Therefore, users can analyze different aspects of the astrology app.
4. Visual Charts and KPIs
The dashboard converts raw data into easy-to-understand charts. Consequently, users can analyze trends without complicated calculations.
5. Structured Data Management
The template includes a Data Sheet and Support Sheet, which organize the data and ensure smooth dashboard operation.
Structure of the Astrology Apps Dashboard in Excel
The dashboard contains five analytical pages, along with supporting sheets that store the underlying data.
Let us explore each page in detail.
Click to Purchases Astrology Apps Dashboard in Excel
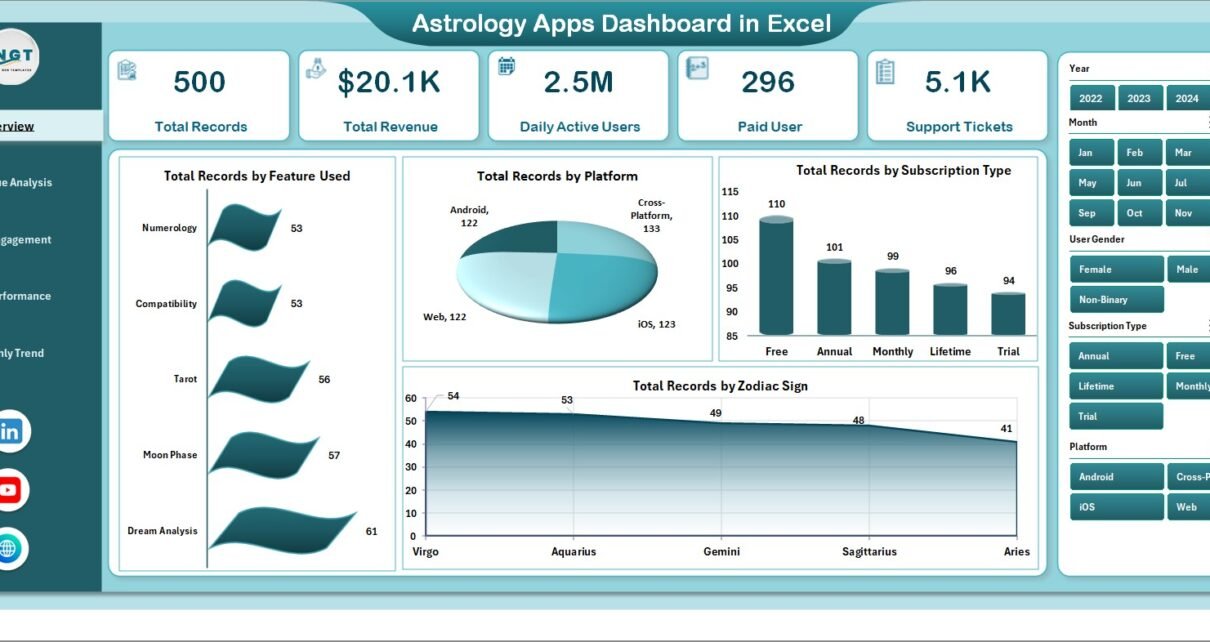
Overview Page: What Does the Main Dashboard Show?
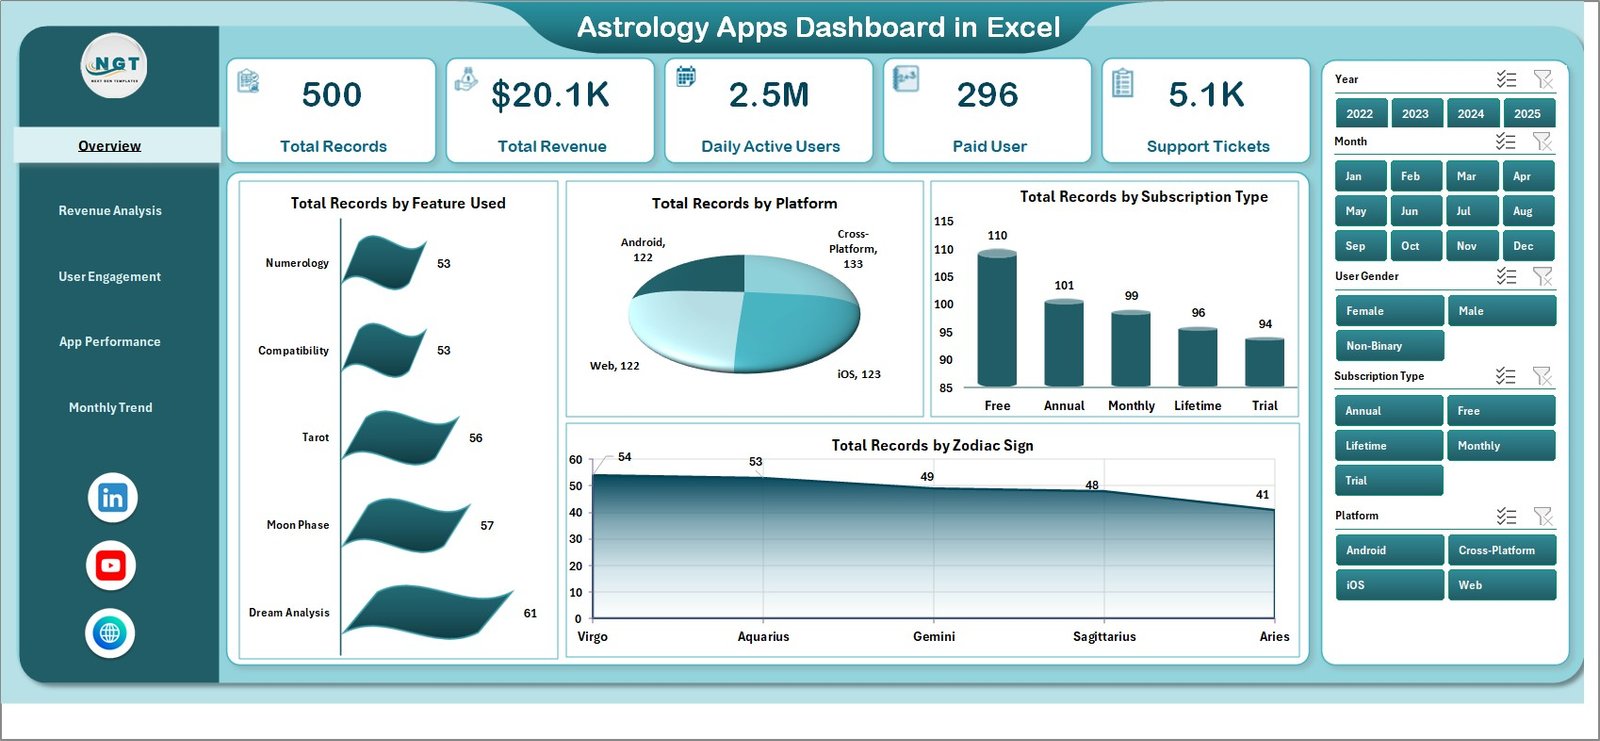
The Overview Page acts as the central summary of the astrology app analytics.
This page includes:
-
Right-side slicers for interactive filtering
-
Four KPI cards
-
Multiple charts showing key usage metrics
Charts Available on the Overview Page
The page displays the following charts:
1. Total Record by Feature Used
This chart shows which features users interact with the most. Examples include:
-
Daily horoscope
-
Birth chart analysis
-
Zodiac compatibility
-
Tarot reading
As a result, developers can identify the most popular features.
2. Total Record by Platform
This chart compares user activity across different platforms such as:
-
Android
-
iOS
-
Web
Therefore, businesses can identify which platform generates more engagement.
3. Total Record by Subscription Type
This chart analyzes user distribution across subscription types such as:
-
Free users
-
Monthly subscription
-
Annual subscription
Consequently, businesses can evaluate subscription conversion.
4. Total Record by Zodiac Sign
This visualization shows engagement by zodiac sign. As a result, businesses can analyze which zodiac users interact with the app more frequently.
Revenue Analysis Page: How Does the Dashboard Track Revenue?
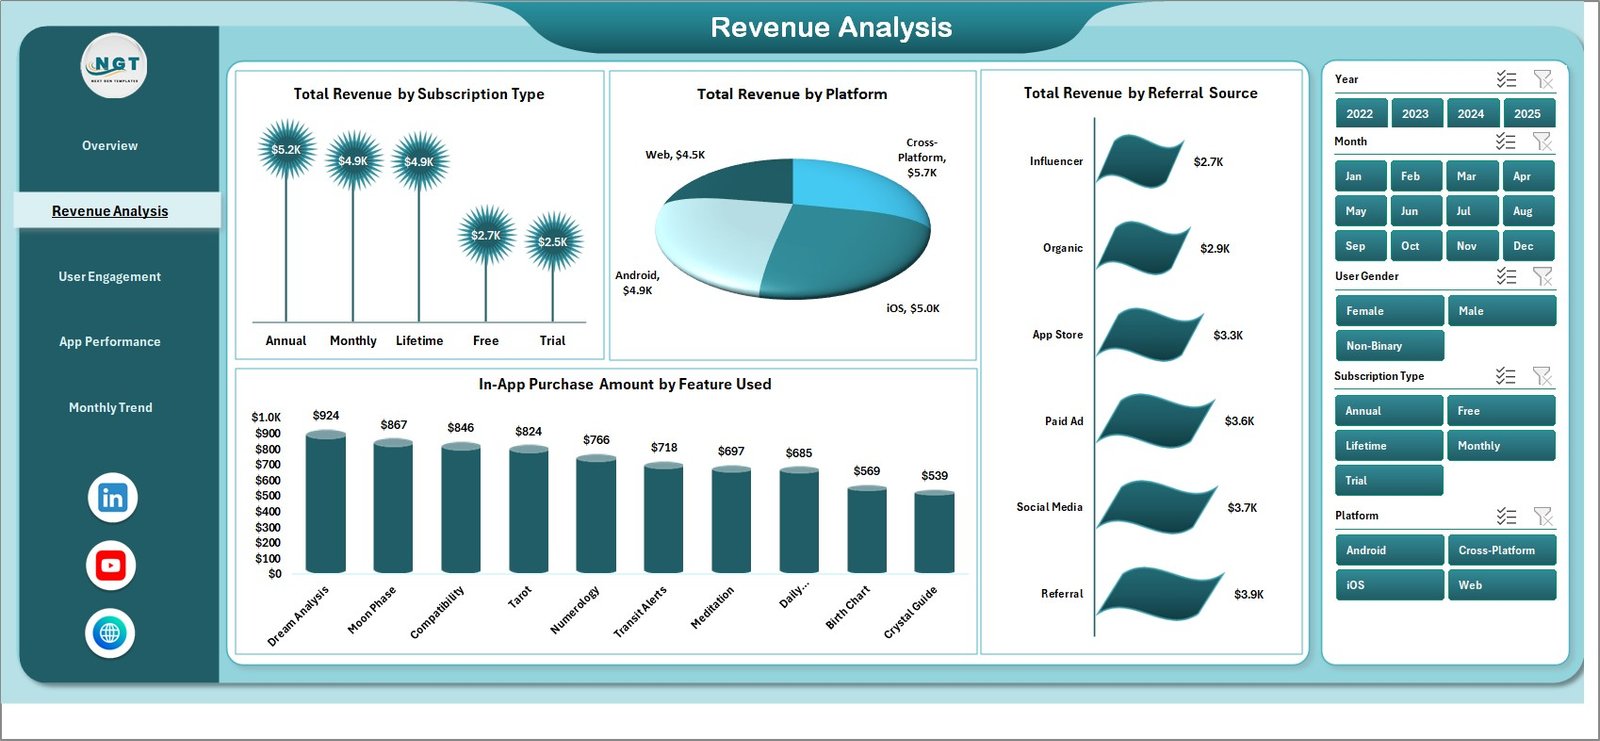
Revenue plays a critical role in the success of astrology apps. Therefore, the Revenue Analysis Page provides detailed insights into monetization.
This page includes interactive slicers and four key charts.
Charts in the Revenue Analysis Page
1. Total Record by Subscription Type
This chart analyzes the number of users under each subscription plan.
2. Total Revenue by Platform
This chart compares revenue generated from:
-
Android users
-
iOS users
-
Web users
Therefore, businesses can identify the most profitable platform.
3. Total Revenue by Referral Source
Users often install apps through different channels such as:
-
Social media
-
Paid advertising
-
App store search
-
Referral programs
This chart helps businesses identify the most effective marketing channels.
4. In-App Purchases Amount by Feature Used
Many astrology apps monetize through in-app purchases such as:
-
Personalized horoscope reports
-
Tarot readings
-
Birth chart analysis
-
Compatibility reports
This chart shows which features generate the highest purchase revenue.
Click to Purchases Astrology Apps Dashboard in Excel
User Engagement Page: How Can You Measure User Activity?
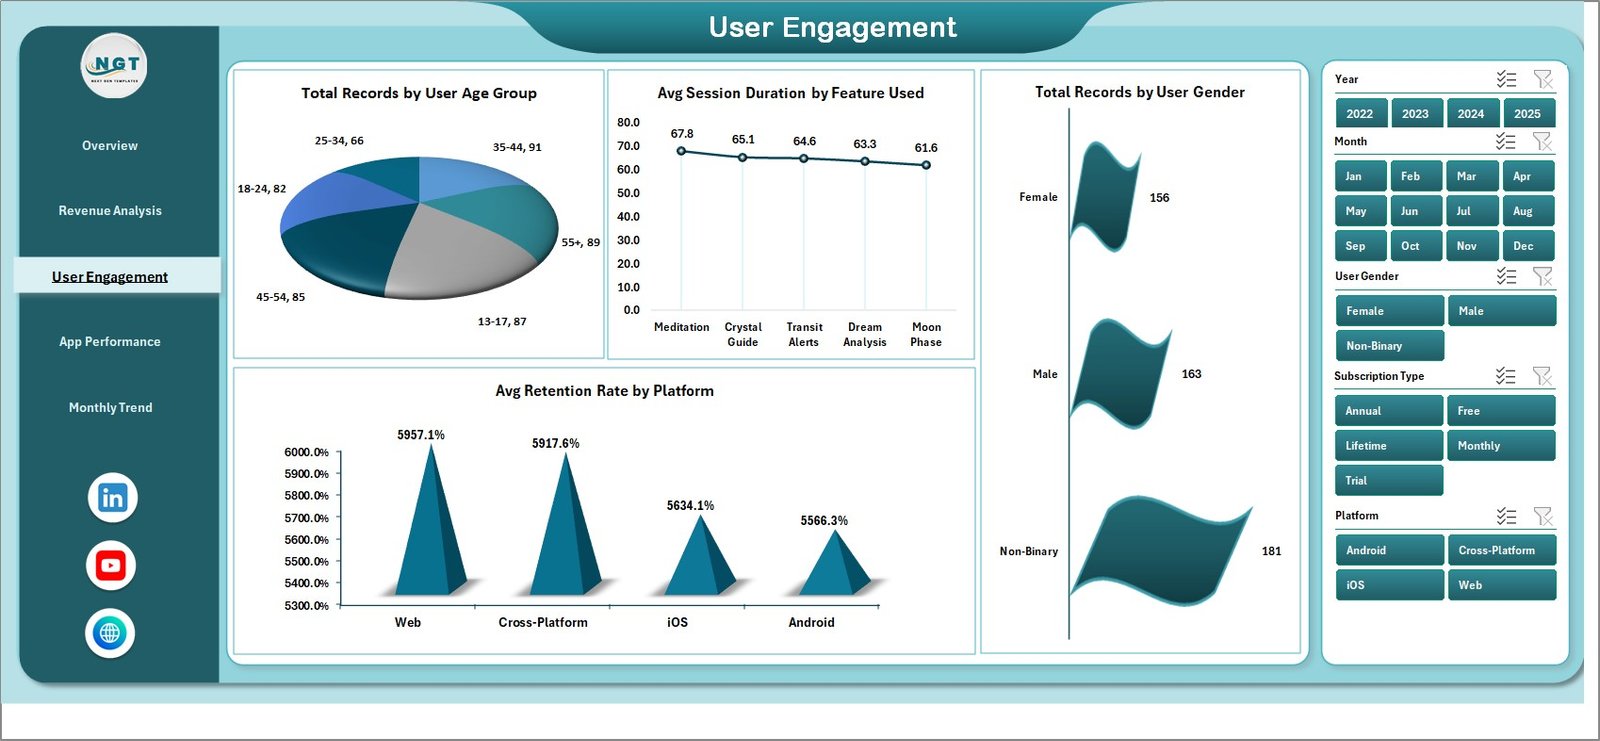
User engagement determines whether an astrology app succeeds in the long term. Therefore, the User Engagement Page analyzes how users interact with the application.
This page contains slicers and four engagement charts.
Charts in the User Engagement Page
1. Total Record by User Age Group
This chart shows which age groups use the astrology app the most.
For example:
-
18–24
-
25–34
-
35–44
-
45+
Consequently, businesses can target marketing campaigns effectively.
2. Average Session Duration by Feature Used
This chart analyzes how long users stay in the app while using specific features.
Longer session duration often indicates higher engagement.
3. Total Record by User Gender
This visualization compares engagement across gender groups.
As a result, marketers can tailor campaigns accordingly.
4. Average Retention Rate by Platform
Retention rate measures how many users continue using the app over time. Therefore, this chart helps identify platform-specific engagement patterns.
Click to Purchases Astrology Apps Dashboard in Excel
App Performance Page: How Does the Dashboard Monitor App Health?
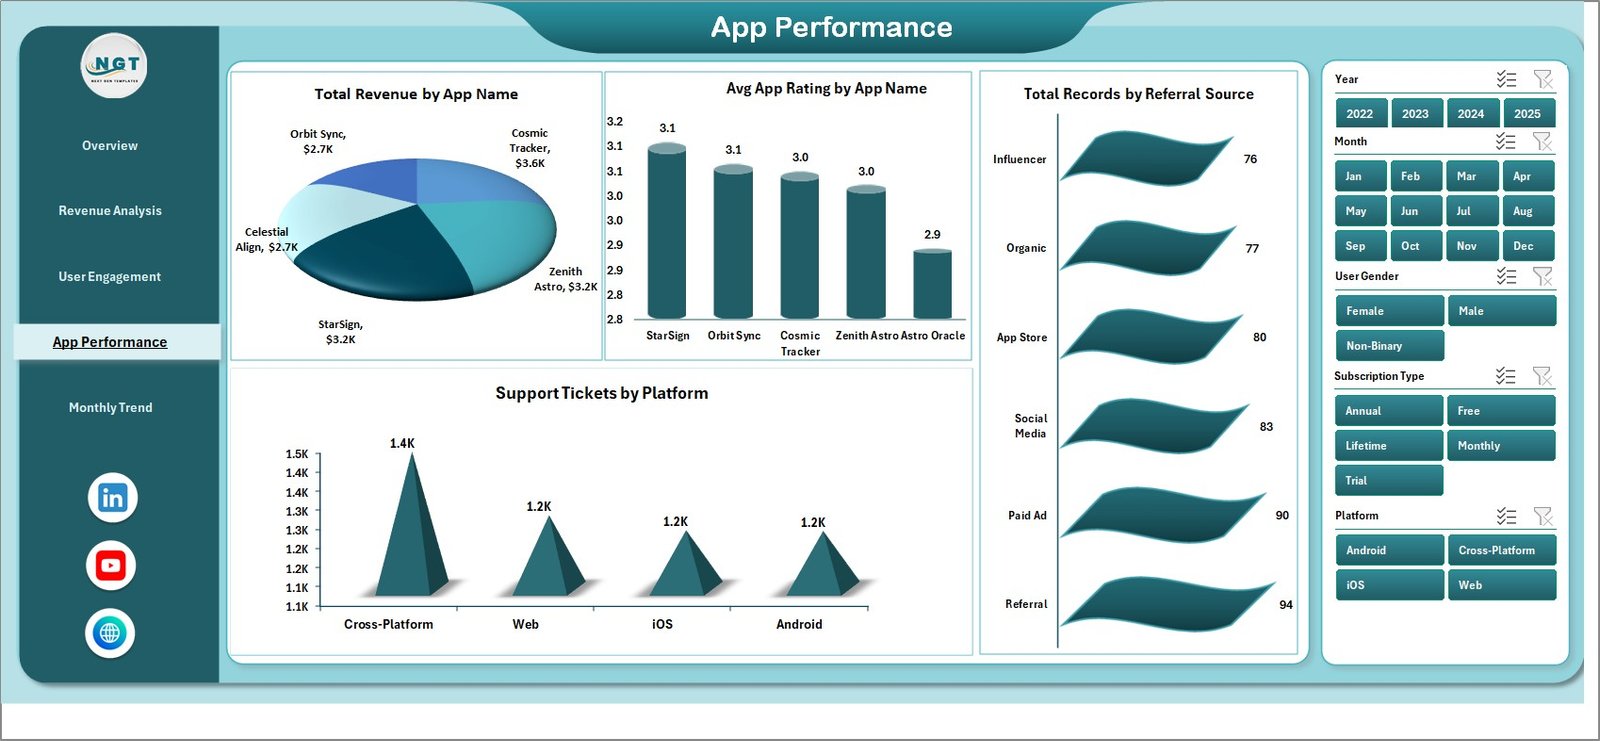
The App Performance Page focuses on technical and operational performance.
This page includes slicers and four charts.
Charts in the App Performance Page
1. Total Record by User App Name
This chart analyzes the usage of different astrology apps or app versions.
2. Average App Rating by App Name
User ratings play a crucial role in app store rankings. Therefore, this chart helps monitor customer satisfaction.
3. Total Record by Referral Source
This chart highlights how users discover the app.
4. Support Tickets by Platform
Support tickets reveal common user problems. Therefore, this metric helps businesses improve the user experience.
Month Analysis Page: How Does the Dashboard Show Monthly Trends?
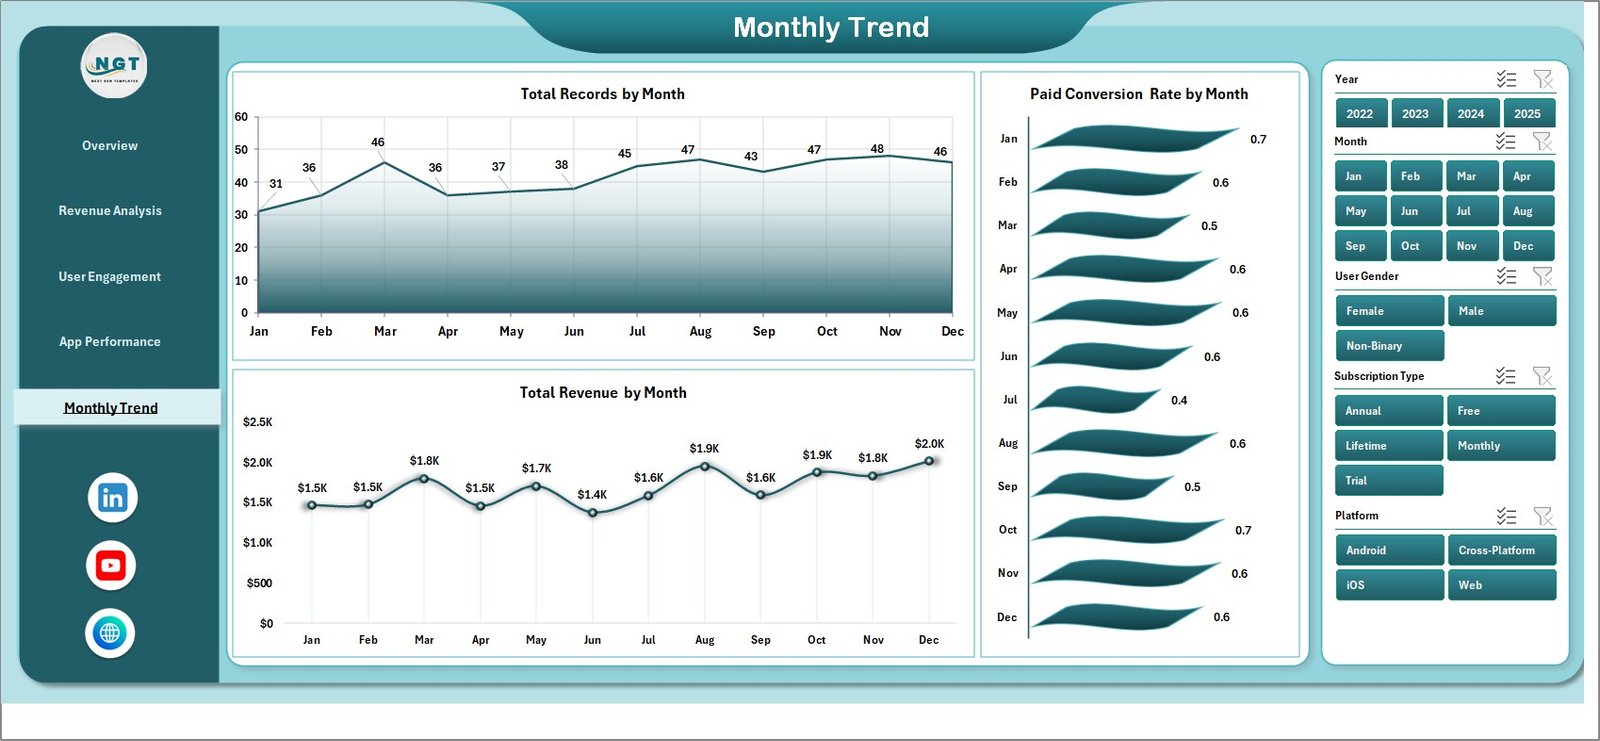
The Month Analysis Page helps businesses track trends over time.
This page includes three important charts:
1. Total Record by Month
This chart tracks overall user activity across months.
2. Paid Conversion Rate by Month
This metric shows the percentage of free users who upgrade to paid subscriptions.
3. Total Revenue by Month
This chart helps businesses analyze revenue growth trends.
Consequently, businesses can measure the impact of marketing campaigns and product updates.
Data Sheet and Support Sheet
Click to Purchases Astrology Apps Dashboard in Excel
The dashboard includes two important supporting sheets.
Data Sheet
The Data Sheet stores raw app data such as:
-
User information
-
Platform
-
Subscription type
-
Feature usage
-
Revenue
-
Session duration
-
Referral source
Once users enter data here, the dashboard automatically updates.
Support Sheet
The Support Sheet stores supporting calculations, pivot tables, and lookup values that power the dashboard.
Advantages of the Astrology Apps Dashboard in Excel
Using a dashboard provides several benefits for astrology app developers and analysts.
Centralized Analytics
The dashboard stores all analytics in one place. Therefore, users no longer need multiple reports.
Faster Decision Making
Visual charts allow decision-makers to analyze trends quickly.
Improved Revenue Tracking
Businesses can track subscriptions and in-app purchases easily.
Better User Insights
The dashboard reveals valuable insights about user behavior.
Performance Monitoring
Developers can track ratings, support tickets, and platform performance.
Easy Customization
Excel dashboards allow businesses to customize charts and KPIs based on their needs.
Best Practices for the Astrology Apps Dashboard in Excel
To get the best results from this dashboard, follow these best practices.
Maintain Accurate Data
Always ensure that the data sheet contains accurate information. Incorrect data leads to incorrect insights.
Update Data Regularly
Update the dashboard frequently so that analytics reflect current performance.
Use Filters Effectively
Use slicers to analyze different segments such as:
-
Platforms
-
Age groups
-
Features
-
Subscription types
Monitor Key Metrics
Focus on important KPIs such as:
-
User retention
-
Subscription conversion
-
Revenue growth
-
Feature engagement
Analyze Trends Monthly
Monthly analysis helps identify growth patterns and potential issues.
Improve Based on Insights
Use dashboard insights to improve features, marketing strategies, and user experience.
Who Can Use the Astrology Apps Dashboard in Excel?
This dashboard benefits many professionals.
App Developers
Developers can monitor app performance and feature usage.
Product Managers
Product managers can analyze user engagement and retention.
Marketing Teams
Marketing teams can evaluate referral sources and campaign performance.
Business Analysts
Analysts can track revenue trends and subscription conversions.
Startup Founders
Startup founders can monitor overall app growth and profitability.
Conclusion
The popularity of astrology apps continues to grow worldwide. However, managing user engagement, subscription revenue, and app performance requires clear data insights.
The Astrology Apps Dashboard in Excel provides a powerful solution for analyzing app data efficiently. Because it combines multiple charts, KPI cards, and interactive filters, users can quickly understand performance trends.
Moreover, the dashboard helps businesses identify growth opportunities, improve user engagement, and optimize monetization strategies.
Therefore, whether you manage a small astrology startup or a large astrology platform, this dashboard can significantly improve your analytics capabilities.
Frequently Asked Questions (FAQs)
What is an Astrology Apps Dashboard in Excel?
An Astrology Apps Dashboard in Excel is a reporting tool that analyzes astrology app data using charts, KPIs, and filters.
Why should businesses use an astrology app dashboard?
Businesses use dashboards to track user engagement, subscription revenue, feature usage, and app performance.
Can beginners use this Excel dashboard?
Yes. The dashboard is user-friendly. Users only need to enter data in the data sheet, and the dashboard updates automatically.
Can the dashboard track revenue from subscriptions?
Yes. The dashboard includes charts for subscription revenue, in-app purchases, and revenue by platform.
Can the dashboard analyze user engagement?
Yes. It includes metrics such as session duration, retention rate, and engagement by age group.
Can the dashboard be customized?
Yes. Because the dashboard is built in Excel, users can modify charts, KPIs, and calculations according to their needs.
Visit our YouTube channel to learn step-by-step video tutorials