In today’s healthcare environment, cardiology institutes must track performance with precision. Hospitals and cardiac care centers deal with life-critical cases daily. Therefore, they need real-time insights into patient outcomes, treatment efficiency, and operational performance. However, many institutes still rely on scattered reports and manual tracking systems. As a result, decision-making becomes slow and less effective.Cardiology Institutes KPI Dashboard in Excel..
To solve this challenge, organizations increasingly use data-driven dashboards. One of the most powerful and accessible tools is the Cardiology Institutes KPI Dashboard in Excel. This dashboard helps healthcare professionals monitor key performance indicators (KPIs), improve patient care, and streamline operations.
In this detailed guide, you will learn everything about this dashboard, including its features, benefits, best practices, and frequently asked questions.Cardiology Institutes KPI Dashboard in Excel
Click to buy Cardiology Institutes KPI Dashboard in Excel
What is a Cardiology Institutes KPI Dashboard in Excel?
A Cardiology Institutes KPI Dashboard in Excel is an interactive reporting tool designed to track and analyze the performance of cardiology departments. It collects data from multiple sources and presents it in a structured and visual format.
With this dashboard, healthcare managers can:
- Monitor patient treatment outcomes
- Track operational efficiency
- Compare actual performance with targets
- Analyze trends over time
Because Excel is widely used, this dashboard offers flexibility, ease of use, and powerful analytics without requiring advanced technical skills.
Why Do Cardiology Institutes Need a KPI Dashboard?
Cardiology departments handle complex procedures such as angioplasty, bypass surgeries, and cardiac diagnostics. Therefore, tracking performance manually becomes difficult.
Without a proper dashboard:
- Important KPIs may get overlooked
- Decision-making becomes delayed
- Data inconsistencies increase
- Performance tracking lacks accuracy
On the other hand, a KPI dashboard provides a centralized system. As a result, managers can quickly identify issues and take corrective actions.
Key Features of the Cardiology Institutes KPI Dashboard in Excel
This dashboard is designed with 7 powerful worksheets that work together to deliver complete insights.
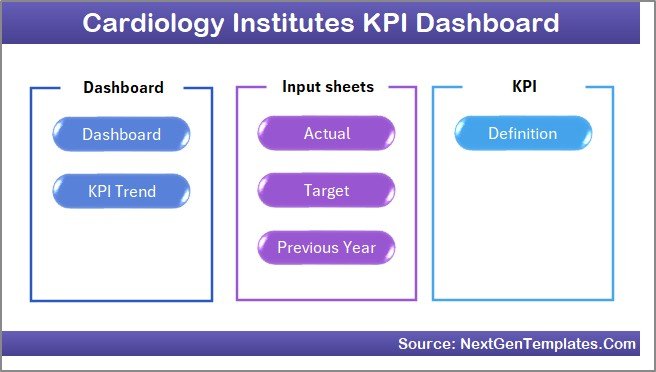
Summary Page – Easy Navigation
The Summary Page acts as an index sheet.
Key Highlights:
- Contains 6 navigation buttons
- Allows quick access to all sheets
- Improves user experience
- Saves time while switching between reports
Because of this structure, users can easily navigate without confusion.
Click to buy Cardiology Institutes KPI Dashboard in Excel
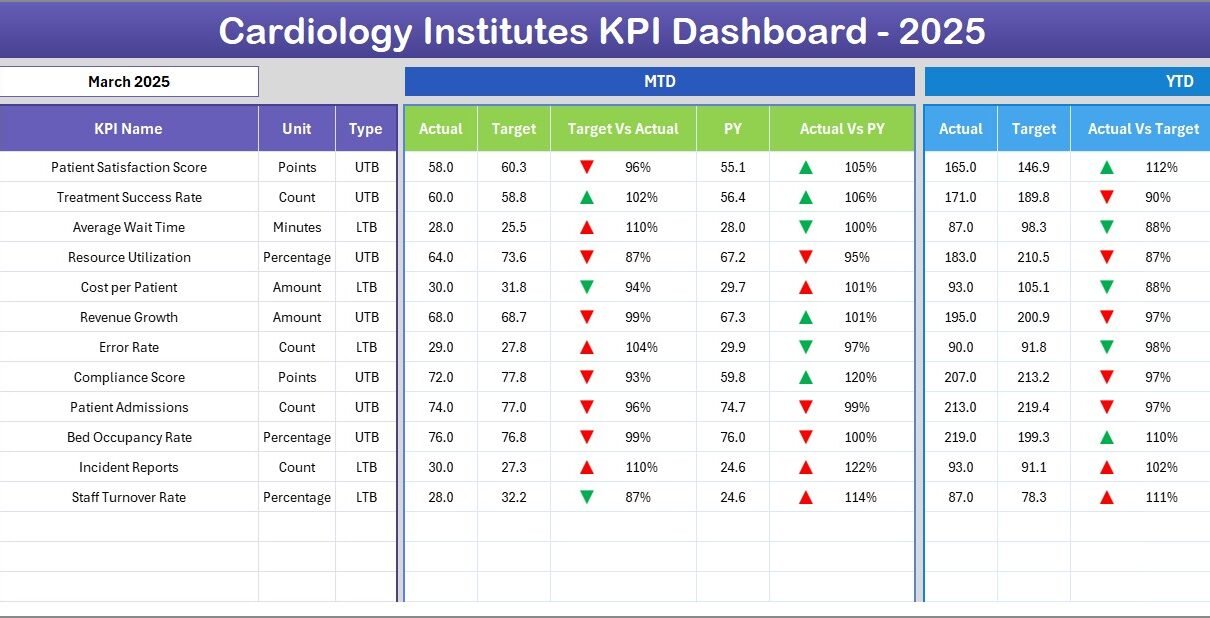
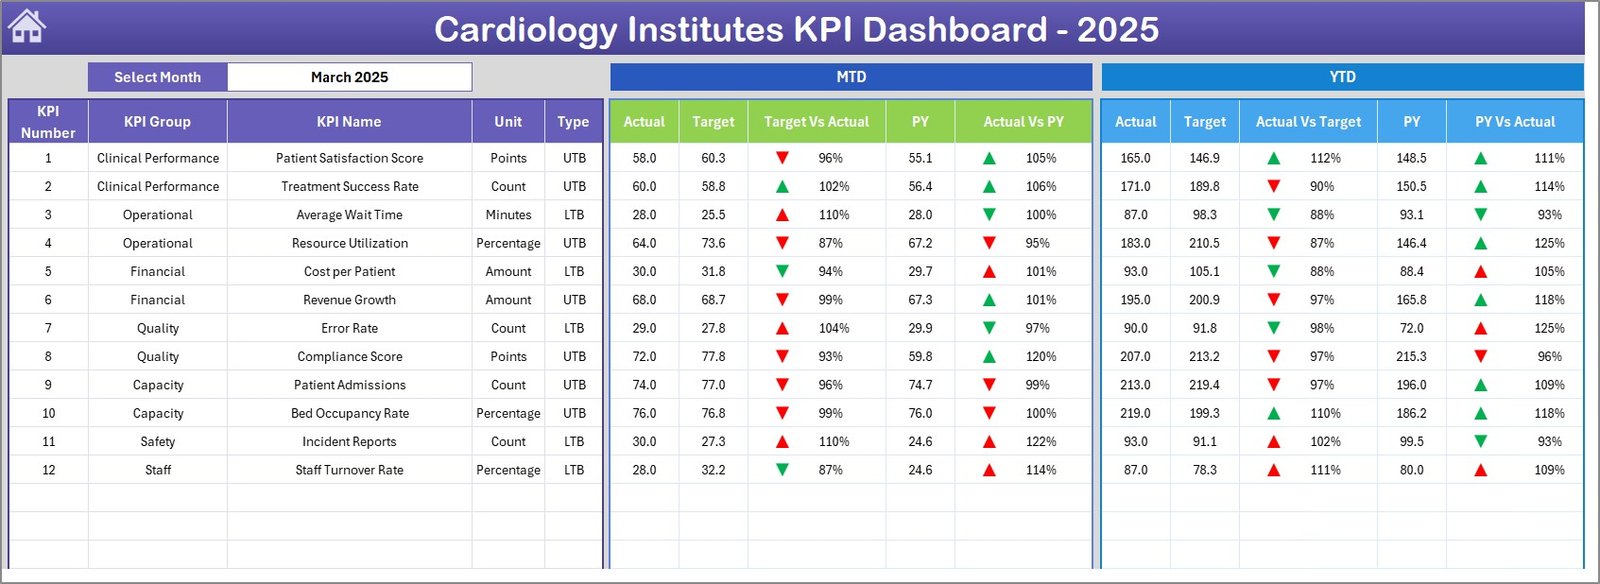
Dashboard Sheet – Central Performance Overview
This is the main sheet where all KPI insights are displayed.
Key Features:
- Month selection from dropdown (Cell D3)
- Dynamic updates based on selected month
- Displays:
- MTD (Month-to-Date) Actual, Target, Previous Year
- YTD (Year-to-Date) Actual, Target, Previous Year
- Comparison metrics:
- Target vs Actual
- Previous Year vs Actual
- Visual indicators using:
- Up arrows (good performance)
- Down arrows (needs improvement)
Therefore, decision-makers can quickly understand performance at a glance.
Click to buy Cardiology Institutes KPI Dashboard in Excel
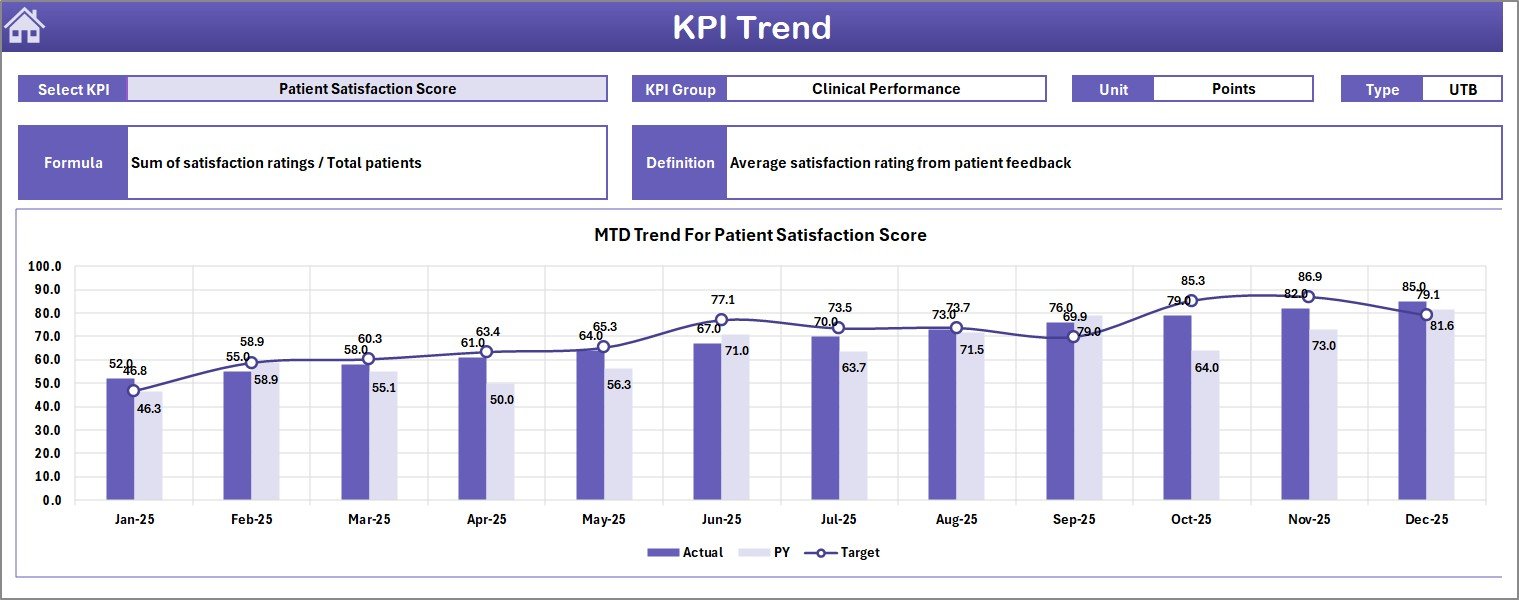
Trend Sheet – KPI Performance Analysis
This sheet provides detailed KPI-level insights.
Key Features:
- KPI selection dropdown (Cell C3)
- Displays:
KPI Group
Unit of measurement
KPI Type (LTB or UTB)
Formula
Definition
Visual Analysis:
- MTD Trend Chart
- YTD Trend Chart
- Comparison of Actual vs Target vs Previous Year
As a result, users can analyze performance trends and identify patterns.
Click to buy Cardiology Institutes KPI Dashboard in Excel
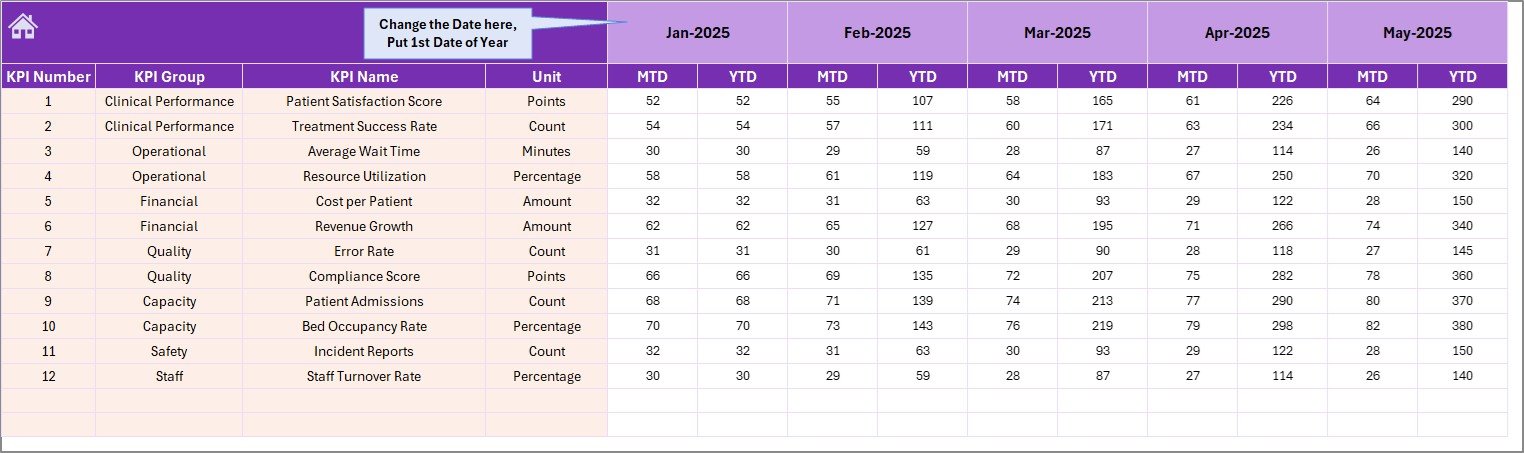
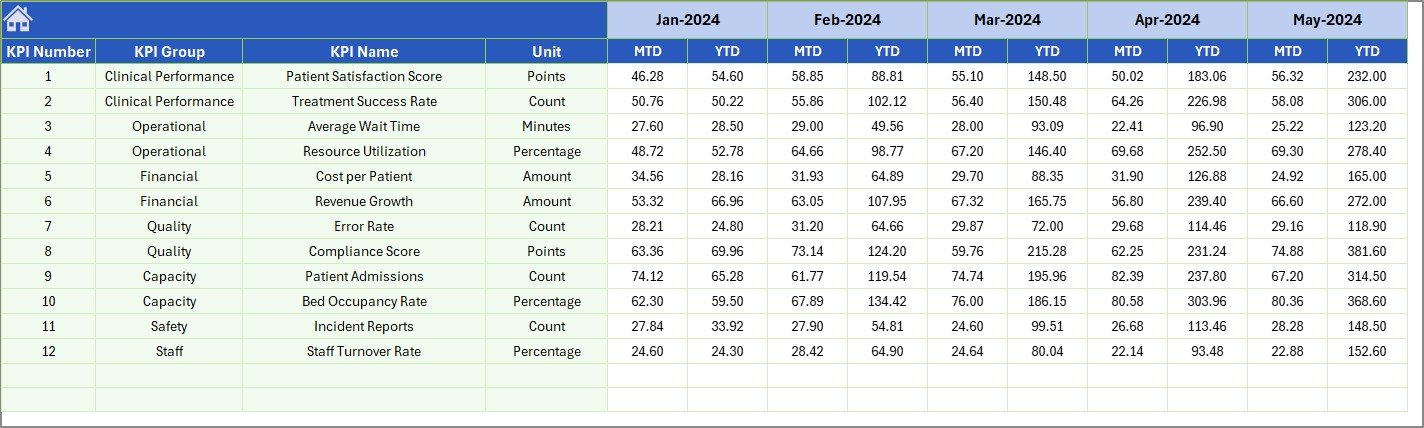
Actual Numbers Input Sheet – Data Entry
This sheet allows users to input actual performance data.
Key Features:
- Enter MTD and YTD values
- Month selection in Cell E1
- Automatic updates across dashboard
Because of this structured input, data remains consistent and accurate.
Click to buy Cardiology Institutes KPI Dashboard in Excel
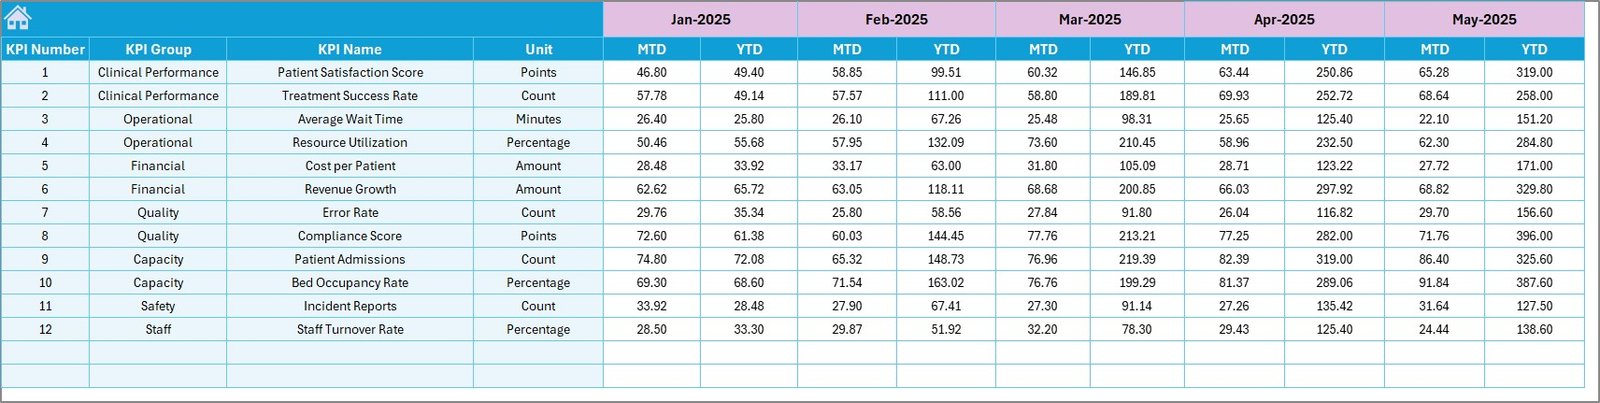
Target Sheet – Performance Goals
In this sheet, users define performance targets.
Key Features:
- Monthly target entry
- Separate fields for MTD and YTD
- Supports KPI comparison
Therefore, institutes can set realistic goals and track progress effectively.
Click to buy Cardiology Institutes KPI Dashboard in Excel
Previous Year Numbers Sheet – Historical Comparison
This sheet stores past performance data.
Key Features:
- Input previous year values
- Enables year-over-year comparison
- Helps identify growth trends
As a result, decision-makers can evaluate long-term performance.
Click to buy Cardiology Institutes KPI Dashboard in Excel
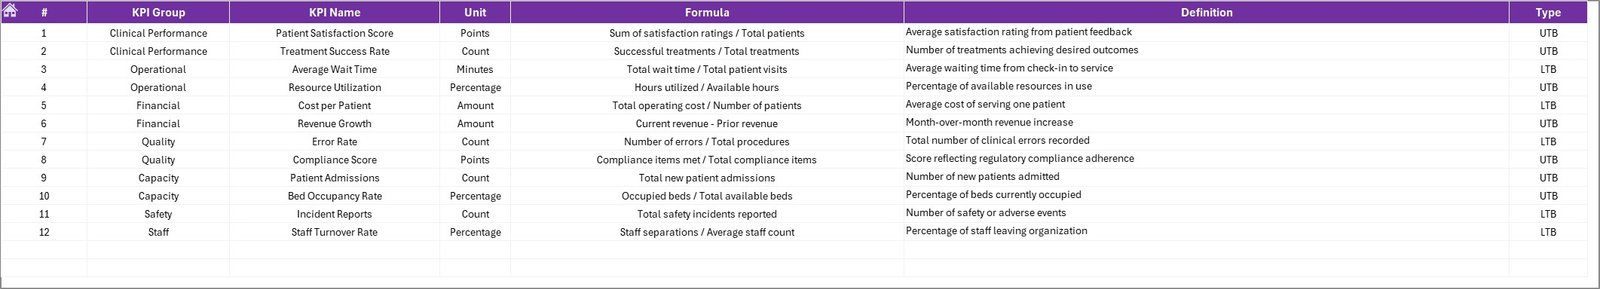
KPI Definition Sheet – KPI Management
This sheet defines all KPIs used in the dashboard.
Key Features:
- KPI Name
- KPI Group
- Unit
- Formula
- Definition
Because of this, users can clearly understand each KPI and its importance.
Click to buy Cardiology Institutes KPI Dashboard in Excel
What KPIs Can Be Tracked in a Cardiology Dashboard?
A cardiology KPI dashboard can track various critical metrics such as:
Clinical KPIs:
- Patient survival rate
- Readmission rate
- Procedure success rate
- Average treatment time
Operational KPIs:
- Bed occupancy rate
- Average waiting time
- Staff utilization rate
Financial KPIs:
- Cost per patient
- Revenue per procedure
- Equipment utilization cost
Quality KPIs:
- Patient satisfaction score
- Error rate
- Compliance rate
Therefore, this dashboard provides a complete performance view.
How Does the Dashboard Improve Decision-Making?
The dashboard transforms raw data into actionable insights.
Key Benefits:
- Provides real-time performance tracking
- Highlights areas needing improvement
- Supports data-driven decisions
- Reduces manual reporting effort
As a result, cardiology institutes can improve both efficiency and patient outcomes.
Advantages of Cardiology Institutes KPI Dashboard in Excel
Using this dashboard offers several advantages.
Improved Data Visibility
- Centralized data view
- Easy access to KPIs
- Better understanding of performance
Faster Decision-Making
- Real-time insights
- Quick identification of issues
- Immediate action planning
Performance Tracking
- Track MTD and YTD progress
- Compare with targets and previous year
- Monitor trends over time
User-Friendly Interface
- Simple Excel-based design
- Easy navigation
- No advanced technical skills required
Cost-Effective Solution
- No expensive software required
- Uses existing Excel tools
- Suitable for small and large institutes
How to Use the Cardiology KPI Dashboard in Excel?
Using this dashboard is simple and efficient.
Step 1: Enter KPI Definitions
- Go to KPI Definition sheet
- Define all KPIs with formulas and units
Step 2: Input Target Values
- Enter monthly targets in Target sheet
Step 3: Add Actual Data
- Input actual performance data in Actual sheet
Step 4: Enter Previous Year Data
- Add historical data for comparison
Step 5: Analyze Dashboard
- Select month from dropdown
- Review KPIs and trends
As a result, users can easily monitor performance without complexity.
Best Practices for the Cardiology Institutes KPI Dashboard in Excel
To get the best results, follow these best practices.
Use Accurate Data
- Ensure data correctness
- Avoid manual errors
- Validate inputs regularly
Update Data Regularly
- Enter data on time
- Maintain consistency
- Keep dashboard updated
Choose Relevant KPIs
- Focus on critical metrics
- Avoid unnecessary KPIs
- Align KPIs with goals
Use Clear Definitions
- Define each KPI properly
- Maintain standard formulas
- Avoid confusion
Monitor Trends Frequently
- Review monthly performance
- Identify patterns
How Can You Customize This Dashboard?
You can easily customize this dashboard based on your needs.
Customization Options:
- Add new KPIs
- Modify charts and visuals
- Change layout and design
- Include department-wise analysis
Therefore, the dashboard becomes flexible for any cardiology institute.
Future Scope of KPI Dashboards in Healthcare
Healthcare analytics continues to evolve rapidly.
In the future:
- AI-driven insights will enhance decision-making
- Real-time dashboards will become standard
- Integration with hospital systems will improve accuracy
Therefore, KPI dashboards will play a critical role in healthcare management.
Conclusion
The Cardiology Institutes KPI Dashboard in Excel provides a powerful solution for tracking and improving healthcare performance. It simplifies data analysis, enhances visibility, and supports better decision-making.
Because of its user-friendly design and powerful features, this dashboard becomes an essential tool for cardiology institutes. By using it effectively, organizations can improve patient outcomes, optimize operations, and achieve better results.
Frequently Asked Questions (FAQs)
What is a KPI dashboard in cardiology institutes?
A KPI dashboard is a tool that tracks and analyzes performance metrics related to cardiology operations, patient care, and financial outcomes.
Why should cardiology institutes use Excel dashboards?
Excel dashboards are cost-effective, easy to use, and flexible. Therefore, they provide powerful analytics without requiring advanced software.
What does MTD and YTD mean in the dashboard?
- MTD (Month-to-Date): Performance from the start of the month to the current date
- YTD (Year-to-Date): Performance from the start of the year to the current date
Can I customize the KPI dashboard?
Yes, you can easily add new KPIs, modify charts, and adjust layouts based on your requirements.
How often should I update the dashboard?
You should update the dashboard regularly, preferably daily or weekly, to ensure accurate insights.
Is this dashboard suitable for small hospitals?
Yes, it is suitable for both small and large cardiology institutes because it is scalable and easy to use.
Visit our YouTube channel to learn step-by-step video tutorials
Watch the step-by-step video tutorial:
Click to buy Cardiology Institutes KPI Dashboard in Excel