Orthopedic Centers KPI Dashboard — a ready-to-use Excel template to monitor MTD/YTD performance, targets, previous year comparisons and KPI trends for orthopedic centers.
Introduction
The Orthopedic Centers KPI Dashboard is designed to give healthcare managers, administrators and clinicians a single view of the most important performance indicators for orthopedic departments. The template comes with input sheets, trend visualizations and a centralized dashboard to quickly assess month-to-date (MTD) and year-to-date (YTD) performance against targets and prior year.
Click to Purchases Orthopedic Centers KPI Dashboard in Excel
Key Features of Orthopedic Centers KPI Dashboard
- Ready-to-use Excel template with seven worksheet tabs for data input, KPI definitions and visualization.
- Interactive month selector to switch the dashboard numbers for any month (change on the dashboard sheet range D3).
- MTD and YTD reporting of Actual, Target and Previous Year (PY) values with conditional formatting arrows for quick direction insights.
- KPI Trend sheet with selectable KPI name, group, unit, formula, type (LTB/UTB) and charts for Actual, Target and PY.
- Separate sheets for Actuals, Targets and Previous Year numbers to keep data organized and auditable.
- KPI Definition sheet to store KPI metadata and guide users on calculation rules.
Dashboard Pages Explanation
The template is organized into seven worksheets. Each is described below so you can quickly get started.
1. Home Sheet
The Home sheet acts as an index with navigation buttons linking to the other sheets for quick access.
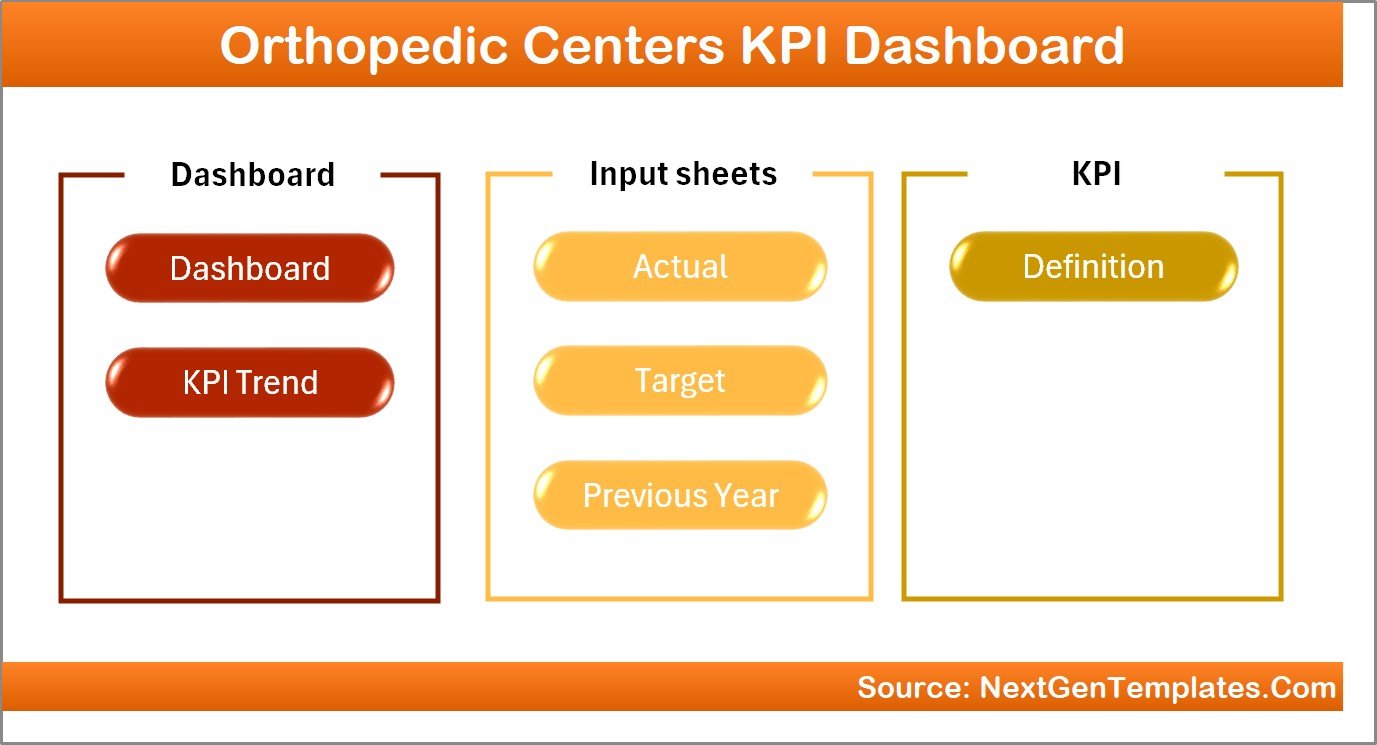
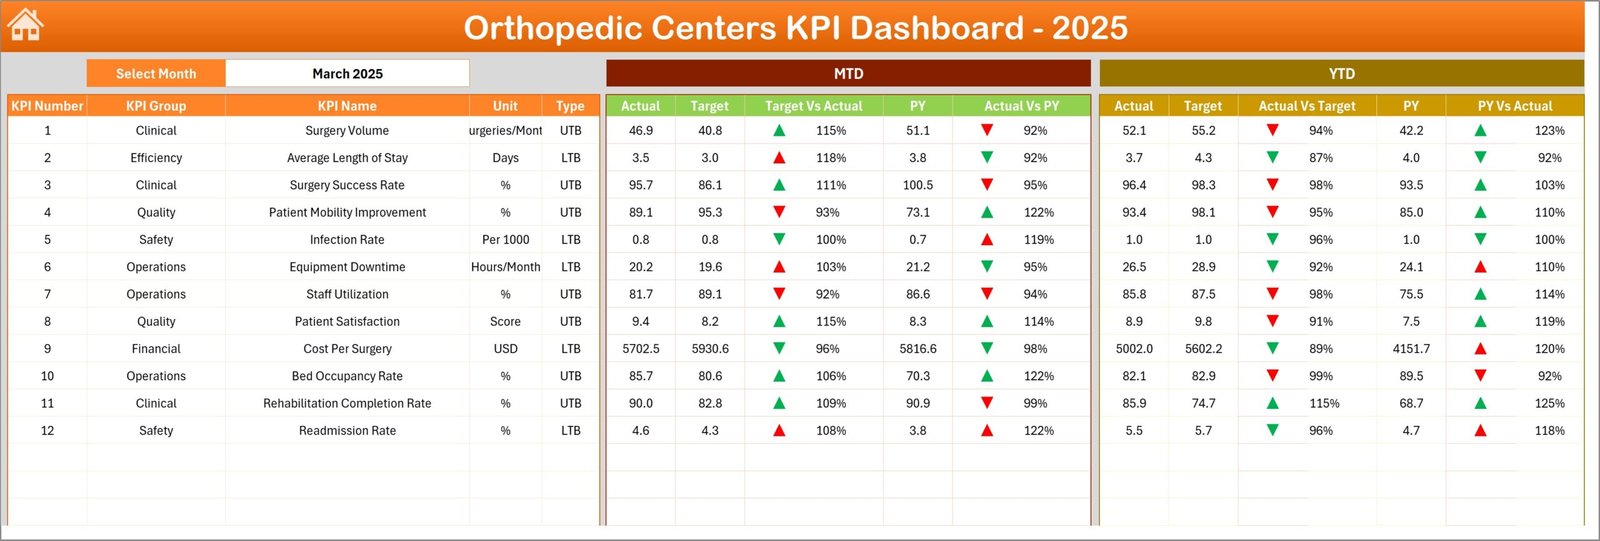
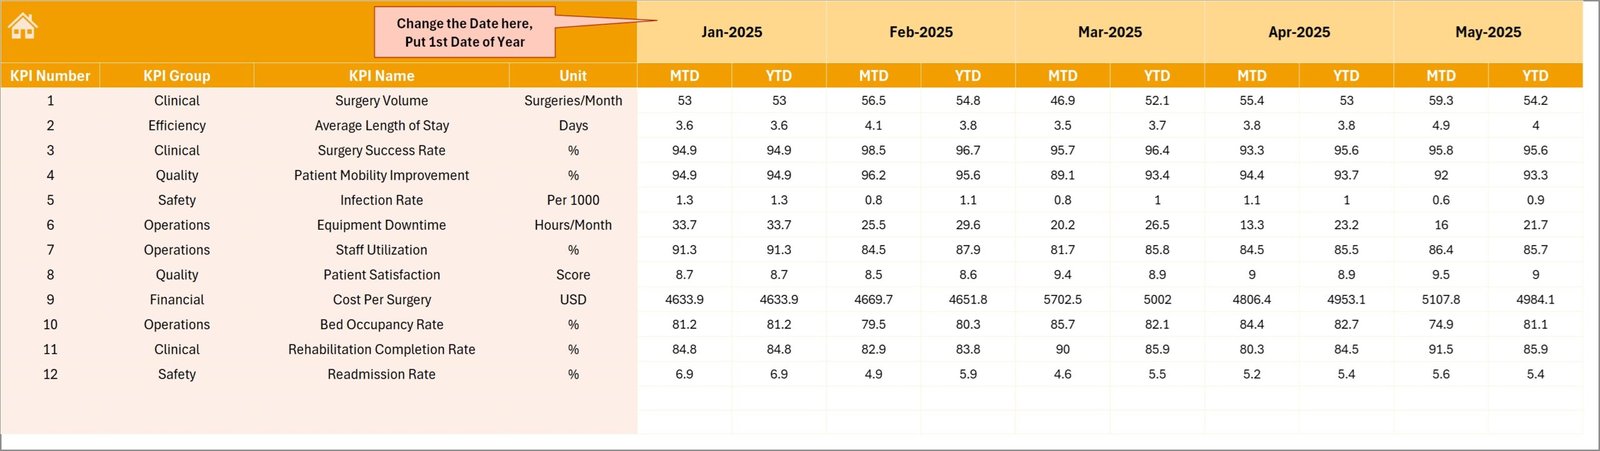
2. Dashboard Sheet
This is the main interactive sheet where you view all KPI summaries. Use the month drop-down (cell D3 in the template) to change the month and refresh all MTD/YTD figures.
- MTD: Actual, Target, Previous Year, Target vs Actual, PY vs Actual with up/down arrow conditional formatting.
- YTD: Actual, Target, Previous Year, Target vs Actual, PY vs Actual with conditional formatting.
- Quick insights and visual status indicators to spot trends at a glance.
3. KPI Trend Sheet
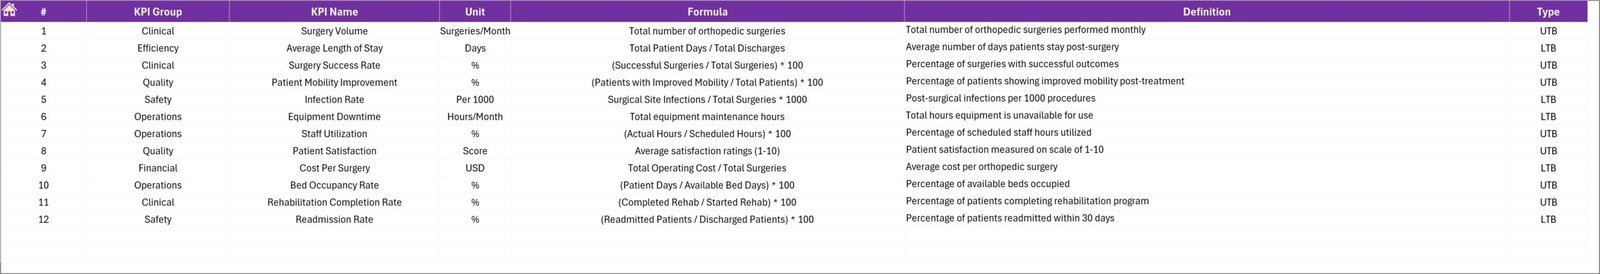
Select any KPI from the drop-down (cell C3) to view metadata and trend charts.
- Displayed details: KPI Group, Unit, KPI Type (LTB = Lower the Better / UTB = Upper the Better), Formula and Definition.
- MTD and YTD trend charts showing Actual, Target and PY series for quick visual comparison.
-
Click to Purchases Orthopedic Centers KPI Dashboard in Excel

4. Actual Numbers Input Sheet
Enter monthly MTD and cumulative YTD actuals for each KPI. Set the first month of the fiscal year in cell E1 to align YTD calculations.
5. Target Number Input Sheet
Populate monthly target values as MTD and cumulative YTD for each KPI. These values drive target comparisons and trend targets on charts.

6. Previous Year Number Sheet
Enter prior year MTD and YTD numbers here to enable year-over-year comparisons on the dashboard and trend charts.

7. KPI Definition Sheet
This sheet stores the KPI catalogue: name, group, unit, formula, definition and KPI type (LTB or UTB). Keep this updated to ensure consistent calculations and interpretation.
Advantages of Orthopedic Centers KPI Dashboard
- Fast decision-making from a single pane of glass for clinical and operational leaders.
- Improved transparency and accountability with clearly defined targets and PY comparisons.
- Standardized KPI definitions reduce misinterpretation across teams.
- Flexible month selector and input sheets make the template reusable year after year.
Opportunities for Improvement
- Integrate with your EMR or ERP via Power Query / API to automate actuals and reduce manual entry.
- Add role-based dashboards (clinical, finance, operations) to tailor views per stakeholder.
- Expand visualization with Power BI for interactive filtering, drill-throughs and larger deployments.
- Include statistical alerts or control charts to detect performance drift earlier.
Best Practices
- Define KPI owners for each metric to ensure accountability for data quality and action plans.
- Set review cadences (monthly operational review, quarterly strategic review) using the dashboard insights.
- Validate input data monthly and keep an audit trail for any adjustments to actuals or targets.
- Train users on KPI definitions and on how to interpret UTB vs LTB metrics.
FAQs
Q: How do I change the month shown on the dashboard?
A: Use the month drop-down selector in the Dashboard sheet (cell D3) to switch the month. All MTD and YTD values on the dashboard will update automatically.
Q: Can I add custom KPIs?
A: Yes. Add the KPI metadata to the KPI Definition sheet, then add its target, actual and PY values in the respective input sheets. Update any named ranges or drop-down lists if needed.
Q: Is the template compatible with Power BI?
A: The template is Excel-based but can be used as a data source for Power BI (import or connect live) to create more interactive dashboards and centralized distributions.
Conclusion
The Orthopedic Centers KPI Dashboard is a practical, structured and user-friendly Excel template to monitor orthopedic performance. It balances simplicity with powerful features—MTD/YTD comparison, trend visualization and clear KPI definitions—to help teams make timely, data-driven decisions.
External resources: Learn more about Excel features and data connectivity at Microsoft Excel Support and explore analytics with Microsoft Power BI.
Visit our YouTube channel to watch the demo: Youtube.com/@NextGenTemplates