In today’s competitive business world, understanding the true value of a company plays a critical role in making smart decisions. Whether you plan mergers, acquisitions, investments, or business expansion, you must rely on accurate and real-time data. However, many organizations still depend on scattered spreadsheets and manual reports. As a result, they miss insights and delay decisions.
Therefore, companies now adopt modern analytics tools to simplify complex financial evaluations. One of the most powerful solutions is the Business Valuation Dashboard in Power BI.
Click to Purchases Business Valuation Dashboard in Power BI
This article will guide you through everything you need to know about this dashboard. You will learn its features, structure, advantages, best practices, and frequently asked questions. Moreover, you will discover how it helps you make faster and smarter financial decisions.
📌 What is a Business Valuation Dashboard in Power BI?
A Business Valuation Dashboard in Power BI is an interactive analytics tool that helps users evaluate the financial worth of a business using real-time data visualization.
Instead of using multiple Excel sheets, you can monitor all key valuation metrics in one centralized dashboard. Moreover, Power BI transforms raw financial data into meaningful insights through charts, KPIs, and filters.
With this dashboard, you can:
-
Track company valuation metrics easily
-
Compare financial performance across industries
-
Analyze risk-based valuation
-
Monitor financial health in real time
-
Make faster and more accurate decisions
As a result, decision-makers gain full visibility into business performance.
❓ Why Do You Need a Business Valuation Dashboard?
Many businesses struggle with valuation because they rely on manual calculations. However, this approach creates delays and errors. Therefore, companies need a smarter solution.
Here’s why this dashboard becomes essential:
-
📊 You get real-time financial insights
-
⚡ You reduce manual work and errors
-
📈 You improve decision-making speed
-
🔍 You identify trends and risks quickly
-
💡 You gain a competitive advantage
Because of these benefits, organizations increasingly use Power BI dashboards.
🧩 Key Features of the Business Valuation Dashboard in Power BI
This ready-to-use dashboard includes 5 powerful pages, each designed for a specific type of analysis. Let’s explore each one in detail.
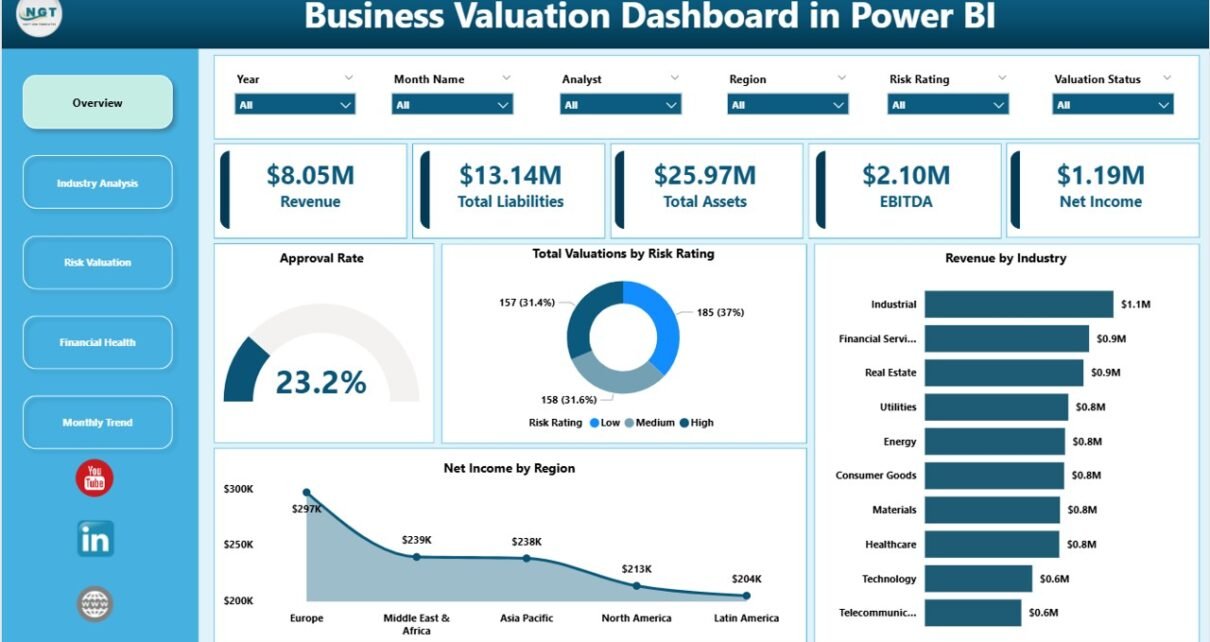
📍 1. Overview Page – Get a Complete Snapshot
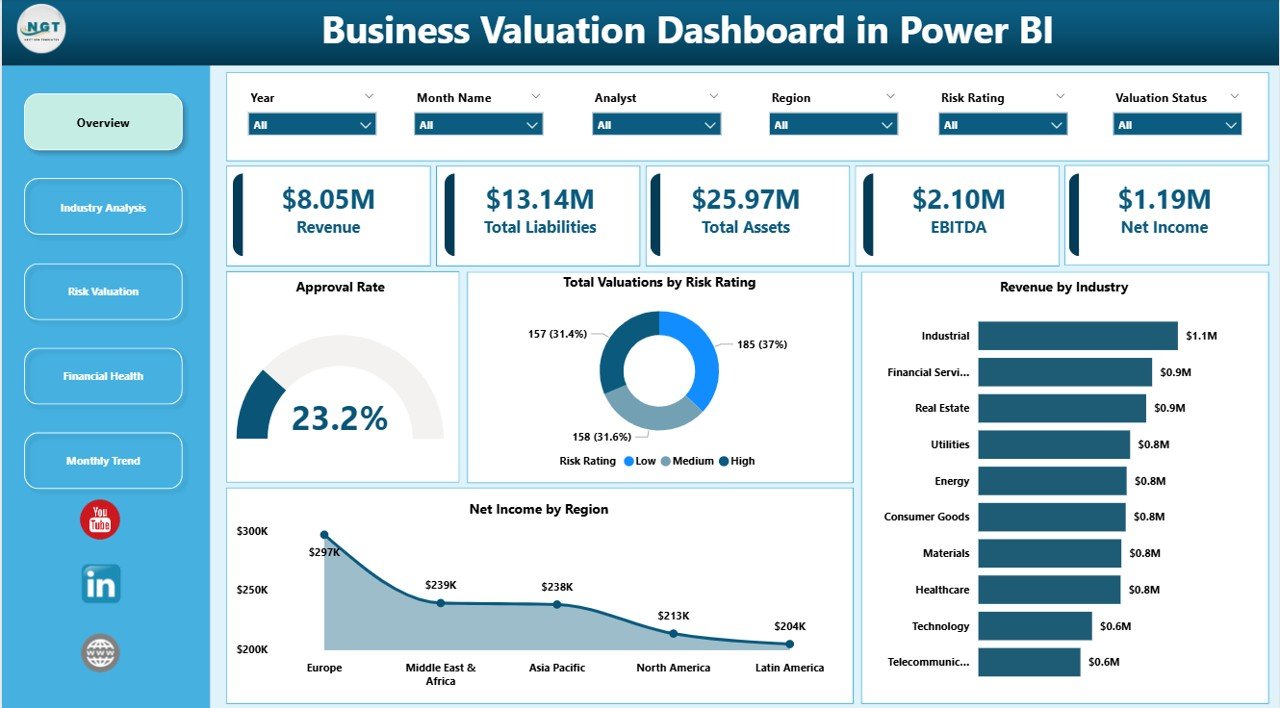
The Overview Page acts as the central hub of the dashboard. Here, you can quickly understand the overall performance of the business.
Key elements included:
-
🎯 Slicers for dynamic filtering
-
📊 KPI Cards:
-
Approved Rate
-
Total Valuation by Risk Rating
-
Revenue by Industry
-
Net Income by Region
-
Because of this page, you can instantly evaluate business performance without digging into multiple reports.
🏭 2. Industry Analysis – Compare Across Industries
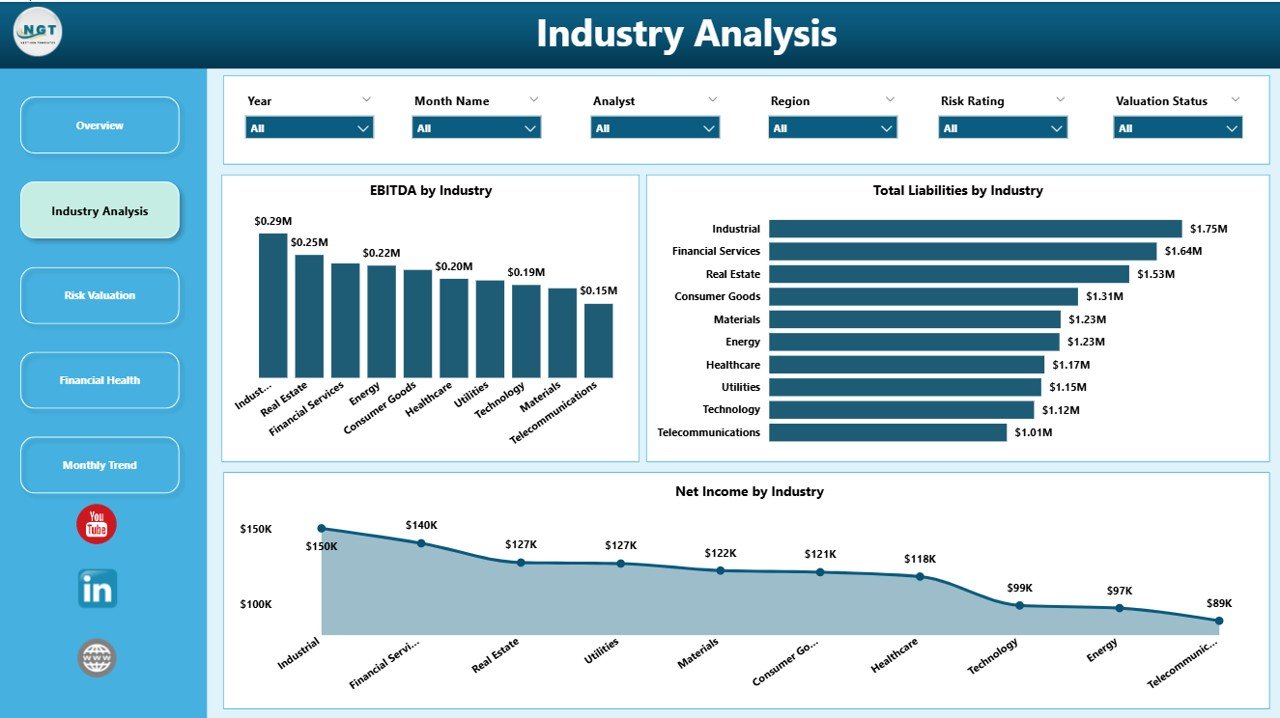
The Industry Analysis Page helps you understand how different industries perform financially.
Key charts:
-
📊 EBITDA by Industry
-
📊 Total Liabilities by Industry
-
📊 Net Income by Industry
Why it matters:
-
You can identify high-performing industries
-
You can compare profitability trends
-
You can spot growth opportunities
As a result, investors and analysts can make smarter industry-based decisions.
Click to Purchases Business Valuation Dashboard in Power BI
⚠️ 3. Risk Valuation – Analyze Risk-Based Performance
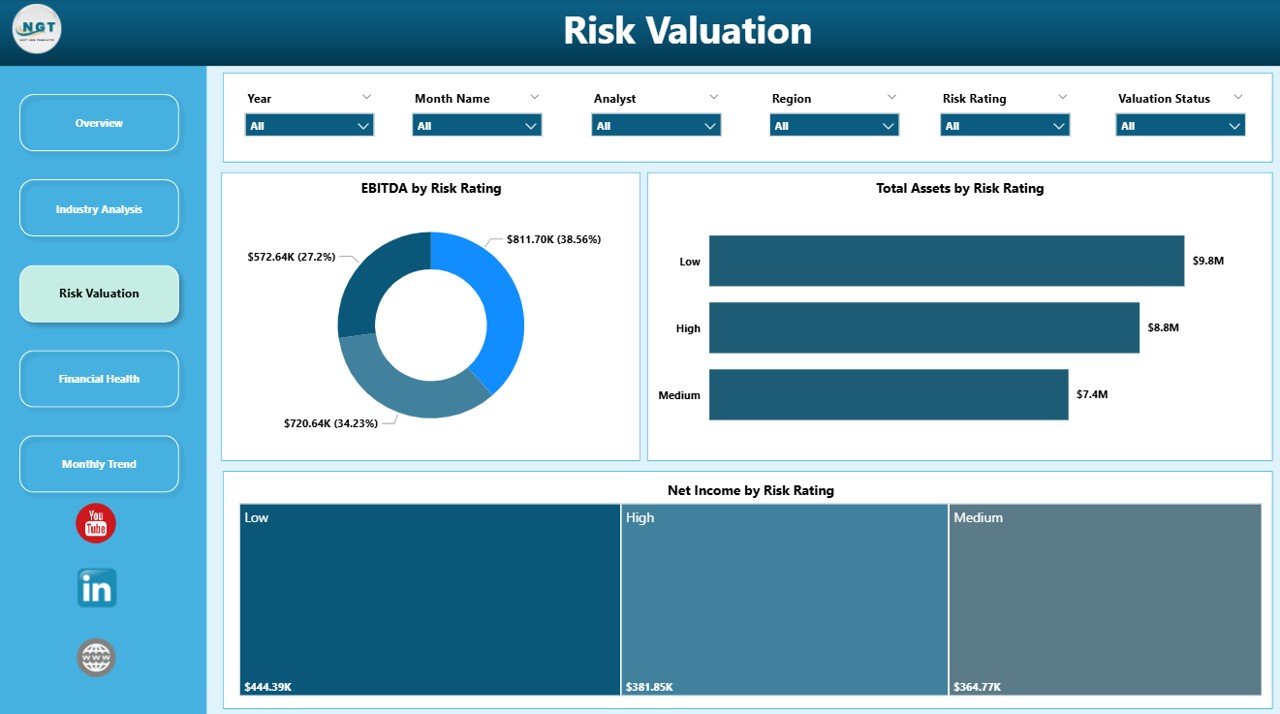
Risk plays a major role in business valuation. Therefore, this page focuses on evaluating performance based on risk levels.
Key charts:
-
📊 EBITDA by Risk Rating
-
📊 Total Liabilities by Risk Rating
-
📊 Net Income by Risk Rating
Benefits:
-
You can assess high-risk vs low-risk investments
-
You can understand financial stability
-
You can improve risk management strategies
Thus, this page helps reduce uncertainty in decision-making.
💰 4. Financial Health – Monitor Regional Performance
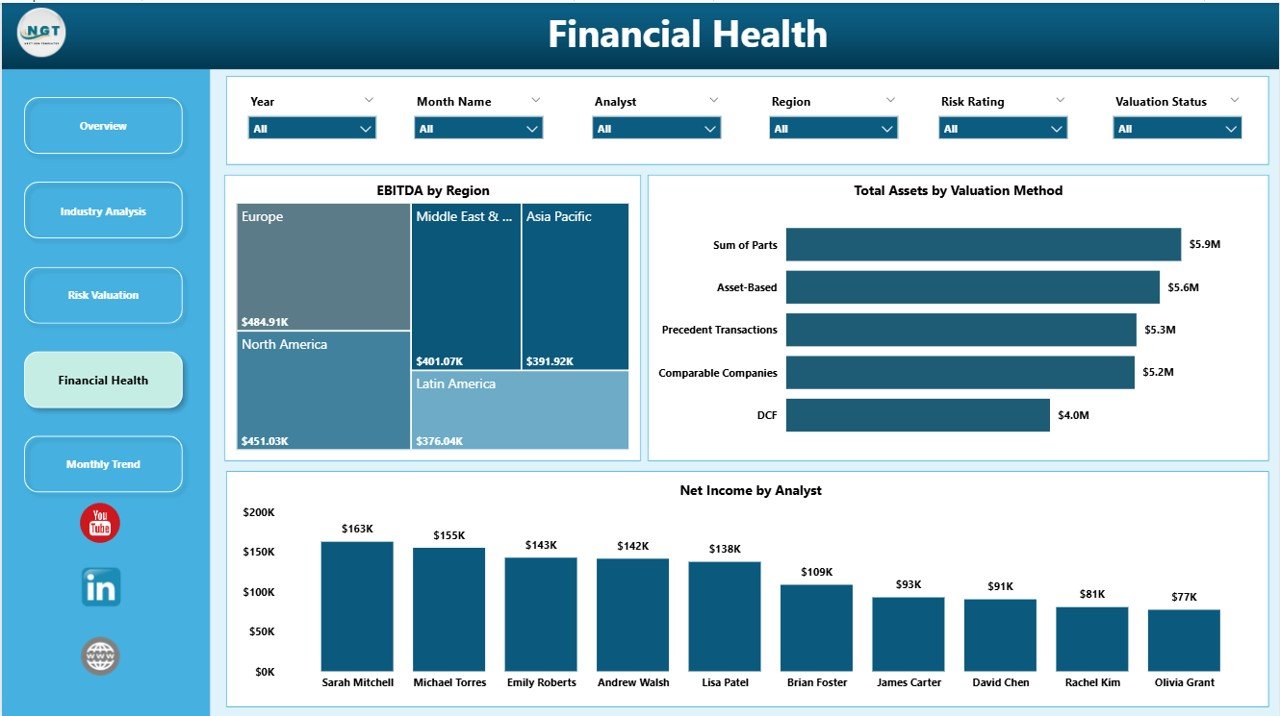
The Financial Health Page provides insights into how different regions perform financially.
Key charts:
-
📊 EBITDA by Region
-
📊 Total Liabilities by Region
-
📊 Net Income by Region
Why it’s useful:
-
You can evaluate regional profitability
-
You can identify underperforming regions
-
You can optimize resource allocation
Therefore, businesses can focus on regions that drive growth.
📅 5. Month Analysis – Track Monthly Trends
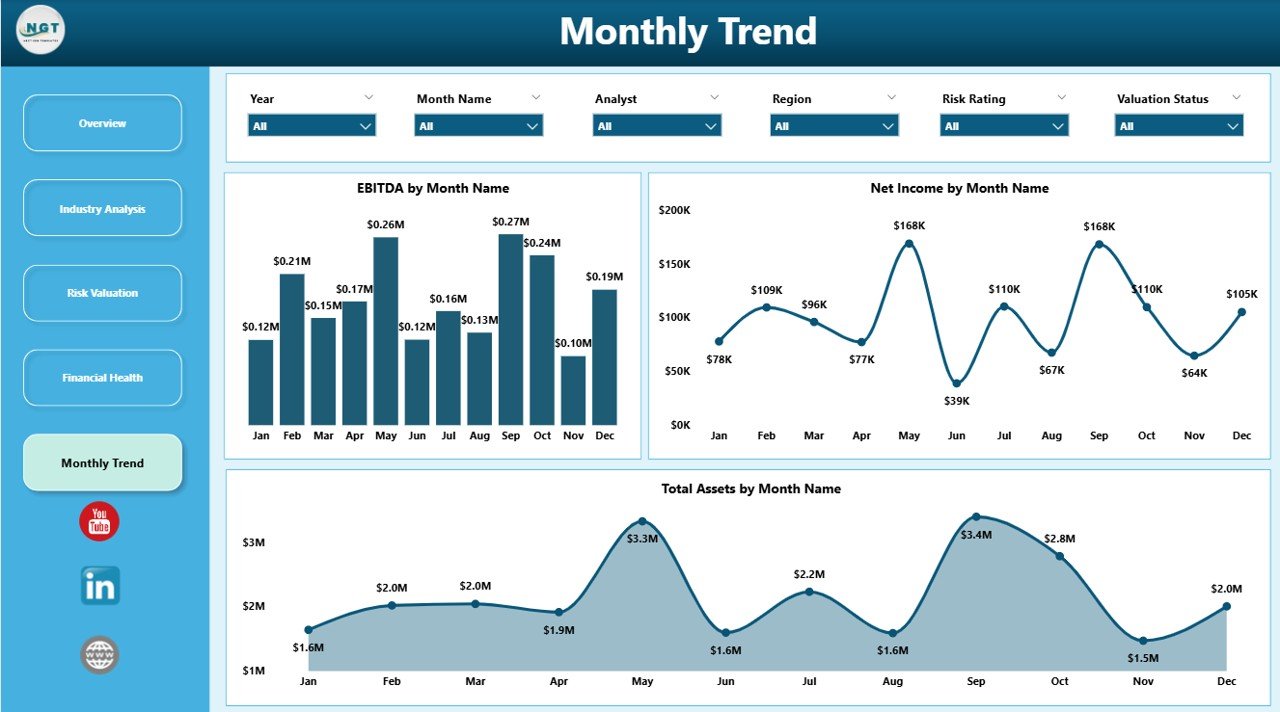
The Month Analysis Page helps track financial performance over time.
Key charts:
-
📊 EBITDA by Month
-
📊 Total Liabilities by Month
-
📊 Net Income by Month
Advantages:
-
You can identify seasonal trends
-
You can monitor monthly growth
-
You can forecast future performance
As a result, businesses can plan strategies more effectively.
🚀 Advantages of Business Valuation Dashboard in Power BI
Using this dashboard offers multiple benefits. Let’s explore them in detail.
✅ 1. Real-Time Insights
You can access live data updates. Therefore, you always make decisions based on the latest information.
✅ 2. Better Decision-Making
You get clear visual insights. As a result, you make faster and more confident decisions.
✅ 3. Centralized Data Management
All financial data stays in one place. Thus, you avoid confusion and data duplication.
✅ 4. Improved Accuracy
Automation reduces human errors. Therefore, your valuation becomes more reliable.
✅ 5. Interactive Visualization
You can use slicers and filters. Hence, you can explore data from multiple angles.
✅ 6. Time-Saving
You eliminate manual reporting. As a result, you save valuable time.
✅ 7. Scalability
You can use the dashboard for small or large businesses. Therefore, it grows with your needs.
Click to Purchases Business Valuation Dashboard in Power BI
📊 How Does the Business Valuation Dashboard Work?
Understanding how the dashboard works helps you use it effectively.
Step-by-step process:
1️⃣ Data Collection
You collect financial data in Excel or other sources.
2️⃣ Data Integration
You connect the data to Power BI.
3️⃣ Data Transformation
Power BI cleans and structures the data.
4️⃣ Visualization Creation
You create charts, KPIs, and tables.
5️⃣ Analysis & Insights
You analyze trends and performance.
Because of this structured process, the dashboard delivers accurate insights.
🧠 What Key Metrics Does This Dashboard Track?
This dashboard focuses on essential financial indicators.
Important metrics include:
-
📌 EBITDA (Earnings Before Interest, Taxes, Depreciation, Amortization)
-
📌 Net Income
-
📌 Total Liabilities
-
📌 Revenue
-
📌 Risk Rating
-
📌 Industry Performance
These metrics help you evaluate business value effectively.
⚙️ Best Practices for the Business Valuation Dashboard in Power BI
To get the best results, you must follow some best practices.
🔹 1. Keep Data Clean
Always use structured and accurate data. Otherwise, results may become unreliable.
🔹 2. Use Meaningful KPIs
Focus on relevant metrics. Therefore, you avoid unnecessary complexity.
🔹 3. Update Data Regularly
Keep your data updated. As a result, you always get real-time insights.
🔹 4. Use Filters Smartly
Apply slicers effectively. Thus, you can explore different scenarios easily.
🔹 5. Optimize Dashboard Design
Keep the layout simple and clear. Therefore, users can understand it quickly.
🔹 6. Monitor Trends Consistently
Analyze data regularly. Hence, you can identify patterns early.
🔹 7. Ensure Data Security
Protect sensitive financial data. As a result, you maintain confidentiality.
⚠️ Opportunities for Improvement in Business Valuation
Even though the dashboard is powerful, you can still improve it further.
🔸 Add Predictive Analytics
You can include forecasting models. Therefore, you can predict future valuation.
🔸 Integrate AI Insights
AI can provide deeper insights. Thus, decision-making becomes smarter.
🔸 Enhance Data Sources
You can connect multiple data sources. As a result, analysis becomes more comprehensive.
🔸 Customize KPIs
You can tailor metrics based on your business. Therefore, insights become more relevant.
🏆 Who Can Benefit from This Dashboard?
Click to Purchases Business Valuation Dashboard in Power BI
This dashboard suits various professionals and industries.
👥 Ideal users include:
-
Business Analysts
-
Financial Analysts
-
Investors
-
CFOs and Finance Teams
-
Consultants
-
Startups and Entrepreneurs
Because of its flexibility, anyone can use it for financial analysis.
🔮 Future of Business Valuation Dashboards
Technology continues to evolve. Therefore, business valuation dashboards will become even more powerful.
Future trends include:
-
AI-driven insights
-
Real-time cloud integration
-
Automated forecasting
-
Advanced data storytelling
As a result, businesses will make even smarter decisions.
📝 Conclusion
The Business Valuation Dashboard in Power BI transforms the way businesses analyze financial performance. Instead of relying on manual reports, you can access real-time insights in one centralized platform.
Moreover, it helps you track KPIs, analyze trends, evaluate risks, and improve decision-making. Because of its interactive features and powerful analytics, it becomes an essential tool for modern businesses.
If you want to improve financial visibility and make smarter decisions, this dashboard offers the perfect solution.
❓ Frequently Asked Questions (FAQs)
1. What is the main purpose of a Business Valuation Dashboard?
It helps users analyze financial performance and determine the value of a business using data visualization.
2. Can beginners use this dashboard?
Yes, beginners can use it easily because Power BI provides a user-friendly interface.
3. What data do I need for this dashboard?
You need financial data such as revenue, liabilities, net income, and EBITDA.
4. How often should I update the dashboard?
You should update it regularly to ensure accurate and real-time insights.
5. Can I customize the dashboard?
Yes, you can modify KPIs, charts, and filters based on your business needs.
6. Is Power BI better than Excel for valuation?
Power BI offers better visualization and real-time analysis compared to Excel.
7. Who should use this dashboard?
Financial analysts, investors, business owners, and decision-makers can use it.
8. Does this dashboard support multiple industries?
Yes, it allows analysis across different industries.
Visit our YouTube channel to learn step-by-step video tutorials