Aquaponics is changing the way modern farms work. It combines aquaculture and hydroponics in one balanced system. As a result, farmers can grow fish and plants together while using water, energy, and space more efficiently. However, managing an aquaponics operation is not always simple. You need to track production, revenue, costs, water usage, energy consumption, system types, fish species, plant yield, and sustainability performance at the same time.
Because of that, many farm owners and managers struggle to keep everything organized in separate spreadsheets and reports. In many cases, they miss important patterns, react slowly to problems, and make decisions based on incomplete data. Therefore, businesses now look for smarter reporting tools that give them a complete view of operations in one place.
That is exactly where the Aquaponics Dashboard in Power BI becomes useful.
The Aquaponics Dashboard in Power BI is a ready-to-use and interactive reporting solution that helps users monitor, analyze, and improve aquaponics operations. It turns raw data into visual insights. Moreover, it helps managers understand performance quickly and take action with confidence.
In this article, you will learn everything about the Aquaponics Dashboard in Power BI, including its features, structure, benefits, use cases, best practices, and frequently asked questions. So, if you want to manage your aquaponics business in a smarter way, this guide will help you a lot.
Click to buy Aquaponics Dashboard in Power BI
What is an Aquaponics Dashboard in Power BI?
An Aquaponics Dashboard in Power BI is a data visualization and reporting tool designed to help users track all major aquaponics metrics in one centralized place. Instead of checking different files and manual reports, you can use one dashboard to see how your systems perform across production, finance, and sustainability.
Power BI makes this even better because it offers dynamic visuals, filters, slicers, interactive charts, and fast analysis. Therefore, users can explore their data in a more meaningful way.
With this dashboard, you can monitor:
- Total systems
- Revenue
- Profit
- Energy consumption
- Plant yield
- Feed usage
- Production cost
- Water usage
- Fish species performance
- Certification data
- Monthly trends
As a result, you can identify strong areas, fix weak areas, and improve your decision-making process.
Why Do Aquaponics Businesses Need a Dashboard?
Aquaponics operations generate a lot of data every day. You may need to review outputs by system type, scale, fish species, market channel, and month. At the same time, you also need to monitor costs, profitability, and sustainability measures. Therefore, handling all this information manually can become time-consuming and stressful.
Here is why an aquaponics dashboard matters:
- It saves time by bringing all key metrics into one view.
- It improves visibility across operations.
- It supports faster and better decisions.
- It helps compare performance across categories.
- It makes reporting simple and professional.
- It helps identify trends early.
- It improves control over costs and resource usage.
In other words, this dashboard helps you move from guesswork to data-driven management.
What Are the Key Features of the Aquaponics Dashboard in Power BI?
The Aquaponics Dashboard in Power BI includes 5 powerful pages. Each page focuses on a different area of aquaponics performance. Therefore, users can review their data from multiple angles.
What Does the Overview Page Show?
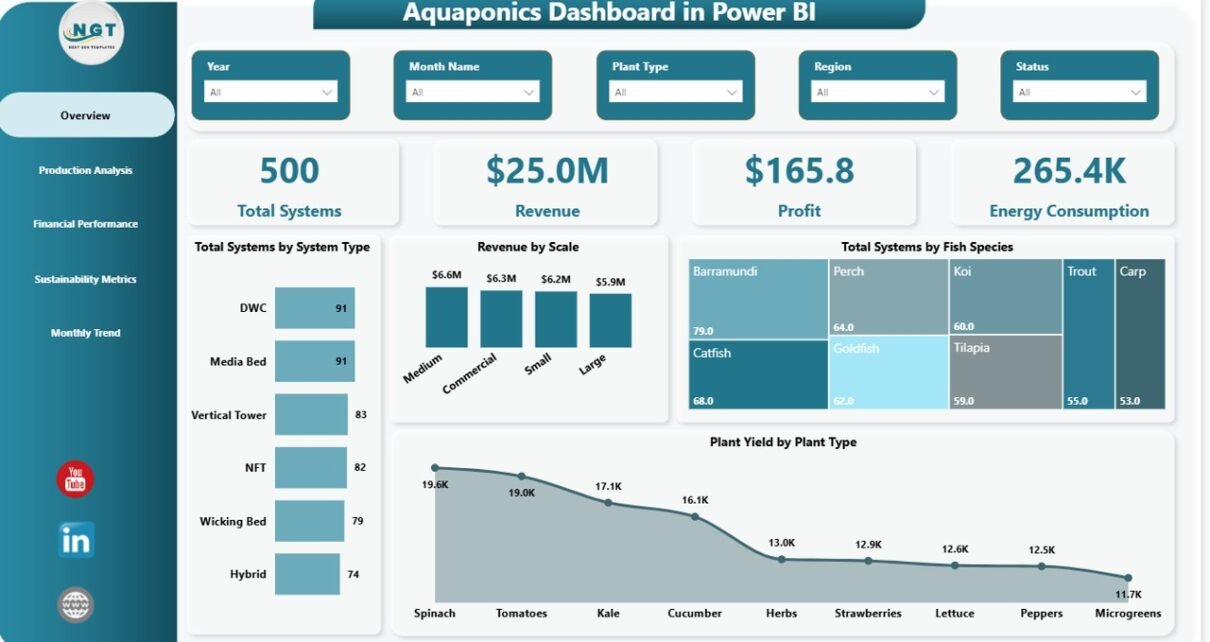
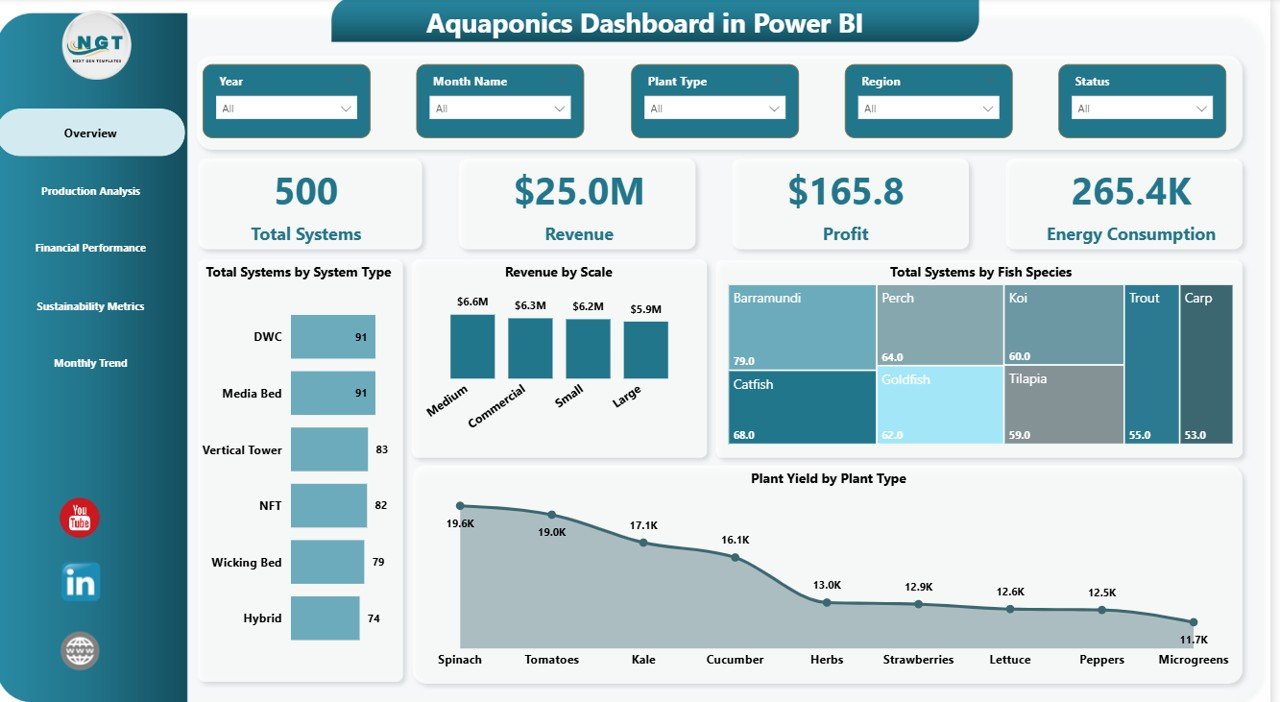
The Overview Page is the main summary page of the dashboard. It gives users a quick snapshot of the overall business performance. In addition, it includes slicers, which help users filter data and view only the information they need.
KPI Cards on the Overview Page
This page includes 4 KPI cards:
- Total Systems
- Revenue
- Profit
- Energy Consumption
These cards help users understand the overall performance at a glance. For example, if profit drops while energy consumption increases, managers can quickly investigate the cause.
Charts on the Overview Page
The Overview Page also includes 4 charts:
- Total Systems by System Type
- Revenue by Scale
- Total Systems by Fish Species
- Plant Yield by Plant Type
These visuals help answer important questions such as:
- Which system types are most common?
- Which farm scale generates the highest revenue?
- Which fish species appear most often?
- Which plant types produce the best yield?
As a result, the Overview Page works as the starting point for high-level analysis.
Click to buy Aquaponics Dashboard in Power BI
How Does the Production Analysis Page Help?
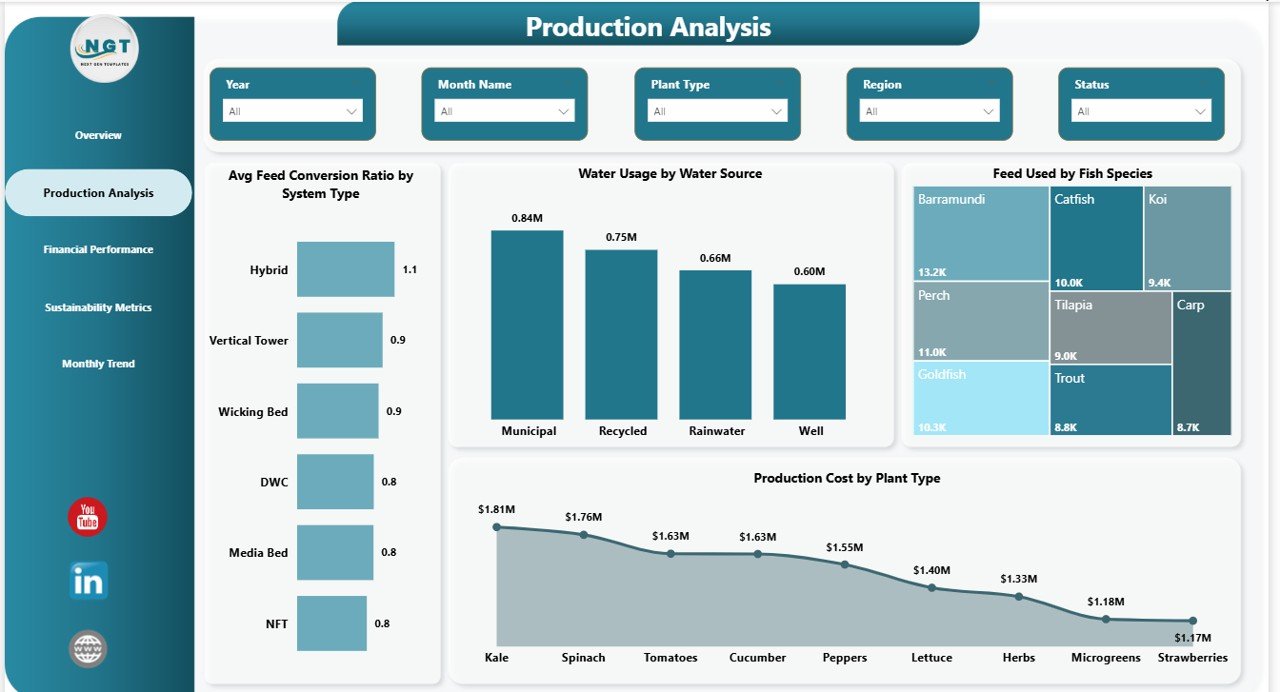
The Production Analysis Page focuses on operational efficiency. Since aquaponics depends on balanced production systems, this page is extremely useful for monitoring how well the farm performs in day-to-day operations.
Charts on the Production Analysis Page
This page includes 4 charts:
- Average Feed Conversion Ratio by System Type
- Water Usage by Water Source
- Feed Used by Fish Species
- Production Cost by Plant Type
These charts help users understand production efficiency from multiple viewpoints.
For example:
- If one system type shows a better feed conversion ratio, managers can learn from that model.
- If one fish species consumes too much feed, users can review feeding practices.
- If certain plant types create higher production costs, managers can adjust crop planning.
- If water usage depends too much on one source, businesses can plan more sustainable strategies.
Therefore, this page helps improve both productivity and resource control.
Click to buy Aquaponics Dashboard in Power BI
What Insights Come from the Financial Performance Page?
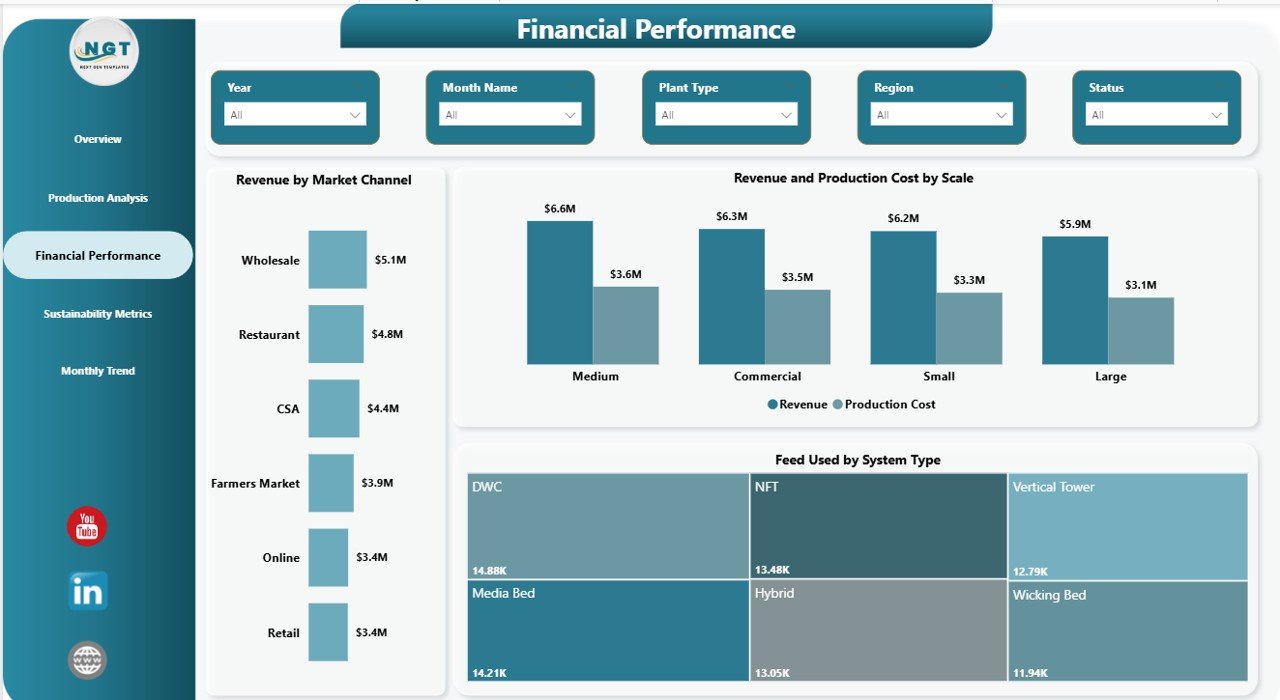
The Financial Performance Page helps users understand how the aquaponics business performs financially. This is important because successful farms must balance production efficiency with strong revenue and profit outcomes.
Charts on the Financial Performance Page
This page includes 3 charts:
- Revenue by Market Channel
- Revenue and Production Cost by Scale
- Feed Used by System Type
These visuals help users answer questions like:
- Which market channel brings the most revenue?
- Does large-scale production create better returns?
- Are production costs too high compared to revenue?
- Which system types use more feed and affect profitability?
Because of this page, decision-makers can review how financial results connect with operational choices. Moreover, they can identify profitable segments and improve weak areas faster.
Click to buy Aquaponics Dashboard in Power BI
Why Is the Sustainability Metrics Page Important?
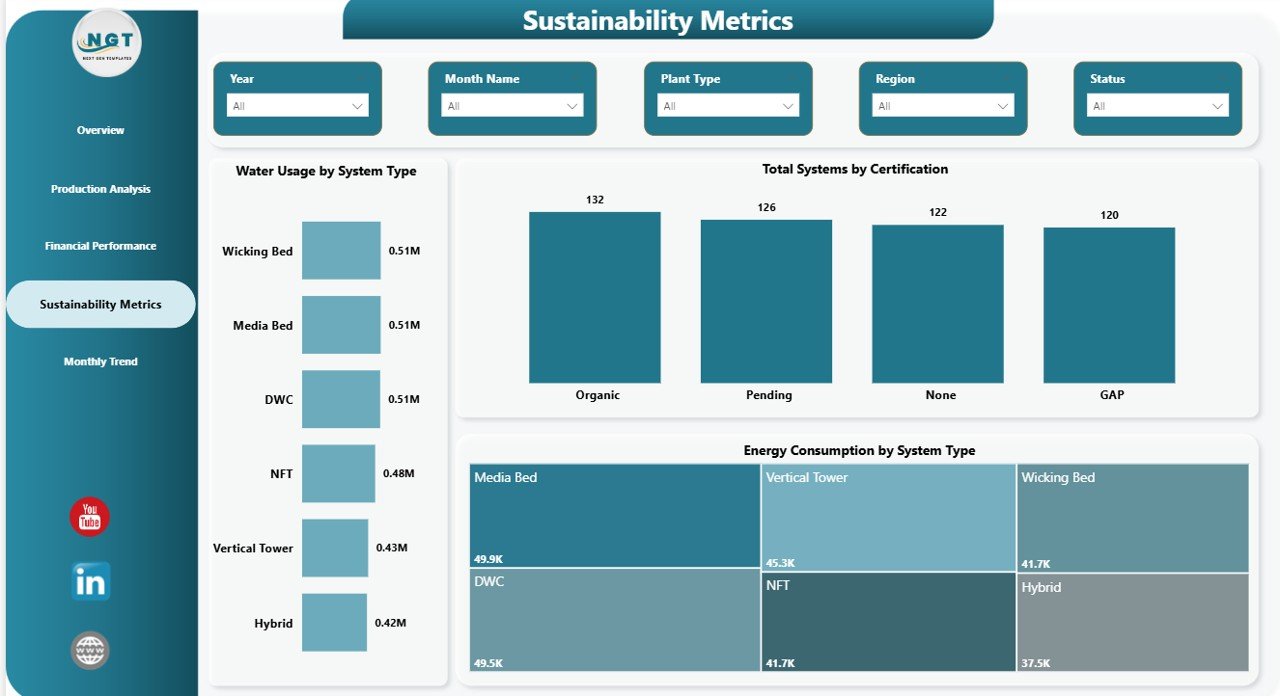
Sustainability is one of the biggest strengths of aquaponics. However, if you do not measure it properly, you cannot prove your progress or improve your performance. Therefore, the Sustainability Metrics Page plays an important role in this dashboard.
Charts on the Sustainability Metrics Page
This page includes 3 charts:
- Water Usage by System Type
- Total Systems by Certification
- Energy Consumption by System Type
These visuals help users monitor environmental performance in a practical way.
For example:
- If one system type uses less water, it may be more sustainable.
- If certain systems consume too much energy, users can review equipment and processes.
- If certifications vary across systems, managers can focus on compliance and quality improvements.
As a result, this page supports better sustainability planning and reporting.
Click to buy Aquaponics Dashboard in Power BI
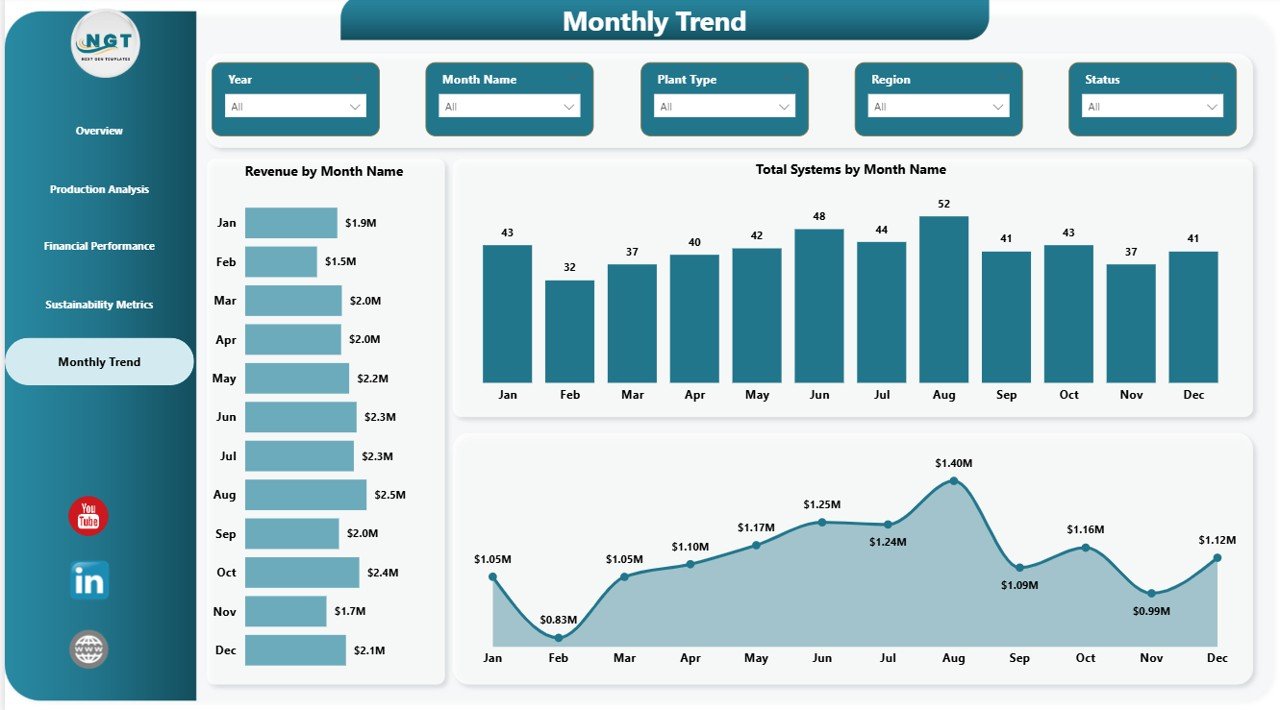
What Does the Month Analysis Page Reveal?
The Month Analysis Page helps users track performance over time. Since aquaponics operations change seasonally and monthly, trend analysis is essential. Therefore, this page helps businesses understand patterns and prepare better.
Charts on the Month Analysis Page
This page includes 3 charts:
- Revenue by Month Name
- Total Systems by Month Name
- Production Cost by Month Name
These monthly visuals help users identify:
- Seasonal revenue patterns
- Changes in system activity
- Cost spikes in certain months
- Business growth or decline over time
Because of this, managers can forecast better, plan budgets more accurately, and make stronger monthly decisions.
Click to buy Aquaponics Dashboard in Power BI
How Does Power BI Improve Aquaponics Reporting?
Power BI is one of the best tools for dashboard reporting. It turns raw numbers into attractive and meaningful visuals. Moreover, it allows users to interact with data easily. That means you do not just see a static report. Instead, you explore the numbers in real time.
Power BI benefits include:
- Interactive slicers and filters
- Fast visualization of large data sets
- Easy comparison across categories
- Professional dashboard design
- Real-time or refreshable reports
- Better storytelling with data
Therefore, when you use an aquaponics dashboard in Power BI, you do not just collect data. You actually use it to improve decisions.
What Are the Main Advantages of Aquaponics Dashboard in Power BI?
The Aquaponics Dashboard in Power BI offers many practical benefits. It supports daily management, long-term planning, and better reporting. Below are the major advantages.
- Centralized Data Monitoring
This dashboard keeps important aquaponics data in one place. As a result, users do not need to move between multiple reports and spreadsheets.
- Better Decision-Making
Since the dashboard presents data clearly, users can make quick and informed decisions. Moreover, visual reports make patterns easier to understand.
- Improved Production Control
The production analysis section helps managers monitor feed use, costs, and water consumption. Therefore, they can improve efficiency and reduce waste.
- Stronger Financial Visibility
The financial page shows how revenue, cost, and feed usage affect business performance. As a result, users can focus on profitability more effectively.
- Easy Sustainability Tracking
Sustainability is very important in aquaponics. This dashboard helps users measure water use, energy use, and certification data. Therefore, environmental management becomes easier.
- Better Trend Analysis
Monthly analysis helps businesses track performance over time. Because of that, managers can plan better and act before problems grow.
- Professional Reporting
Power BI dashboards look clean, modern, and professional. So, they are useful not only for internal review but also for meetings, presentations, and stakeholder reporting.
Who Can Benefit from the Aquaponics Dashboard in Power BI?
This dashboard is useful for many types of users. Since aquaponics combines farming, production, finance, and sustainability, different teams can benefit from the same dashboard.
Ideal users include:
- Aquaponics farm owners
- Farm managers
- Sustainability managers
- Operations teams
- Financial analysts
- Agribusiness consultants
- Investors in smart farming projects
- Agricultural reporting teams
Therefore, this dashboard is not only for large businesses. Small and medium-sized aquaponics operations can also use it effectively.
How Can This Dashboard Support Daily Operations?
Daily operations in aquaponics require close monitoring. You need to know what is happening with feed, yield, system performance, water use, and energy use. Therefore, a dashboard can make daily management much easier.
Here is how it helps:
- It shows performance at a glance.
- It highlights high-cost areas quickly.
- It helps compare system types easily.
- It makes monthly reviews faster.
- It supports team discussions with clear visuals.
- It improves planning for production and cost control.
As a result, teams can save time and stay focused on the most important actions.
What Makes This Dashboard Valuable for Management Meetings?
Management teams need short, clear, and accurate reports. They do not want to read long spreadsheets full of raw numbers. Instead, they want visual insights that help them take action quickly. That is why this dashboard becomes so valuable during meetings.
It helps meetings by:
- Showing KPIs in a simple format
- Supporting fast performance reviews
- Highlighting issues and opportunities
- Making trends easier to explain
- Helping teams agree on priorities
Therefore, the dashboard supports better communication as well as better decisions.
Best Practices for the Aquaponics Dashboard in Power BI
To get the best results from the Aquaponics Dashboard in Power BI, you should follow a few practical steps. These best practices will help you keep the dashboard accurate, useful, and easy to understand.
- Keep Data Updated Regularly
A dashboard is only useful when it shows current information. Therefore, make sure you update data frequently and consistently.
- Use Clean and Structured Source Data
Power BI works best with organized data. So, keep your data tables clean, complete, and properly formatted.
- Review KPIs Every Month
Monthly reviews help you identify trends and performance changes. As a result, you can take action at the right time.
- Focus on Actionable Metrics
Choose metrics that support decisions. For example, water usage, production cost, and profit are more useful when they guide real actions.
- Compare Performance Across Categories
Use slicers and charts to compare fish species, system types, market channels, and scales. This helps you discover what works best.
- Track Sustainability Alongside Profitability
Do not focus only on revenue and profit. At the same time, monitor water usage, energy consumption, and certification performance.
- Train Users on Dashboard Navigation
Even a simple dashboard works better when users know how to use slicers, filters, and interactive visuals. Therefore, basic training can improve adoption.
- Use Insights for Planning
Do not treat the dashboard as a display tool only. Instead, use it during planning, budgeting, resource allocation, and performance review sessions.
Opportunities for Improvement with the Aquaponics Dashboard in Power BI
Although this dashboard already offers strong analysis, businesses can still improve how they use it. Therefore, it is smart to look for areas where dashboard value can grow.
Some improvement ideas include:
- Add target vs actual comparisons
- Include region-based analysis
- Add profit margin trends
- Include alert indicators for unusual values
- Track certification renewal timelines
- Add more detailed fish growth metrics
- Include plant harvest cycle analysis
These additions can make the dashboard even more useful over time.
Why Is This Dashboard a Smart Investment for Aquaponics Businesses?
Every growing business needs visibility, control, and planning tools. Aquaponics is no different. Since the industry depends on balanced operations and efficient resource usage, managers need data they can trust and understand quickly.
This dashboard is a smart investment because:
- It reduces reporting time
- It improves data visibility
- It supports profitable decisions
- It helps monitor sustainability goals
- It makes business reviews easier
- It helps scale operations with confidence
Therefore, investing in a ready-to-use Power BI dashboard can save effort while improving overall performance.
How Does the Aquaponics Dashboard in Power BI Help Future Growth?
Growth requires more than hard work. It also needs direction. When businesses understand what drives profit, cost, yield, and sustainability, they can expand with more confidence. Therefore, a dashboard becomes an important growth tool.
This dashboard supports future growth by helping users:
- Identify successful system types
- Focus on profitable market channels
- Manage costs more effectively
- Monitor resource efficiency
- Build stronger reports for investors and stakeholders
- Create a culture of data-driven farming
As a result, users can grow their operations with clearer goals and better insight.
Conclusion
The Aquaponics Dashboard in Power BI is a powerful and practical solution for modern aquaponics businesses. It combines production, financial, sustainability, and monthly analysis in one interactive reporting tool. As a result, users can monitor operations more clearly, improve performance faster, and make smarter decisions every day.
With 5 detailed pages, including Overview, Production Analysis, Financial Performance, Sustainability Metrics, and Month Analysis, this dashboard gives users a complete view of their aquaponics business. Moreover, it helps them understand how systems, fish species, plant types, water usage, energy consumption, and revenue all connect.
If you want to simplify reporting, improve decision-making, and track aquaponics performance in a professional way, this dashboard is an excellent choice. Therefore, the Aquaponics Dashboard in Power BI is not just a reporting tool. It is a smart management solution for better farming results.
Frequently Asked Questions with Answers
- What is an Aquaponics Dashboard in Power BI?
An Aquaponics Dashboard in Power BI is an interactive reporting tool that helps users track aquaponics data such as revenue, profit, production cost, water usage, energy consumption, and plant yield in one place.
- Who should use this dashboard?
Farm owners, aquaponics managers, operations teams, sustainability teams, analysts, and agribusiness consultants can all use this dashboard.
- How many pages does this dashboard include?
This dashboard includes 5 pages:
Overview, Production Analysis, Financial Performance, Sustainability Metrics, and Month Analysis.
- What KPI cards are available on the Overview Page?
The Overview Page includes 4 KPI cards:
Total Systems, Revenue, Profit, and Energy Consumption.
- What type of charts are included in the dashboard?
The dashboard includes charts for system type, fish species, plant yield, revenue by scale, feed usage, production cost, water usage, certification, energy consumption, and monthly trends.
- Why is Power BI a good choice for this dashboard?
Power BI offers interactive visuals, slicers, filters, easy analysis, and professional reporting. Therefore, it helps users understand data quickly and clearly.
- Can this dashboard help improve sustainability tracking?
Yes, it can. The dashboard tracks water usage, certification, and energy consumption, which are key sustainability metrics in aquaponics operations.
- How does the dashboard help financial management?
It shows revenue by market channel, revenue vs production cost by scale, and feed usage by system type. As a result, users can review profitability more effectively.
- Can this dashboard help with monthly trend analysis?
Yes. The Month Analysis page helps users track revenue, total systems, and production cost by month name. Therefore, it supports better planning and forecasting.
- Is this dashboard useful for small aquaponics businesses?
Yes, absolutely. Small, medium, and large aquaponics businesses can all benefit from better data visibility and easier reporting.
Watch the step-by-step video tutorial:
Visit our YouTube channel to learn step-by-step video tutorials
Click to buy Aquaponics Dashboard in Power BI