In today’s rapidly evolving renewable energy industry, biofuel plants generate massive amounts of operational and financial data. However, many organizations still struggle to manage this data effectively. As a result, they often rely on scattered spreadsheets and manual reports, which slow down decision-making.
That’s exactly where the Biofuel Plants Dashboard in Power BI becomes a game-changing solution. 🌱
This powerful and interactive dashboard helps you track production, monitor revenue, analyze operating margins, and evaluate performance across different dimensions such as technology type, feedstock type, country, and time.
Click to Purchases Biofuel Plants Dashboard in Power BI
In this detailed guide, you will learn everything about this dashboard—from features and structure to advantages, best practices, and FAQs.
🤔 What is a Biofuel Plants Dashboard in Power BI?
A Biofuel Plants Dashboard in Power BI is an advanced data visualization tool designed to monitor and analyze biofuel plant operations.
Instead of using multiple Excel sheets, you can centralize all your data into one interactive dashboard. Therefore, you gain better visibility and faster insights.
With this dashboard, you can easily track:
-
Operating margin %
-
Annual revenue
-
Production performance
-
Workforce distribution
-
Technology efficiency
-
Feedstock utilization
As a result, you can make smarter and faster decisions to improve plant performance.
💡 Why Do Biofuel Plants Need a Dashboard?
Biofuel plants operate in a complex environment. They deal with multiple feedstocks, technologies, and production processes. Therefore, tracking performance manually becomes difficult.
However, when you use a Power BI dashboard:
-
You reduce manual work
-
You improve data accuracy
-
You get real-time insights
-
You enhance operational efficiency
Moreover, you can quickly identify underperforming areas and take corrective actions.
📊 Key Features of the Biofuel Plants Dashboard in Power BI
This dashboard includes 5 powerful and interactive pages, each designed for specific analysis.
📌 1. Overview Page – Your Central Control Panel
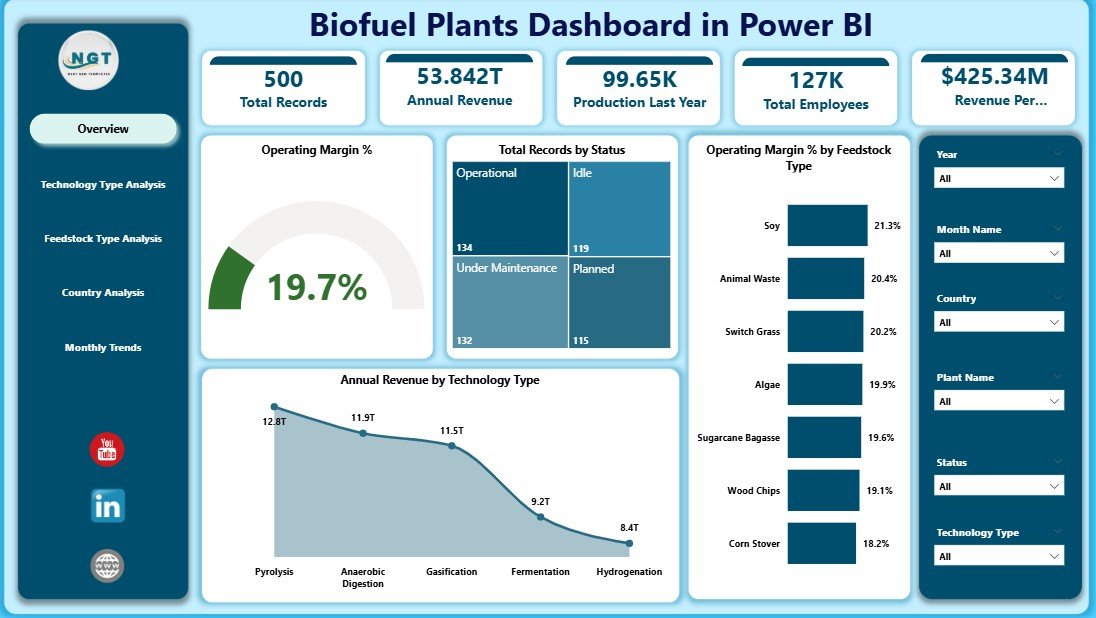
The Overview Page acts as the main summary of your entire biofuel operation.
🔹 Key Highlights:
-
KPI Cards:
-
Operating Margin %
-
Total Record by Status
-
Operating Margin % by Feedstock Type
-
Annual Revenue by Technology Type
-
-
Interactive slicers for filtering data
-
Click to Purchases Biofuel Plants Dashboard in Power BI
👉 Why It Matters:
This page gives you a quick snapshot of overall performance. Therefore, you can instantly understand how your plant is performing.
⚙️ 2. Technology Type Analysis – How Efficient is Your Technology?
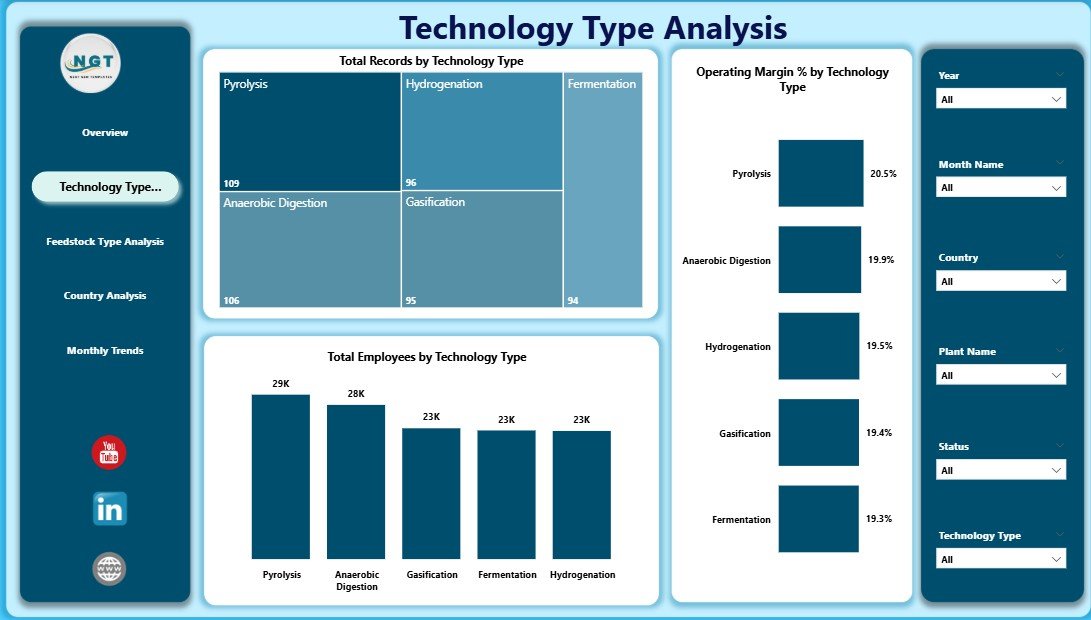
This page focuses on analyzing performance across different biofuel technologies.
🔹 Charts Included:
-
Operating Margin % by Technology Type
-
Total Record by Technology Type
-
Total Employees by Technology Type
👉 Insights You Can Gain:
-
Which technology delivers the highest profit
-
Which technology requires optimization
-
Workforce allocation across technologies
As a result, you can invest in the most profitable technologies.
🌾 3. Feedstock Type Analysis – Are You Using the Right Raw Materials?
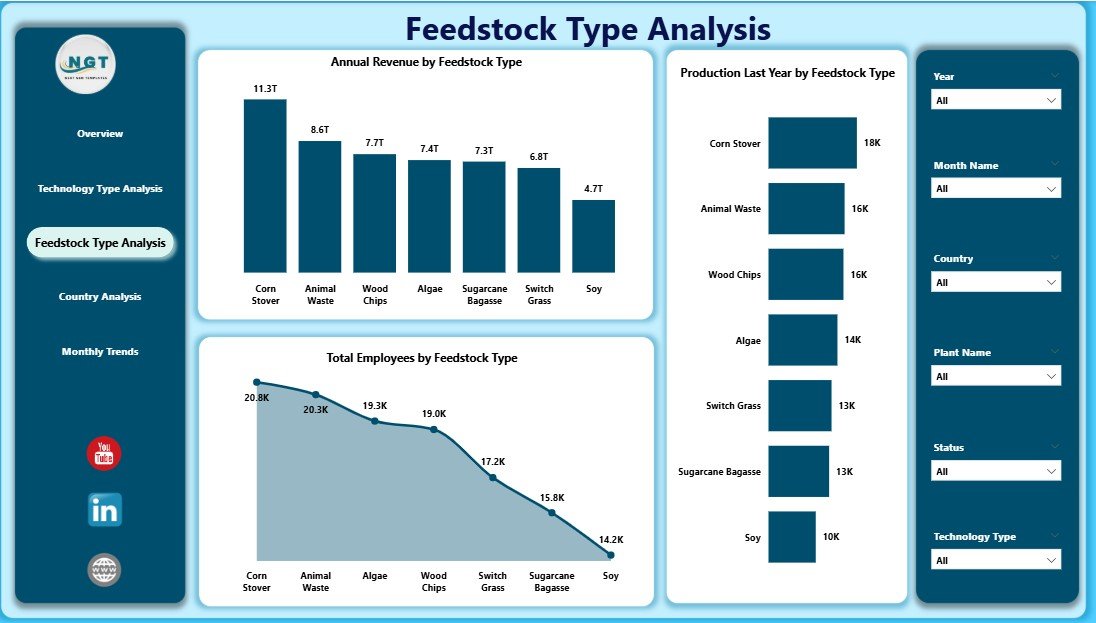
Feedstock plays a crucial role in biofuel production. Therefore, analyzing it becomes essential.
🔹 Charts Included:
-
Annual Revenue by Feedstock Type
-
Production Last Year by Feedstock Type
-
Total Employees by Feedstock Type
👉 Key Benefits:
-
Identify the most profitable feedstock
-
Compare production trends
-
Optimize resource allocation
Consequently, you can improve production efficiency and reduce costs.
Click to Purchases Biofuel Plants Dashboard in Power BI
🌍 4. Country Analysis – Where is Your Plant Performing Best?
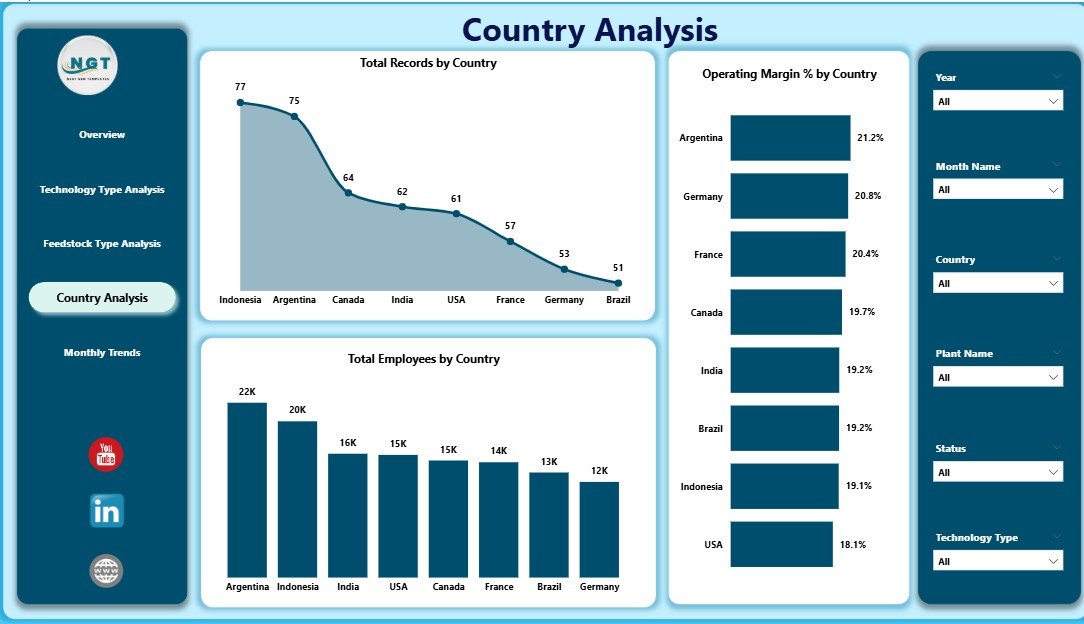
This page helps you analyze performance across different countries.
🔹 Charts Included:
-
Total Record by Country
-
Operating Margin % by Country
-
Total Employees by Country
👉 Why This Matters:
-
Compare regional performance
-
Identify high-performing locations
-
Plan expansion strategies
Therefore, you can focus on regions that generate maximum returns.
📅 5. Month Analysis – Track Trends Over Time
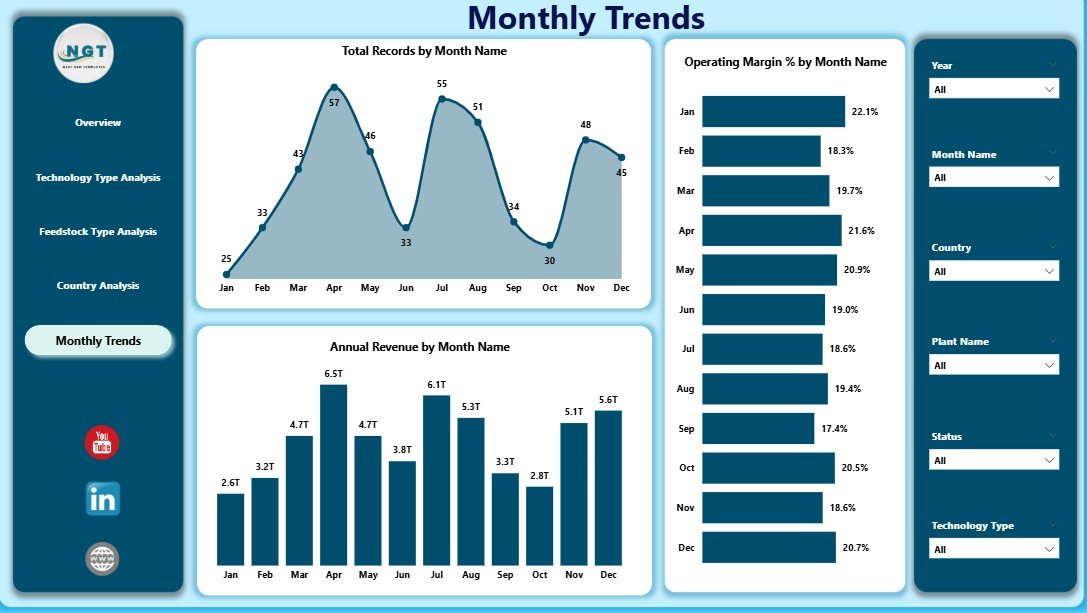
Time-based analysis is crucial for understanding growth patterns.
🔹 Charts Included:
-
Total Record by Month
-
Operating Margin % by Month
-
Annual Revenue by Month
👉 Insights:
-
Seasonal trends
-
Monthly performance fluctuations
-
Revenue growth patterns
As a result, you can forecast future performance more accurately.
📈 What KPIs Can You Track in This Dashboard?
This dashboard helps you monitor critical KPIs such as:
-
Operating Margin %
-
Annual Revenue
-
Total Production Records
-
Employee Count
-
Technology Performance
-
Feedstock Efficiency
Therefore, you can track both financial and operational performance in one place.
🎯 Advantages of Biofuel Plants Dashboard in Power BI
Using this dashboard offers several powerful advantages.
✅ 1. Real-Time Data Insights
You can access up-to-date data instantly. Therefore, you can respond quickly to changes.
✅ 2. Improved Decision-Making
Since the dashboard presents clear visuals, you can make data-driven decisions.
✅ 3. Better Resource Allocation
You can identify where resources are overused or underutilized.
✅ 4. Increased Profitability
By tracking operating margins, you can improve financial performance.
✅ 5. Centralized Data Management
All your data stays in one place. As a result, you avoid confusion and duplication.
Click to Purchases Biofuel Plants Dashboard in Power BI
🔍 What Analysis Can You Perform with This Dashboard?
This dashboard allows multiple types of analysis.
📊 1. Performance Analysis
-
Compare technologies, feedstocks, and countries
-
Identify top-performing areas
📊 2. Financial Analysis
-
Track revenue trends
-
Analyze operating margins
📊 3. Workforce Analysis
-
Monitor employee distribution
-
Optimize workforce allocation
📊 4. Trend Analysis
-
Analyze monthly growth
-
Forecast future performance
Therefore, you can cover every aspect of your biofuel operations.
🛠️ Best Practices for the Biofuel Plants Dashboard in Power BI
To get the best results, you should follow these best practices.
✔️ Keep Data Clean and Structured
Always ensure your data is accurate and well-organized.
✔️ Use Meaningful KPIs
Focus on KPIs that directly impact performance.
✔️ Update Data Regularly
Keep your dashboard updated to get real-time insights.
✔️ Use Interactive Filters
Allow users to explore data easily with slicers.
✔️ Focus on Visual Clarity
Avoid clutter and use simple visuals.
🚀 How to Use This Dashboard Effectively?
If you want to maximize the value of this dashboard, follow these steps:
-
Import your data into Power BI
-
Connect it to the dashboard
-
Use slicers to filter data
-
Analyze KPIs regularly
-
Take action based on insights
As a result, you can continuously improve your operations.
👥 Who Can Benefit from This Dashboard?
This dashboard is useful for:
-
Biofuel plant managers
-
Renewable energy analysts
-
Operations teams
-
Financial analysts
-
Government agencies
Therefore, anyone involved in biofuel operations can benefit from it.
🌱 How Does This Dashboard Support Sustainable Energy Goals?
Biofuel plants play a key role in sustainable energy. Therefore, tracking their performance becomes essential.
With this dashboard:
-
You improve efficiency
-
You reduce waste
-
You optimize resource usage
-
You support renewable energy growth
As a result, you contribute to a greener future.
🧠 Tips to Improve Dashboard Performance
Click to Purchases Biofuel Plants Dashboard in Power BI
To make your dashboard even better:
-
Use DAX for advanced calculations
-
Optimize data models
-
Reduce unnecessary visuals
-
Use drill-through features
Therefore, your dashboard becomes faster and more powerful.
📌 Common Challenges and How to Overcome Them
❌ Data Inconsistency
👉 Solution: Clean and validate your data regularly
❌ Slow Performance
👉 Solution: Optimize your data model
❌ Complex Visuals
👉 Solution: Use simple and clear charts
🔮 Future Scope of Biofuel Analytics
The future of biofuel analytics looks promising.
-
AI-driven insights
-
Predictive analytics
-
Real-time IoT integration
-
Advanced forecasting
Therefore, dashboards will become even more powerful in the coming years.
🏁 Conclusion
The Biofuel Plants Dashboard in Power BI is a powerful tool that transforms complex data into meaningful insights.
Instead of relying on manual reports, you can now monitor performance, track KPIs, and make smarter decisions—all in one place.
Moreover, this dashboard helps improve efficiency, increase profitability, and support sustainable energy goals.
If you want to take your biofuel operations to the next level, this dashboard is the perfect solution. 🚀
❓ Frequently Asked Questions (FAQs)
1. What is the purpose of a Biofuel Plants Dashboard?
It helps track and analyze biofuel plant performance using interactive visuals.
2. Can I customize this dashboard?
Yes, you can modify KPIs, charts, and filters based on your needs.
3. What tools are required to use this dashboard?
You need Power BI Desktop or Power BI Service.
4. Is this dashboard suitable for small biofuel plants?
Yes, it works for both small and large operations.
5. How often should I update the data?
You should update it regularly to ensure accurate insights.
6. Can I track multiple plants in one dashboard?
Yes, you can analyze multiple plants using filters and slicers.
Visit our YouTube channel to learn step-by-step video tutorials