In today’s fast-changing event industry, book fairs generate a huge amount of data every single day. From visitor attendance to vendor sales and revenue tracking, organizers must handle multiple data points at once. However, when this data stays scattered across different sheets, it becomes difficult to extract meaningful insights. As a result, decision-making slows down, and opportunities for growth get missed.
Click to Purchases Book Fairs Dashboard in Excel
So, how can event organizers track performance, improve visitor engagement, and increase profitability—all in one place?
👉 The answer is the Book Fairs Dashboard in Excel.
This powerful, ready-to-use Excel dashboard helps you monitor, analyze, and optimize every aspect of your book fair operations. Moreover, it transforms raw data into clear visual insights using charts, KPIs, and interactive filters.
In this detailed guide, you will learn everything about this dashboard, including its features, structure, advantages, best practices, and frequently asked questions.
📊 What is a Book Fairs Dashboard in Excel?
A Book Fairs Dashboard in Excel is an advanced reporting tool designed to track and analyze key performance indicators (KPIs) related to book fair events.
Instead of using multiple reports, this dashboard allows you to:
- 📈 Track revenue and profit trends
- 👥 Monitor visitor attendance and engagement
- 🏬 Analyze vendor performance
- 🌦️ Evaluate external factors like weather impact
- 📊 Compare performance across cities and events
Therefore, it becomes easier to make quick and data-driven decisions.
🚀 Why Should You Use a Book Fairs Dashboard?
Many event organizers still rely on manual reports and spreadsheets. However, this approach consumes time and increases the chances of errors.
On the other hand, a dashboard simplifies everything.
Here’s why you should use it:
- ✅ Centralizes all data in one place
- ✅ Improves decision-making speed
- ✅ Provides real-time insights
- ✅ Reduces manual work
- ✅ Enhances event planning accuracy
As a result, you can focus more on improving event quality instead of managing data.
🧩 Key Features of Book Fairs Dashboard in Excel
This dashboard comes with a well-structured design and interactive elements. It includes 5 analytical pages along with support and data sheets.
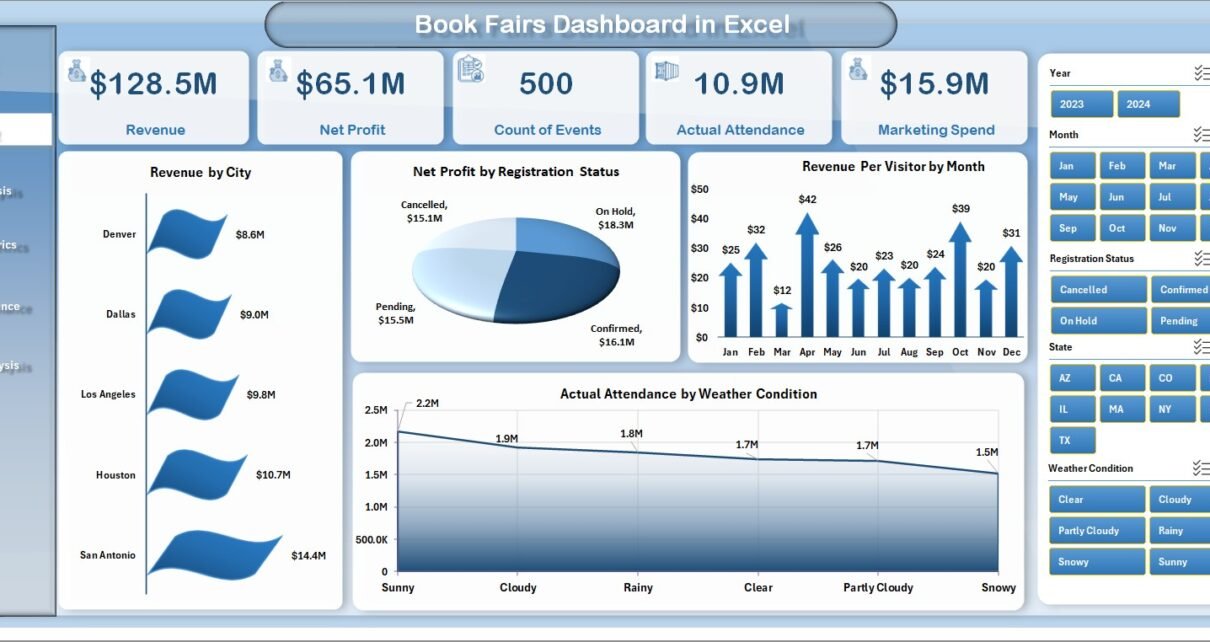
🏠 1. Overview Page – Get a Complete Snapshot
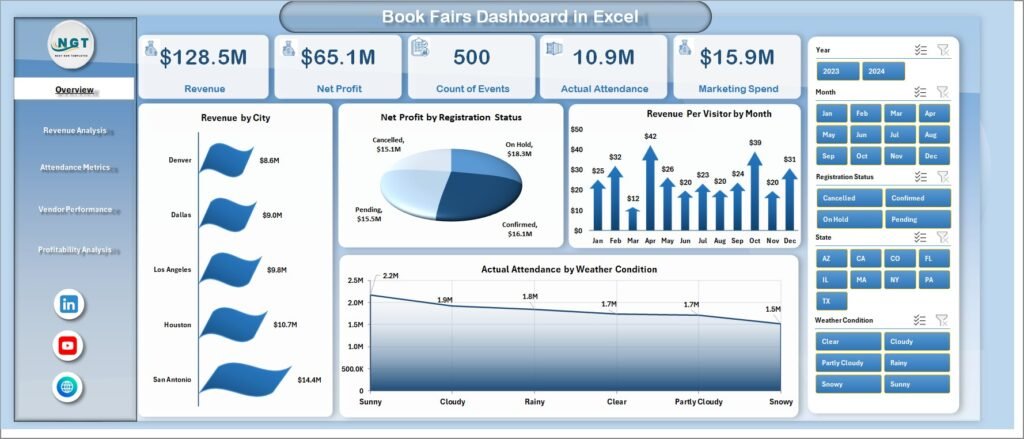
The Overview Page acts as the main control panel of the dashboard. It gives you a quick summary of overall performance.
Click to Purchases Book Fairs Dashboard in Excel
🔹 Key Elements:
- 🎯 Right-side slicer for dynamic filtering
- 📊 4 KPI cards for quick insights
- 📈 4 interactive charts
📊 Charts Included:
- Revenue by City
- Net Profit by Registration Status
- Revenue Per Visitor by Month
- Actual Attendance by Weather Condition
👉 Therefore, this page helps you understand overall performance at a glance.
💰 2. Revenue Analysis – Track Earnings Efficiently
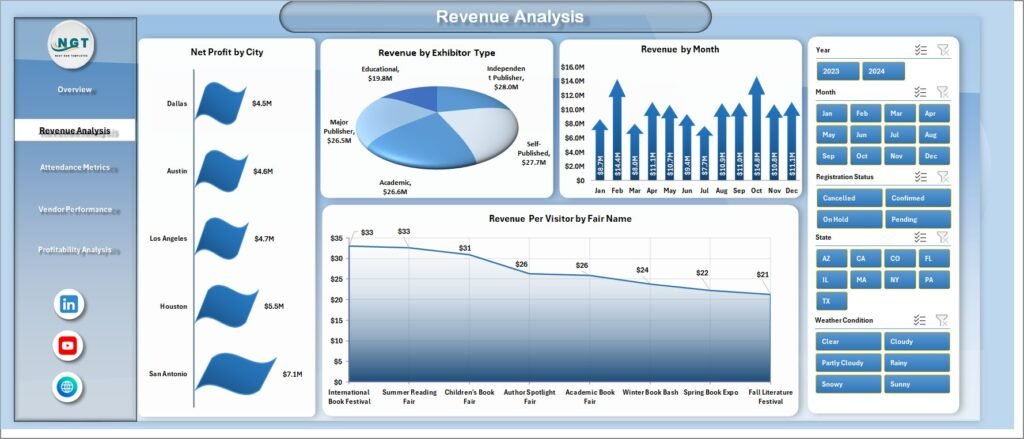
The Revenue Analysis Page focuses on financial performance across different dimensions.
🔹 Key Features:
- Right-side slicer for filtering
- Multiple revenue-focused charts
📊 Charts Included:
- Net Profit by City
- Revenue by Exhibitor Type
- Revenue by Month
- Revenue Per Visitor by Fair Name
👉 As a result, you can identify top-performing fairs and revenue sources.
👥 3. Attendance Metrics – Understand Visitor Behavior
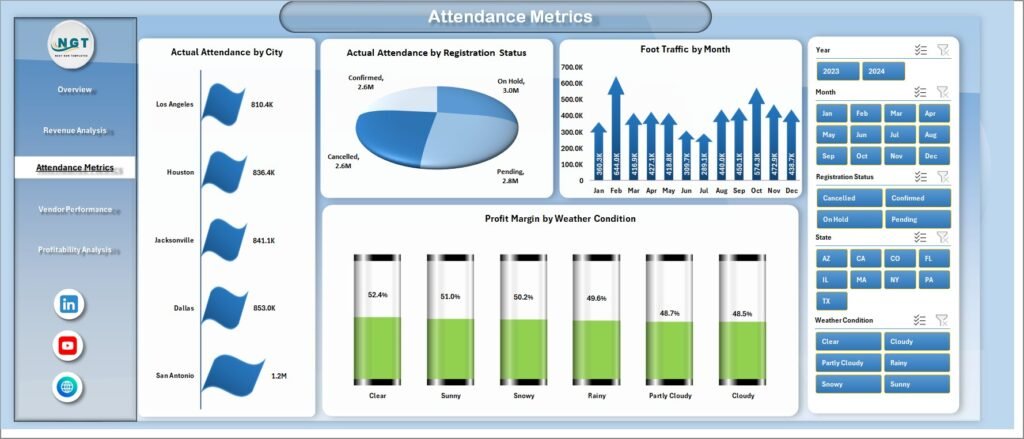
The Attendance Metrics Page helps you analyze visitor trends and engagement levels.
🔹 Key Features:
- Interactive slicers
- Visitor-focused analytics
📊 Charts Included:
- Actual Attendance by City
- Actual Attendance by Registration Status
- Foot Traffic by Month
- Profit Margin by Weather Condition
👉 This allows you to understand how different factors influence attendance.
🏬 4. Vendor Performance – Measure Exhibitor Success
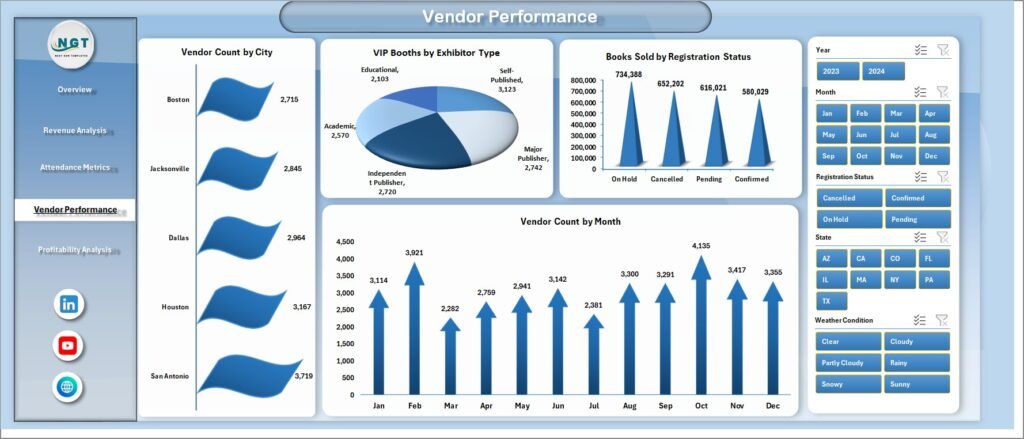
The Vendor Performance Page provides insights into exhibitor activity and sales.
🔹 Key Features:
- Vendor-focused analytics
- Easy comparison across categories
📊 Charts Included:
- Vendor Count by City
- VIP Booths by Exhibitor Type
- Books Sold by Registration Status
- Vendor Count by Month
👉 Therefore, you can evaluate which vendors contribute the most to success.
📉 5. Profitability Analysis – Optimize Financial Outcomes
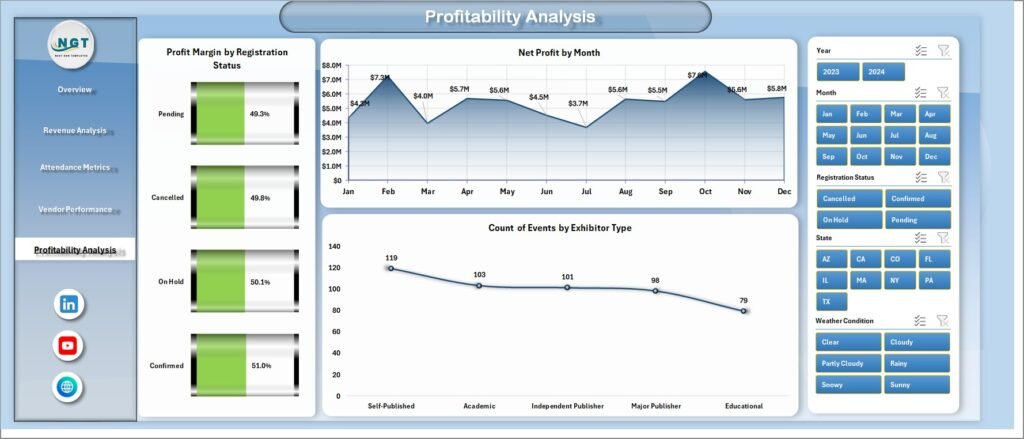
The Profitability Analysis Page focuses on margins and overall financial health.
📊 Charts Included:
- Profit Margin by Registration Status
- Net Profit by Month
- Count of Events by Exhibitor Type
👉 This helps you identify profitable events and improve future planning.
Click to Purchases Book Fairs Dashboard in Excel
🧾 Support Sheet & Data Sheet
🔹 Support Sheet:
- Stores backend calculations
- Helps in smooth dashboard functioning
🔹 Data Sheet:
- Contains raw data inputs
- Drives all charts and KPIs
👉 Therefore, maintaining clean data ensures accurate insights.
🎯 How Does This Dashboard Help Event Organizers?
This dashboard plays a crucial role in improving event performance.
🔹 It helps you:
- 📊 Monitor KPIs in real time
- 📈 Identify high-performing cities and fairs
- 👥 Analyze visitor patterns
- 💰 Track revenue and profit trends
- 🏬 Evaluate vendor contribution
As a result, you can make smarter and faster decisions.
🌟 Advantages of Book Fairs Dashboard in Excel
Using this dashboard offers several benefits. Let’s explore them.
✅ Better Decision Making
You can analyze data quickly and take immediate action.
✅ Time Saving
Since the dashboard automates calculations, you save hours of manual work.
✅ Improved Accuracy
The risk of human error reduces significantly.
✅ Enhanced Visualization
Charts and graphs make data easy to understand.
✅ Increased Profitability
You can identify profitable areas and focus on them.
⚠️ Opportunities for Improvement
Although this dashboard is powerful, you can still improve it further.
🔹 Possible Enhancements:
- Add predictive analytics for future trends
- Integrate real-time data updates
- Include customer satisfaction metrics
- Add drill-through functionality
👉 These improvements can make the dashboard even more effective.
🛠️ Best Practices for the Book Fairs Dashboard in Excel
To get the best results, you should follow these best practices.
✅ Keep Data Clean and Updated
Always use accurate and updated data for reliable insights.
✅ Use Slicers Effectively
Apply filters to analyze specific segments easily.
✅ Focus on Key KPIs
Track only the most important metrics to avoid clutter.
✅ Customize Based on Needs
Modify charts and KPIs according to your event requirements.
✅ Regularly Review Performance
Analyze trends frequently to improve future events.
📈 How to Use the Book Fairs Dashboard Step-by-Step?
If you are new to dashboards, follow these simple steps:
1️⃣ Enter Data
Add event data into the Data Sheet.
2️⃣ Refresh Dashboard
Update pivot tables and charts.
3️⃣ Apply Filters
Use slicers to focus on specific data.
4️⃣ Analyze Insights
Review charts and KPIs.
5️⃣ Take Action
Make data-driven decisions to improve performance.
🧠 Who Can Benefit from This Dashboard?
This dashboard is useful for multiple professionals.
👇 Ideal Users:
- 📚 Event organizers
- 🏬 Book fair managers
- 📊 Data analysts
- 💼 Business owners
- 🎯 Marketing teams
👉 Therefore, anyone involved in event management can benefit from it.
🔍 Common Use Cases of Book Fairs Dashboard
You can use this dashboard in many scenarios.
📌 Examples:
- Analyze performance of different book fairs
- Compare revenue across cities
- Track vendor contributions
- Evaluate attendance trends
- Optimize pricing and booth allocation
🏁 Conclusion
The Book Fairs Dashboard in Excel is a powerful tool that helps you transform raw event data into actionable insights. It simplifies data analysis, improves decision-making, and boosts overall event performance.
Moreover, since it offers interactive features, visual reports, and structured analysis, you can easily identify trends, solve problems, and plan better events.
👉 Therefore, if you want to manage your book fairs efficiently and maximize profitability, this dashboard is a must-have tool.
❓ Frequently Asked Questions (FAQs)
❓ What is a Book Fairs Dashboard in Excel used for?
It is used to track, analyze, and improve book fair performance using data-driven insights.
❓ Can beginners use this dashboard?
Yes, the dashboard is user-friendly and easy to use, even for beginners.
❓ Do I need advanced Excel skills?
No, basic Excel knowledge is enough to use this dashboard.
❓ Can I customize the dashboard?
Yes, you can modify KPIs, charts, and layouts based on your needs.
❓ How often should I update the data?
You should update the data regularly to get accurate and real-time insights.
❓ Can this dashboard handle large data?
Yes, Excel can handle large datasets efficiently when structured properly.
Visit our YouTube channel to learn step-by-step video tutorials
Click to Purchases Book Fairs Dashboard in Excel