In today’s competitive auction industry, data plays a crucial role in driving success. Auction houses handle hundreds or even thousands of lots, bidders, consignors, and transactions every single day. However, when this data remains scattered across multiple spreadsheets, decision-making becomes slow and inefficient.
So, how can auction houses track performance, monitor bids, and maximize revenue—all in one place?
The answer is the Auction Houses Dashboard in Excel.
This powerful, ready-to-use Excel dashboard helps auction managers, analysts, and business owners monitor key metrics, analyze trends, and make smarter decisions. Moreover, it converts raw auction data into meaningful insights through interactive charts and visuals.
In this detailed guide, you will learn everything about this dashboard, including its features, structure, benefits, best practices, and FAQs.
Click to buy Auction Houses Dashboard in Excel
What is an Auction Houses Dashboard in Excel?
An Auction Houses Dashboard in Excel is an advanced reporting tool that allows auction businesses to track and analyze all key performance indicators (KPIs) in one place.
Instead of managing multiple reports, you can:
- Track estimates, bids, and revenue
- Monitor winning bids and performance
- Analyze buyers and consignors
- Compare auction house performance
- Identify monthly trends
As a result, you gain complete visibility into your auction operations.
Why Do Auction Houses Need a Dashboard?
Auction houses deal with complex and fast-moving data. Without a centralized system, they often face challenges.
Key Problems Without a Dashboard:
- Data scattered across multiple sheets
- Difficulty tracking bids and revenue
- No real-time insights Slow decision-making
- Limited visibility into buyer behavior
However, when you use an Excel dashboard, you can solve all these problems efficiently.
Key Features of Auction Houses Dashboard in Excel
This dashboard includes multiple sheet tabs, each designed for specific analysis. Let’s explore them in detail.
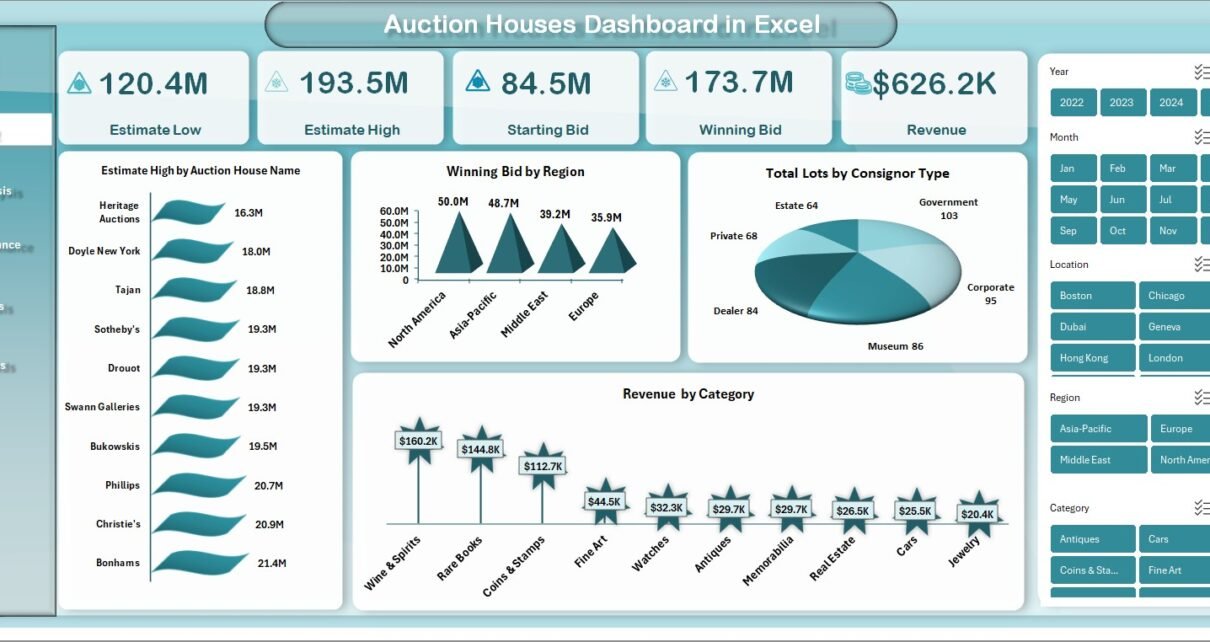
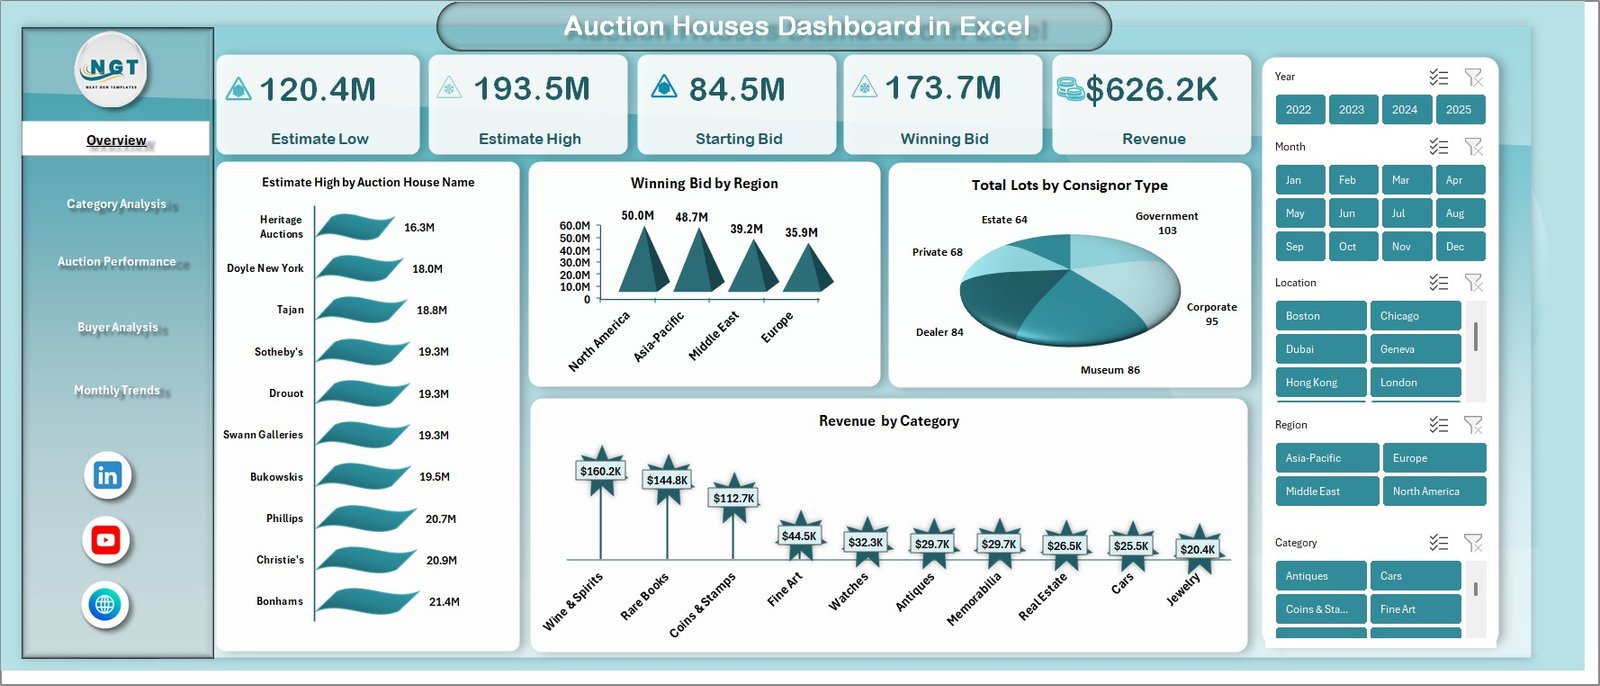
Overview Sheet – Your Control Center
The Overview Sheet provides a high-level summary of auction performance. It helps you quickly understand key metrics.
Metrics Covered:
- Estimate Low
- Estimate High
- Starting Bid
- Winning Bid
- Revenue
Charts Included:
- Estimate High by Auction House Name
- Winning Bid by Region
- Total Lots by Consignor Type
- Revenue by Category
As a result, you get a complete snapshot of your auction performance.
Click to buy Auction Houses Dashboard in Excel
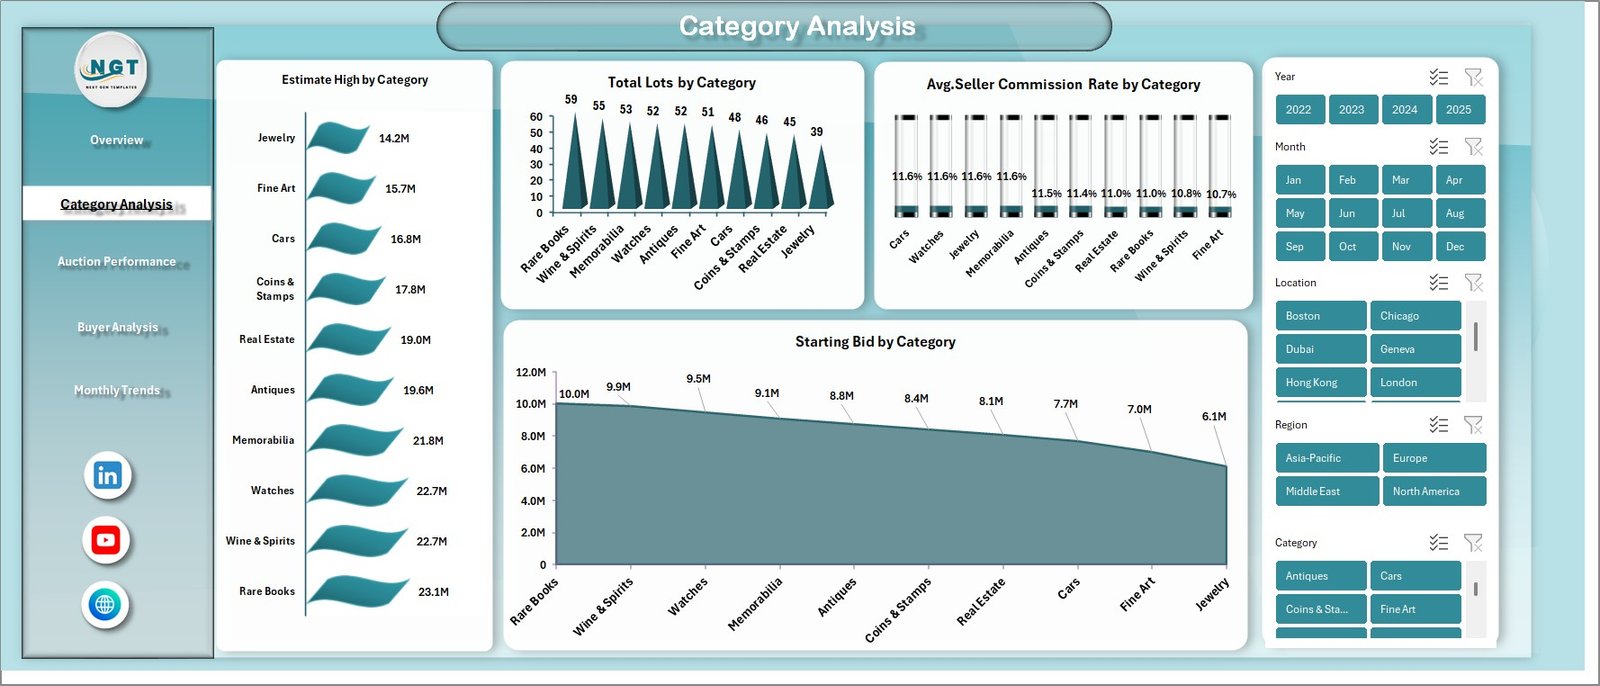
Category Analysis – Which Categories Perform Best?
The Category Analysis sheet helps you understand how different categories perform.
Key Insights:
- Estimate High by Category
- Total Lots by Category
- Avg. Seller Commission Rate by Category
- Starting Bid by Category Therefore, you can identify high-performing categories and adjust your strategy accordingly.
Click to buy Auction Houses Dashboard in Excel
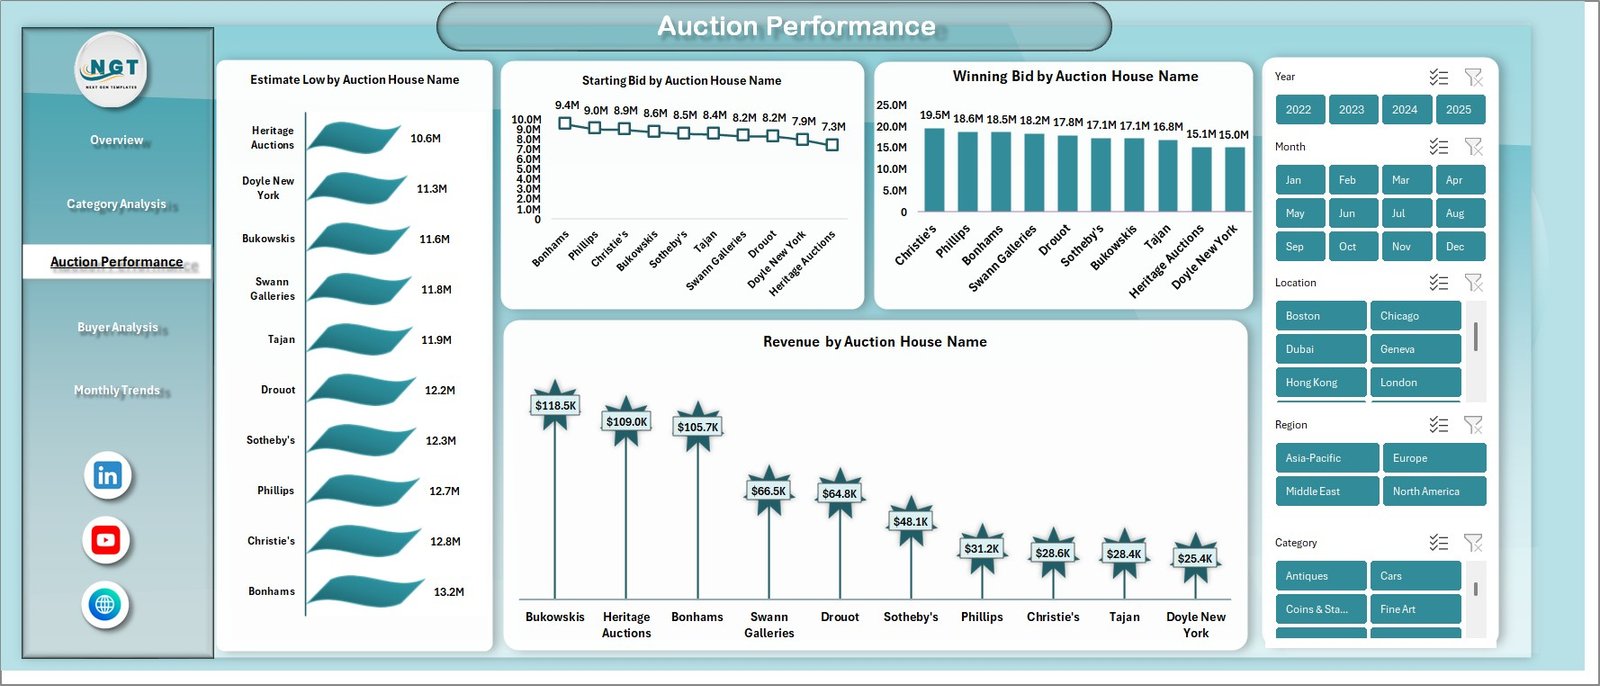
Auction Performance – How Are Auction Houses Performing?
This sheet focuses on the performance of individual auction houses.
Metrics Included:
- Estimate Low by Auction House Name
- Starting Bid by Auction House Name
- Winning Bid by Auction House Name
- Revenue by Auction House Name
Consequently, you can compare performance across auction houses and identify top performers.
Click to buy Auction Houses Dashboard in Excel
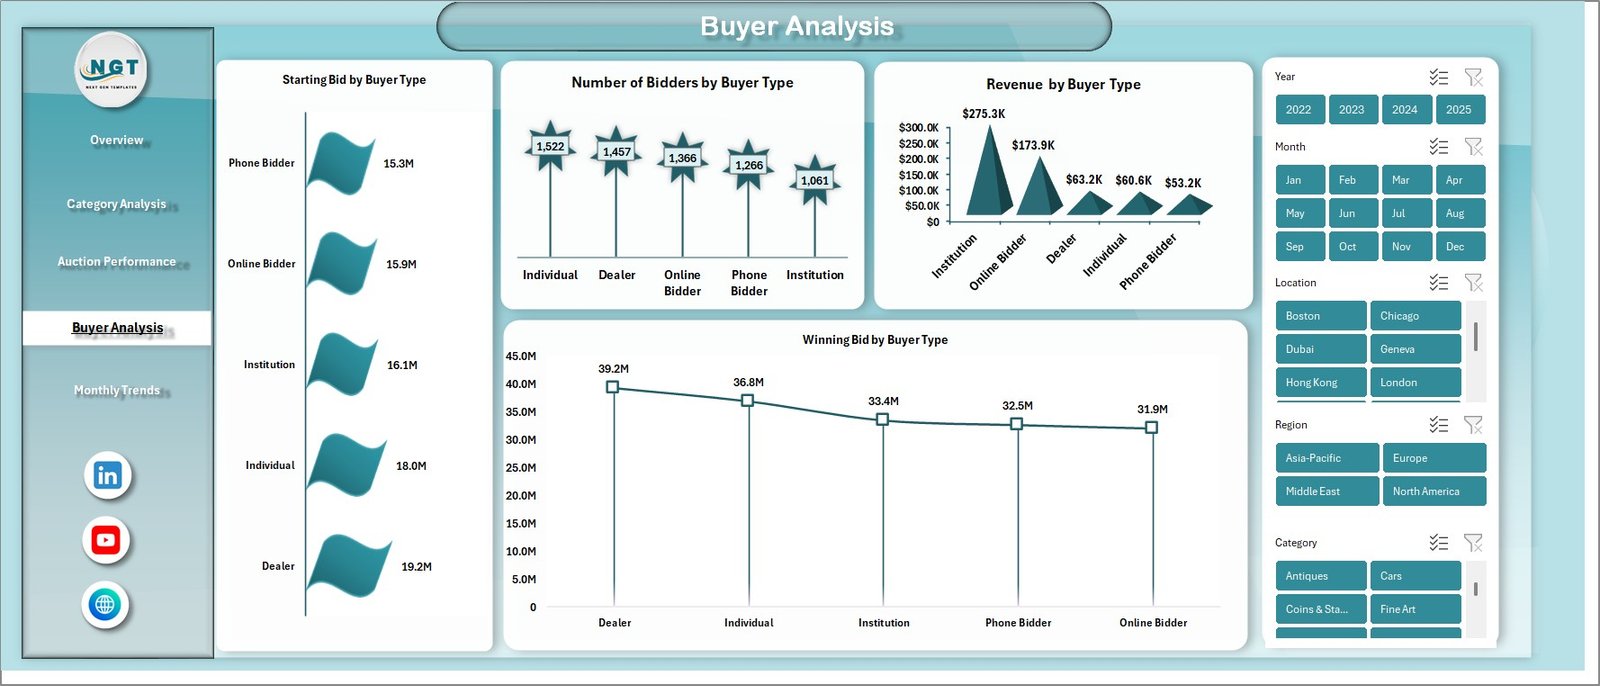
Buyer Analysis – Understanding Your Buyers
The Buyer Analysis sheet provides insights into buyer behavior.
Key Metrics:
- Starting Bid by Buyer Type
- Number of Bidders by Buyer Type
- Revenue by Buyer Type
- Winning Bid by Buyer Type
As a result, you can understand which buyer segments generate the most revenue.
Click to buy Auction Houses Dashboard in Excel
Monthly Trends – Track Performance Over Time
The Monthly Trends sheet helps you analyze trends over time.
Metrics Covered:
- Estimate High by Month
- Number of Bidders by Month
- Paid by Month
Therefore, you can identify seasonal patterns and optimize your auction strategy.

Click to buy Auction Houses Dashboard in Excel
How Does the Auction Houses Dashboard Work?
The dashboard works by connecting raw data to interactive visuals.
Step-by-Step Process:
- Enter data into Excel sheets
- Dashboard updates automatically
- Charts and KPIs refresh instantly
- Analyze performance in real time
Because of this automation, you save time and improve accuracy.
Advantages of Auction Houses Dashboard in Excel
Using this dashboard offers multiple benefits.
Key Advantages:
- Centralized data management
- Real-time performance tracking
- Easy-to-use interface
- Better decision-making
- Improved revenue tracking
- Enhanced buyer insights
- Customizable and scalable
In short, this dashboard helps you run auctions more efficiently.
Who Can Benefit from This Dashboard?
This dashboard serves multiple users in the auction industry.
Ideal Users:
- Auction house owners
- Auction managers
- Data analysts
- Financial teams
- Art and antique dealers
Therefore, anyone involved in auction operations can benefit from this tool.
How Can This Dashboard Improve Business Performance?
This dashboard does more than just display data. It helps you take action.
Key Improvements:
- Identify high-value categories
- Increase revenue through insights
- Target the right buyers
- Plan auctions based on trends
- Improve operational efficiency
As a result, your business grows faster.
Best Practices for the Auction Houses Dashboard in Excel
To get the best results, you should follow these best practices.
Data Management:
- Keep your data clean and consistent
- Use standardized formats
- Update data regularly
Dashboard Optimization:
- Use filters and slicers
- Focus on key KPIs
- Avoid cluttered visuals
Analysis Tips:
- Compare monthly trends
- Track top-performing categories
- Monitor buyer behavior
Maintenance:
- Review data accuracy frequently
- Update formulas when needed
- Backup your data
By following these practices, you can maximize the dashboard’s effectiveness.
Future of Auction Analytics in Excel
The auction industry continues to evolve. Therefore, dashboards will become even more important.
Emerging Trends:
- Advanced data visualization
- AI-driven insights
- Integration with online auction platforms
- Mobile-friendly dashboards
As a result, businesses that use dashboards will stay ahead of the competition.
Conclusion
The Auction Houses Dashboard in Excel is a powerful tool that simplifies complex auction data and turns it into actionable insights. It helps you track performance, analyze trends, and improve decision-making—all in one place.
Moreover, with features like overview metrics, category analysis, buyer insights, and monthly trends, this dashboard provides a complete solution for auction management.
If you want to improve efficiency, increase revenue, and make smarter decisions, this dashboard is the perfect choice.
Frequently Asked Questions (FAQs)
- What is an Auction Houses Dashboard in Excel?
It is a tool that helps track and analyze auction data such as bids, revenue, and buyer behavior.
- Who can use this dashboard?
Auction house owners, managers, analysts, and financial teams can use it.
- Can I customize this dashboard?
Yes, you can modify charts, metrics, and layouts according to your needs.
- Does this dashboard update automatically?
Yes, once you input data, the dashboard updates automatically.
- What data do I need for this dashboard?
You need data related to bids, estimates, buyers, categories, and revenue.
- Is Excel suitable for auction analytics?
Yes, Excel provides powerful tools like charts, pivot tables, and formulas for analysis.
- How does this dashboard improve decision-making?
It provides real-time insights and clear visuals, helping you make informed decisions.
- Can small auction houses use this dashboard?
Absolutely! It works for both small and large businesses.
- How often should I update the data?
You should update it regularly, preferably after each auction.
- What makes this dashboard unique?
Its ability to combine multiple insights—financial, buyer, and performance—in one place.
Visit our YouTube channel to learn step-by-step video tutorials
Click to buy Auction Houses Dashboard in Excel