In today’s fast-moving retail industry, especially in the baby products segment, businesses deal with massive amounts of data every day. From tracking sales and profit to analyzing customer behavior and delivery performance, everything requires careful monitoring. However, when this data stays scattered across spreadsheets, decision-making becomes slow and confusing.
So, how can retailers simplify their data analysis and make faster, smarter decisions?
The answer is the Baby Products Retail Dashboard in Power BI.
This powerful and interactive dashboard helps retailers, store managers, and business analysts track key metrics in real time. Moreover, it transforms raw data into meaningful insights using dynamic visuals. As a result, businesses can improve performance, increase profitability, and enhance customer satisfaction.
Click to buy Baby Products Retail Dashboard in Power BI
What is a Baby Products Retail Dashboard in Power BI?
A Baby Products Retail Dashboard in Power BI is an advanced data visualization tool designed to monitor and analyze retail performance specifically for baby product businesses.
Instead of using multiple reports, this dashboard allows you to:
- Track total sales, profit, and costs in real time
- Analyze customer behavior and preferences
- Monitor delivery performance and shipping efficiency
- Compare performance across regions, store types, and product categories
Therefore, businesses can make data-driven decisions quickly and efficiently.
Why Do You Need a Baby Products Retail Dashboard?
Managing retail data manually creates several challenges. For example, you may struggle to track performance, identify trends, or make timely decisions. However, with a Power BI dashboard, everything becomes easier and more organized.
Key Reasons to Use This Dashboard:
- Centralizes all retail data in one place
- Provides real-time performance insights
- Helps identify profitable products and regions
- Improves operational efficiency
- Enhances customer satisfaction
As a result, you can stay ahead of competitors and grow your business faster.
Key Features of Baby Products Retail Dashboard in Power BI
This dashboard includes 5 powerful and interactive pages, each designed to provide specific insights.
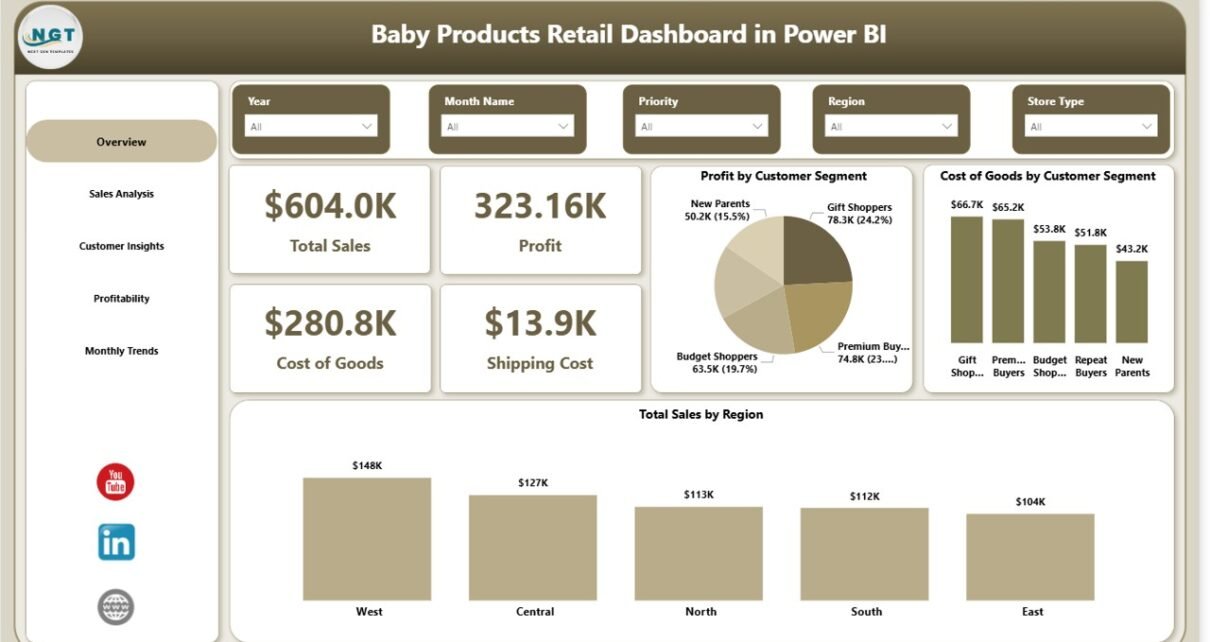
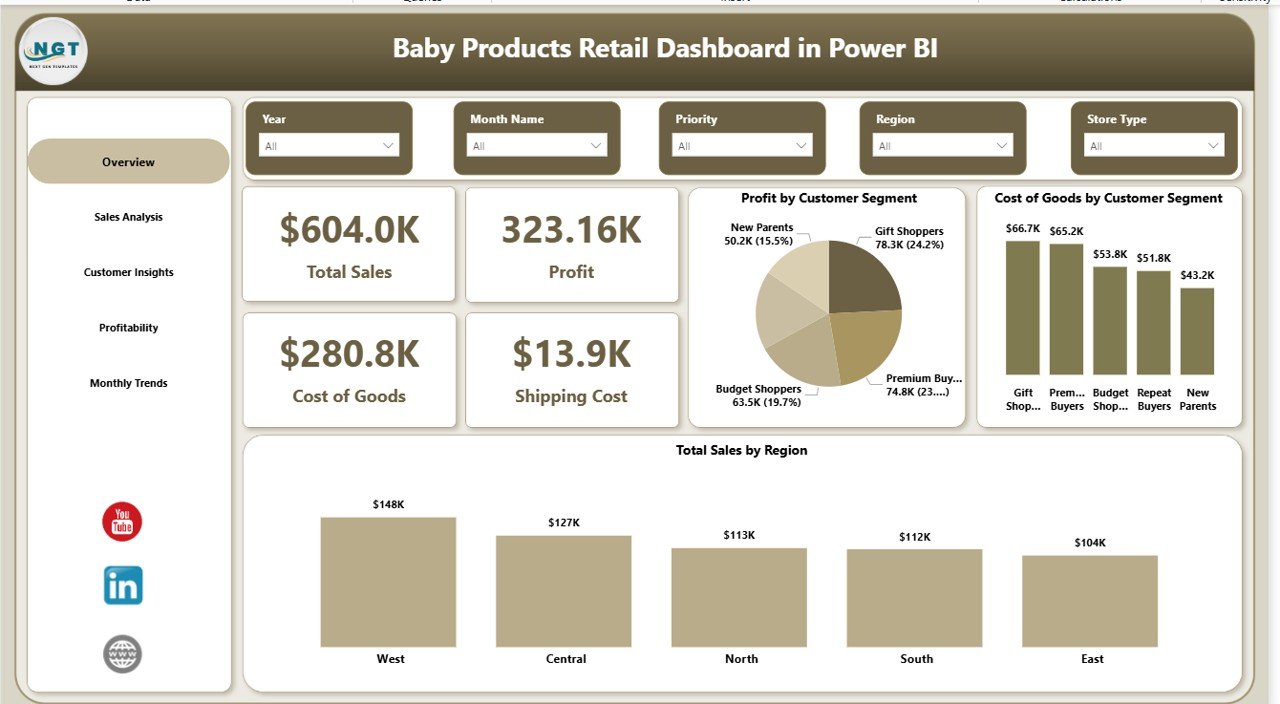
Overview Page – Get a Complete Business Snapshot
The Overview Page acts as the central hub of the dashboard. It provides a quick summary of your business performance.
KPI Cards:
- Total Sales
- Profit
- Cost of Goods
- Shipping Cost
Charts Included:
- Profit by Customer Segment
- Cost of Goods by Customer Segment
- Total Sales by Region
Therefore, you can instantly understand your overall performance and identify key trends.
Click to buy Baby Products Retail Dashboard in Power BI
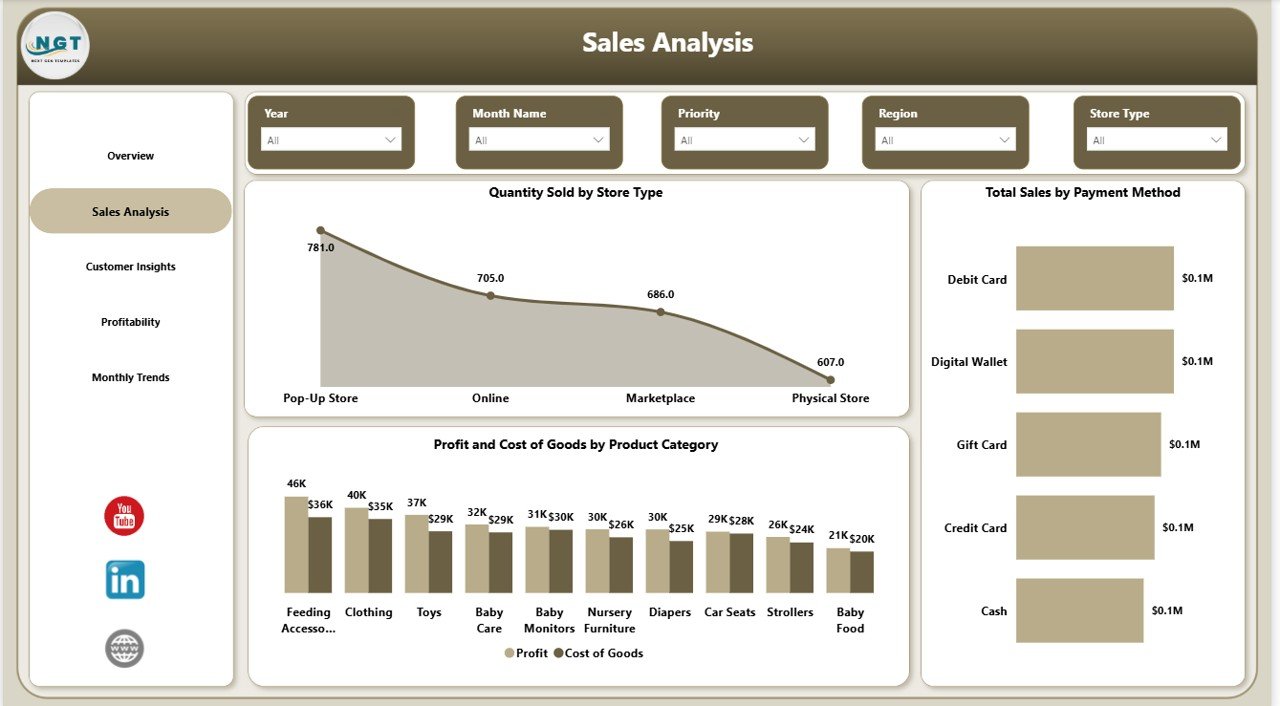
Sales Analysis – Understand Your Sales Performance
The Sales Analysis Page focuses on detailed sales insights.
Charts Included:
- Quantity Sold by Store Type
- Total Sales by Payment Method
- Profit and Cost of Goods by Product Category
As a result, you can identify which store types and payment methods perform best.
Click to buy Baby Products Retail Dashboard in Power BI
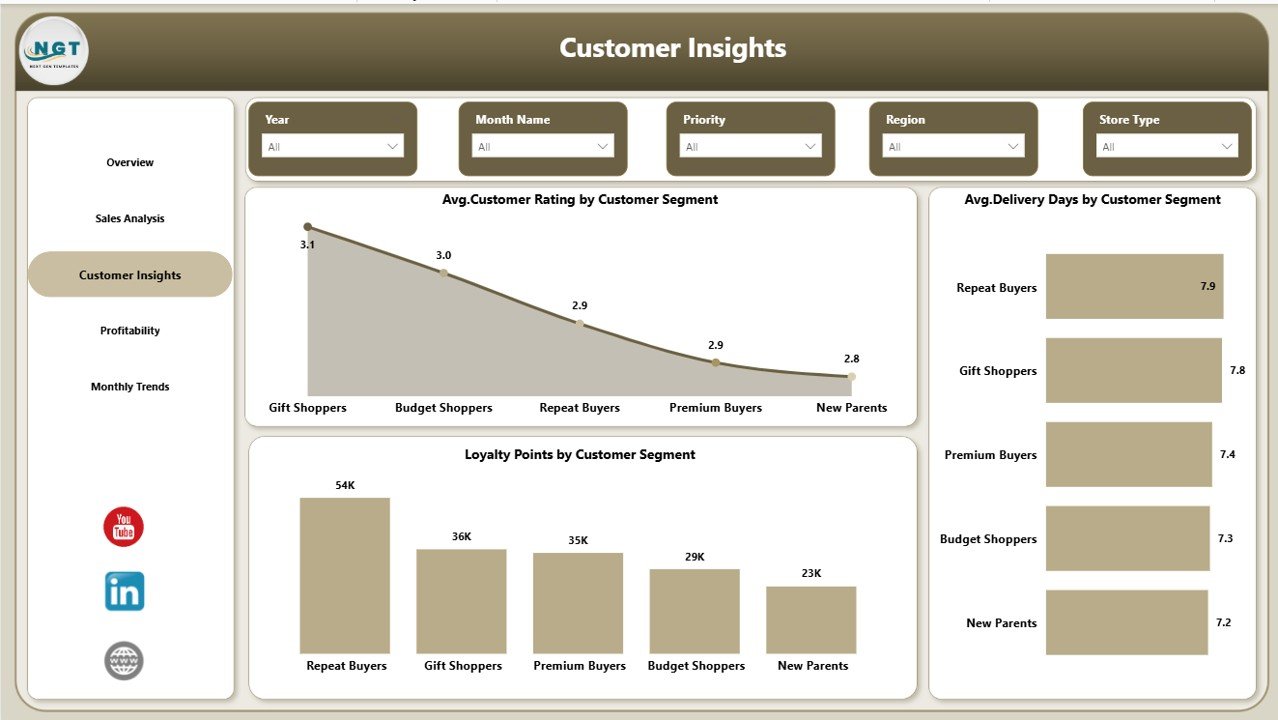
Customer Insights – Know Your Customers Better
The Customer Insights Page helps you analyze customer behavior and satisfaction.
Charts Included:
- Average Customer Rating by Customer Type
- Average Delivery Days by Customer Type
- Loyalty Points by Customer Type
Therefore, you can improve customer experience and build long-term relationships.
Click to buy Baby Products Retail Dashboard in Power BI
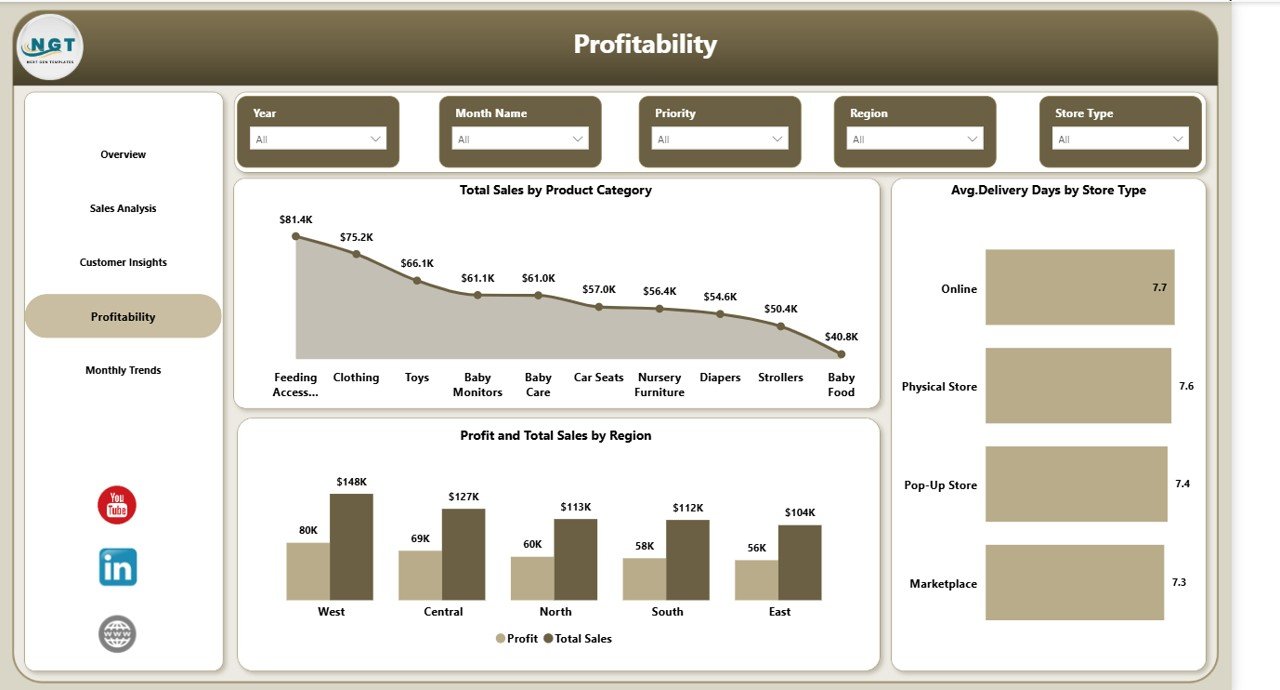
Profitability – Track Financial Performance
The Profitability Page focuses on understanding profit trends and cost efficiency.
Charts Included:
- Total Sales by Product Category
- Average Delivery Days by Store Type
- Profit and Total Sales by Region
As a result, you can identify high-profit areas and reduce unnecessary costs.
Click to buy Baby Products Retail Dashboard in Power BI
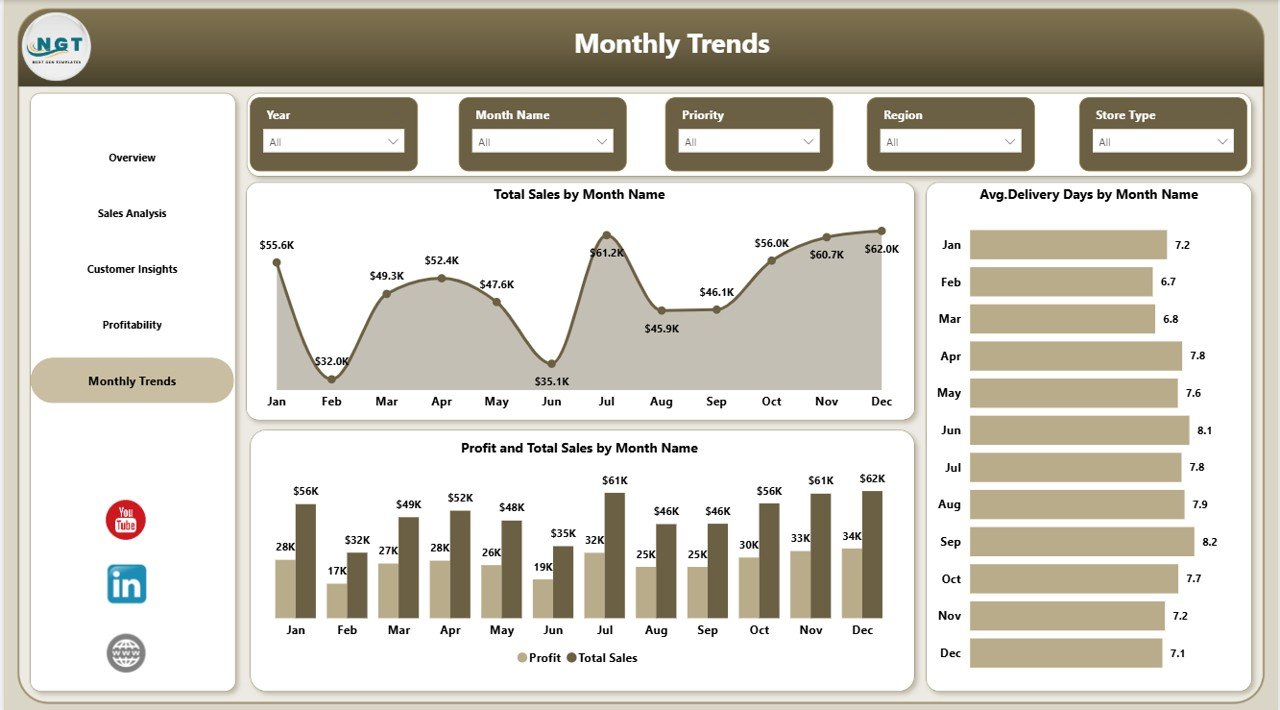
Monthly Trend – Monitor Performance Over Time
The Monthly Trend Page helps you analyze performance trends over time. Charts Included:
- Total Sales by Month
- Average Delivery Days by Month
- Profit and Total Sales by Month
Therefore, you can track growth patterns and plan future strategies effectively.
Click to buy Baby Products Retail Dashboard in Power BI
Advantages of Baby Products Retail Dashboard in Power BI
Using this dashboard provides several powerful benefits. Let’s explore them:
Improved Decision-Making
- You get real-time insights into your business
- You can make faster and smarter decisions
Better Data Visualization
- Interactive charts simplify complex data
- You can easily understand performance trends
Increased Profitability
- You identify high-performing products and regions
- You optimize pricing and cost strategies
Enhanced Customer Insights
- You understand customer preferences better
- You improve satisfaction and loyalty
Time-Saving Automation
- You eliminate manual reporting
- You reduce errors and save time
How Does This Dashboard Improve Retail Performance?
This dashboard does more than just display data. It actively helps improve business performance.
Here’s how:
- It highlights top-performing products
- It identifies low-profit areas
- It tracks delivery efficiency
- It shows customer satisfaction levels
- It supports strategic planning
As a result, you can take action quickly and improve overall performance.
Best Practices for the Baby Products Retail Dashboard in Power BI
To get the best results, you should follow these best practices:
Keep Your Data Clean
- Always use accurate and updated data
- Remove duplicate or incorrect entries
Use Clear KPIs
- Focus on important metrics like sales, profit, and cost
- Avoid unnecessary data overload
Update Data Regularly
- Refresh your dashboard frequently
- Ensure real-time insights
Customize Visuals
- Use colors and layouts that improve readability
- Highlight important trends
Train Your Team
- Ensure your team understands how to use the dashboard
- Encourage data-driven decision-making
Opportunities for Improvement
Although this dashboard is powerful, you can still improve it further:
Add Forecasting Features
- Predict future sales and demand
Include Inventory Tracking
- Monitor stock levels and avoid shortages
Integrate with CRM Systems
- Connect customer data for deeper insights
Add Drill-Through Analysis
- Enable detailed data exploration
Who Can Benefit from This Dashboard?
This dashboard suits a wide range of users:
- Baby product retailers
- Store managers
- Business analysts
- E-commerce sellers
- Supply chain managers
Therefore, anyone involved in retail operations can benefit from this tool.
How to Use the Baby Products Retail Dashboard?
Using this dashboard is simple and effective:
- Import your data into Power BI
- Connect your data sources
- Refresh the dashboard
- Use filters (slicers) to analyze data
- Review insights and take action
As a result, you can turn raw data into valuable business insights.
Conclusion
The Baby Products Retail Dashboard in Power BI is a must-have tool for modern retailers. It simplifies data analysis, improves decision-making, and helps businesses grow faster.
Moreover, it provides a complete view of your retail operations, from sales and profitability to customer insights and trends. Therefore, you can make smarter decisions and stay ahead in the competitive market.
If you want to transform your retail data into powerful insights, this dashboard is the perfect solution.
Frequently Asked Questions (FAQs)
- What is a Baby Products Retail Dashboard in Power BI?
It is a data visualization tool that helps track sales, profit, customer behavior, and performance metrics for baby product businesses.
- Who can use this dashboard?
Retailers, store managers, analysts, and e-commerce sellers can use it effectively.
- Does this dashboard require Power BI knowledge?
Basic knowledge helps, but the dashboard is user-friendly and easy to use.
- Can I customize this dashboard?
Yes, you can modify visuals, KPIs, and data sources as per your needs.
- How often should I update the dashboard?
You should update it regularly to ensure accurate and real-time insights.
- Can this dashboard improve profits?
Yes, it helps identify profitable products and reduce unnecessary costs.
- Is this dashboard suitable for small businesses?
Yes, both small and large businesses can benefit from it.
- Can I integrate this dashboard with other tools?
Yes, Power BI supports integration with multiple data sources and tools.
Visit our YouTube channel to learn step-by-step video tutorials
Click to buy Baby Products Retail Dashboard in Power BI