In today’s fast-changing infrastructure environment, maintaining bridges safely and efficiently has become more important than ever. Governments, engineers, and maintenance teams handle massive amounts of inspection data, condition reports, repair schedules, and compliance requirements. However, when this data stays scattered across multiple files, decision-making becomes slow and inefficient.
So, how can you monitor bridge conditions, track maintenance activities, and improve safety—all in one place?
Click to Purchases Bridge Maintenance Dashboard in Excel
👉 The answer is the Bridge Maintenance Dashboard in Excel.
This powerful, ready-to-use Excel dashboard helps you centralize all your bridge maintenance data into one interactive platform. As a result, you can analyze conditions, track inspections, and make faster, data-driven decisions.
In this detailed guide, you will learn everything about this dashboard, including its features, benefits, best practices, and frequently asked questions.
📊 What is a Bridge Maintenance Dashboard in Excel?
A Bridge Maintenance Dashboard in Excel is an interactive reporting tool designed to monitor and analyze the condition, inspection status, and maintenance performance of bridges.
Instead of using multiple reports, this dashboard allows you to:
- Track inspection records in real time
- Monitor structural conditions (deck, superstructure, substructure)
- Analyze maintenance status (completed, pending, in progress)
- Evaluate urgency levels for repairs
- Identify trends over time
Moreover, it transforms raw data into meaningful insights using charts, KPI cards, and slicers. Therefore, you can quickly identify critical issues and take action.
🚀 Why Do You Need a Bridge Maintenance Dashboard?
Click to Purchases Bridge Maintenance Dashboard in Excel
Managing bridge infrastructure involves complex data. However, without proper visualization, it becomes difficult to prioritize repairs and ensure safety.
Here’s why this dashboard becomes essential:
- ✅ Centralizes all bridge data in one place
- ✅ Improves decision-making with real-time insights
- ✅ Helps prioritize urgent repairs
- ✅ Enhances safety and compliance
- ✅ Saves time by automating reports
As a result, you gain complete control over your bridge maintenance operations.
🔑 Key Features of Bridge Maintenance Dashboard in Excel
This ready-to-use dashboard comes with 5 interactive analysis pages, a data sheet, and a support sheet built using Pivot Tables.
Let’s explore each page in detail 👇
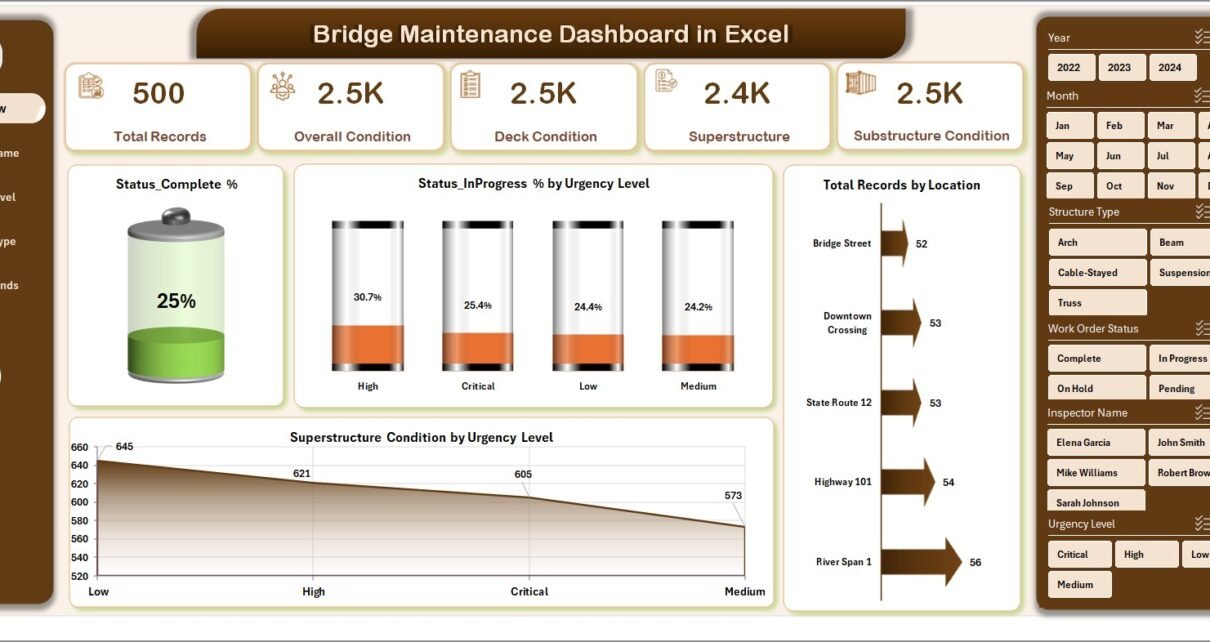
📌 1. Overview Page – Get Instant Insights
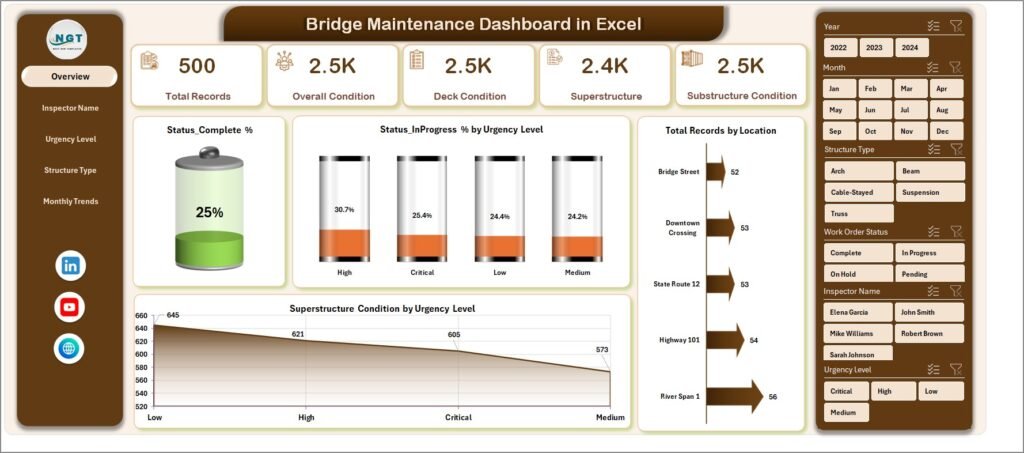
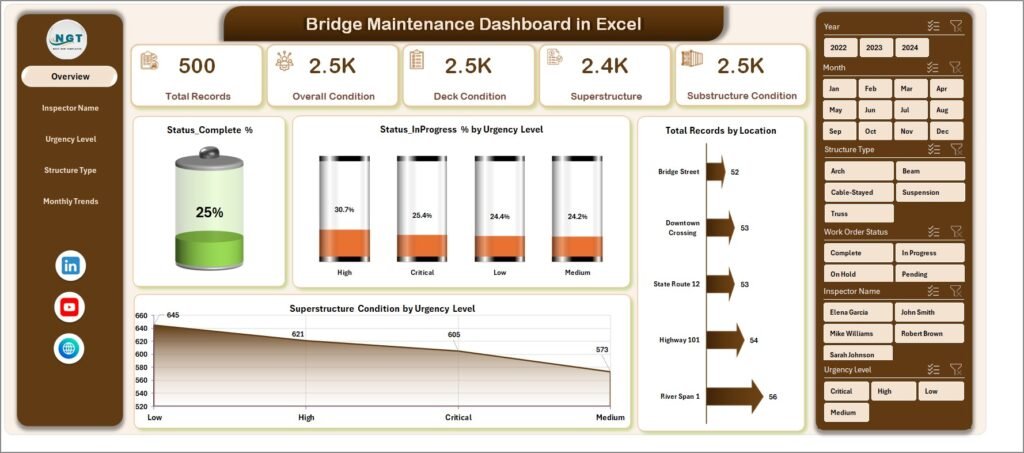
The Overview Page acts as the central hub of the dashboard. It provides a quick snapshot of overall bridge conditions and maintenance status.
Key Elements:
- 🎯 4 KPI Cards
- Status Completed %
- Status In Progress %
- Total Records
- Key Condition Indicators
- 📊 Charts Included
- Status Completed % by Urgency Level
- Status In Progress % by Urgency Level
- Total Records by Location
- Superstructure Condition by Urgency Level
- 🎛 Slicer (Right Side)
- Filter data instantly based on selected criteria
👉 Therefore, this page helps you understand the overall performance at a glance.
Click to Purchases Bridge Maintenance Dashboard in Excel
👷 2. Inspector Name Analysis – Track Inspector Performance
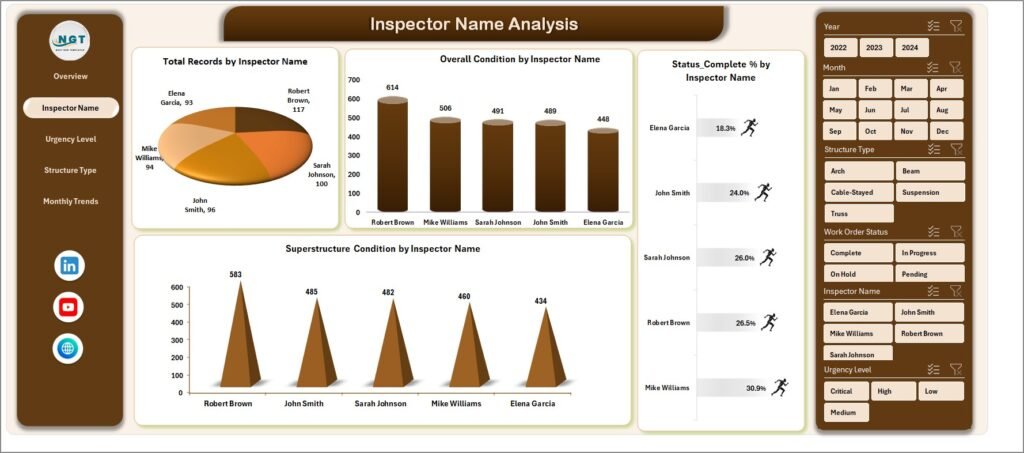
This page focuses on analyzing inspection activities by inspectors.
Key Insights:
- 📊 Total Record by Inspector Name
- 📊 Overall Condition by Inspector Name
- 📊 Status Completed % by Inspector Name
- 📊 Superstructure Condition by Inspector Name
👉 As a result, you can evaluate inspector efficiency and identify performance gaps.
⚠️ 3. Urgency Level Analysis – Prioritize Repairs
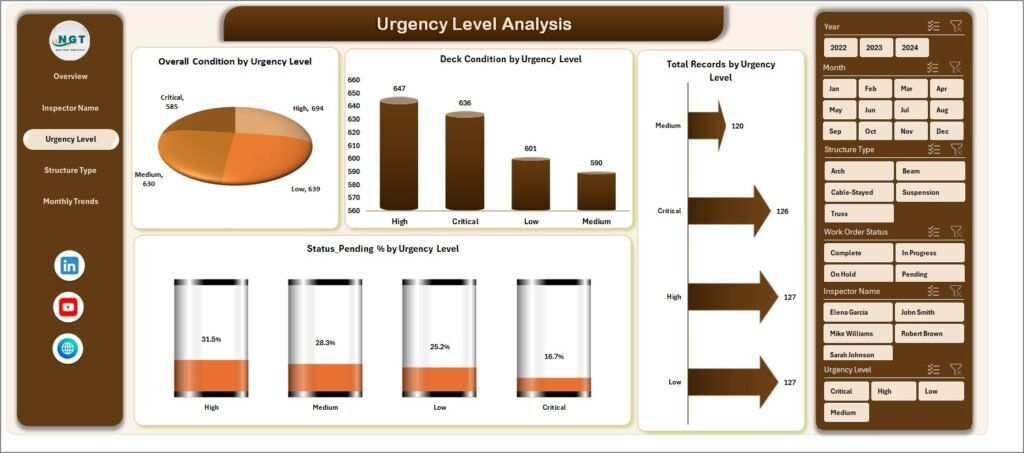
This page helps you identify which bridges require immediate attention.
Charts Included:
- 📊 Overall Condition by Urgency Level
- 📊 Deck Condition by Urgency Level
- 📊 Total Record by Urgency Level
- 📊 Status Pending % by Urgency Level
👉 Therefore, you can prioritize high-risk bridges and plan maintenance accordingly.
🏗 4. Structure Type Analysis – Deep Structural Insights
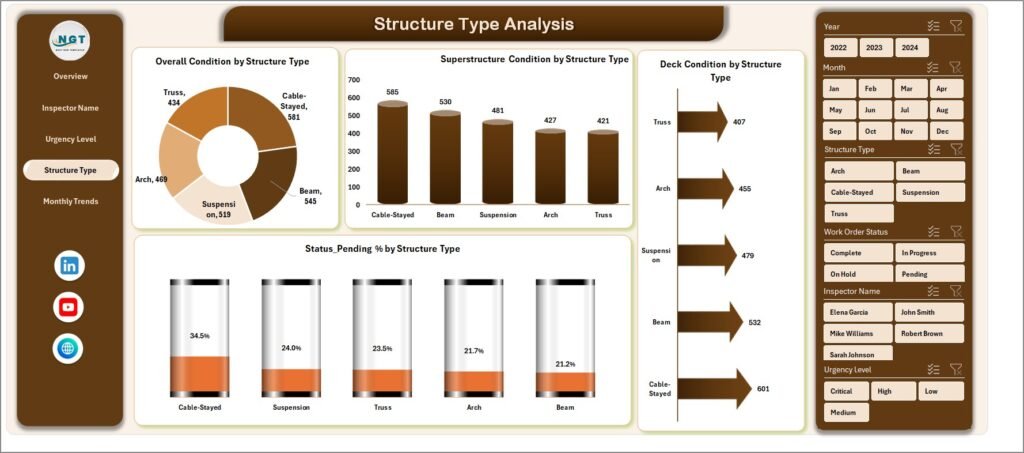
This page provides analysis based on different bridge structure types.
Key Charts:
- 📊 Overall Condition by Structure Type
- 📊 Superstructure Condition by Structure Type
- 📊 Deck Condition by Structure Type
- 📊 Status Pending % by Structure Type
👉 As a result, you can identify which structure types require more maintenance.
Click to Purchases Bridge Maintenance Dashboard in Excel
📅 5. Monthly Trends – Track Performance Over Time
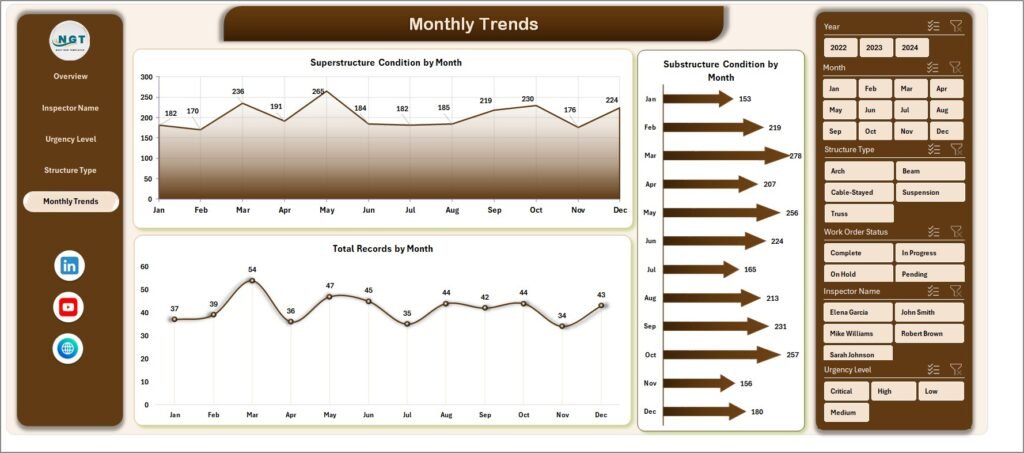
This page helps you monitor trends and changes over time.
Charts Included:
- 📊 Superstructure Condition by Month
- 📊 Substructure Condition by Month
- 📊 Total Records by Month
👉 Therefore, you can identify patterns and improve long-term planning.
📂 Support Sheet – The Engine Behind the Dashboard
The Support Sheet contains Pivot Tables that power all charts and visuals.
- Automates calculations
- Enables dynamic filtering
- Ensures real-time updates
👉 Without this sheet, the dashboard cannot function efficiently.
📑 Data Sheet – Input Your Data Easily
The Data Sheet is where you enter your raw data.
Typical Columns Include:
- Bridge ID
- Location
- Inspector Name
- Inspection Date
- Structure Type
- Deck Condition
- Superstructure Condition
- Substructure Condition
- Urgency Level
- Status
👉 Once you update this sheet, the entire dashboard updates automatically.
🌟 Advantages of Bridge Maintenance Dashboard in Excel
Using this dashboard offers multiple benefits. Let’s explore them:
✅ 1. Centralized Data Management
- Store all bridge data in one place
- Avoid scattered spreadsheets
✅ 2. Real-Time Insights
- Instantly track performance
- Make faster decisions
✅ 3. Improved Safety
- Identify critical issues early
- Reduce risk of structural failure
✅ 4. Better Resource Allocation
- Focus on high-priority repairs
- Optimize maintenance budgets
✅ 5. Easy to Use
- No advanced technical skills required
- Simple interface with slicers and charts
🔧 Opportunities for Improvement in Bridge Maintenance
Click to Purchases Bridge Maintenance Dashboard in Excel
Even though the dashboard is powerful, you can enhance it further.
🚀 Possible Improvements:
- Add predictive maintenance using historical data
- Integrate with IoT sensors for real-time monitoring
- Include cost tracking for repairs
- Add GIS mapping for location-based insights
- Use Power BI for advanced analytics
👉 Therefore, continuous improvement can make your system even more effective.
📈 Best Practices for the Bridge Maintenance Dashboard
To get the best results, follow these best practices:
✔ Keep Data Updated
- Enter inspection data regularly
- Avoid outdated information
✔ Use Standardized Data Formats
- Maintain consistency in entries
- Prevent errors in analysis
✔ Monitor KPIs Regularly
- Track performance weekly or monthly
- Identify trends early
✔ Use Filters Effectively
- Analyze specific locations or inspectors
- Gain deeper insights
✔ Train Your Team
- Ensure users understand the dashboard
- Improve adoption and efficiency
🧠 How Does This Dashboard Improve Decision-Making?
This dashboard does not just show data—it tells a story.
- It highlights urgent issues
- It shows performance trends
- It identifies weak areas
👉 As a result, decision-makers can:
- Plan maintenance schedules
- Allocate budgets effectively
- Improve infrastructure safety
❓ Frequently Asked Questions (FAQs)
1. What is the main purpose of this dashboard?
The main purpose is to track and analyze bridge maintenance data in one centralized system.
2. Do I need advanced Excel skills to use it?
No, the dashboard is user-friendly and requires only basic Excel knowledge.
3. Can I customize the dashboard?
Yes, you can easily modify charts, KPIs, and data fields based on your needs.
4. How often should I update the data?
You should update the data regularly, preferably after each inspection.
5. Can this dashboard handle large datasets?
Yes, Excel can handle large datasets, but performance depends on system capacity.
6. Is this dashboard suitable for government projects?
Yes, it is ideal for government agencies, contractors, and engineering firms.
7. Can I integrate this with other tools?
Yes, you can connect it with Power BI or other systems for advanced analytics.
🏁 Conclusion
The Bridge Maintenance Dashboard in Excel is a powerful tool that simplifies complex infrastructure data into clear and actionable insights. It helps you monitor bridge conditions, track maintenance activities, and prioritize repairs effectively.
Visit our YouTube channel to learn step-by-step video tutorials
Click to Purchases Bridge Maintenance Dashboard in Excel