Blockchain Development Dashboard in Power BI is a powerful, ready-to-use analytics solution designed for blockchain project managers, development teams, and technology leads who want to monitor every aspect of their blockchain development lifecycle — from sprint planning to cost management — in one clean, interactive report. If you’re tired of jumping between spreadsheets and tools just to get a project update, this dashboard is built for you.
Click to Purchases Blockchain Development Dashboard in Power BI
Introduction to Blockchain Development Dashboard in Power BI
Blockchain technology is reshaping industries — from finance and healthcare to supply chain and real estate. But managing blockchain development projects is complex. You need to track budgets, monitor sprint velocity, assess platform performance, measure team efficiency, and keep projects on schedule — all at the same time.
That’s exactly where the Blockchain Development Dashboard in Power BI becomes your most valuable asset. This multi-page, interactive dashboard is built to give decision-makers and project teams a clear, real-time picture of every key metric. Whether you’re managing a DeFi platform, an NFT marketplace, or a private enterprise blockchain, this template adapts to your data and delivers actionable insights instantly.
Built with Microsoft Power BI, one of the world’s leading business intelligence platforms, this dashboard leverages dynamic slicers, DAX measures, and interactive charts to make your data speak for itself.
Key Features of Blockchain Development Dashboard in Power BI
This dashboard is not just a report — it’s a complete project intelligence tool. Here are some of its standout features:
- 5 Dedicated Report Pages — Each page focuses on a specific dimension of your blockchain project: Overview, Sprint Analysis, Platform Insights, Team Performance, and Project Tracking.
- Interactive Slicers — Filter data by development phase, priority, sprint, platform, team, and status without any manual effort.
- KPI Cards — High-level summary cards show Total Budget, Total Actual Cost, Total Records, and Average Completion at a glance.
- Dynamic Charts — Bar charts, donut charts, line charts, and stacked visuals give you full analytical coverage.
- Sprint-Level Analysis — Track story points, actual hours, and bug counts sprint by sprint.
- Platform Comparison — Compare performance across multiple blockchain platforms side by side.
- Team Productivity Tracking — Measure budget allocation and completion rates across teams.
- Project Budget Monitoring — See how budget is distributed across projects, months, and statuses.
- Clean, Professional Design — Designed to be presentation-ready and executive-friendly.
Dashboard Pages Explanation
The Blockchain Development Dashboard in Power BI is organized into five well-structured pages. Let’s walk through each one in detail.
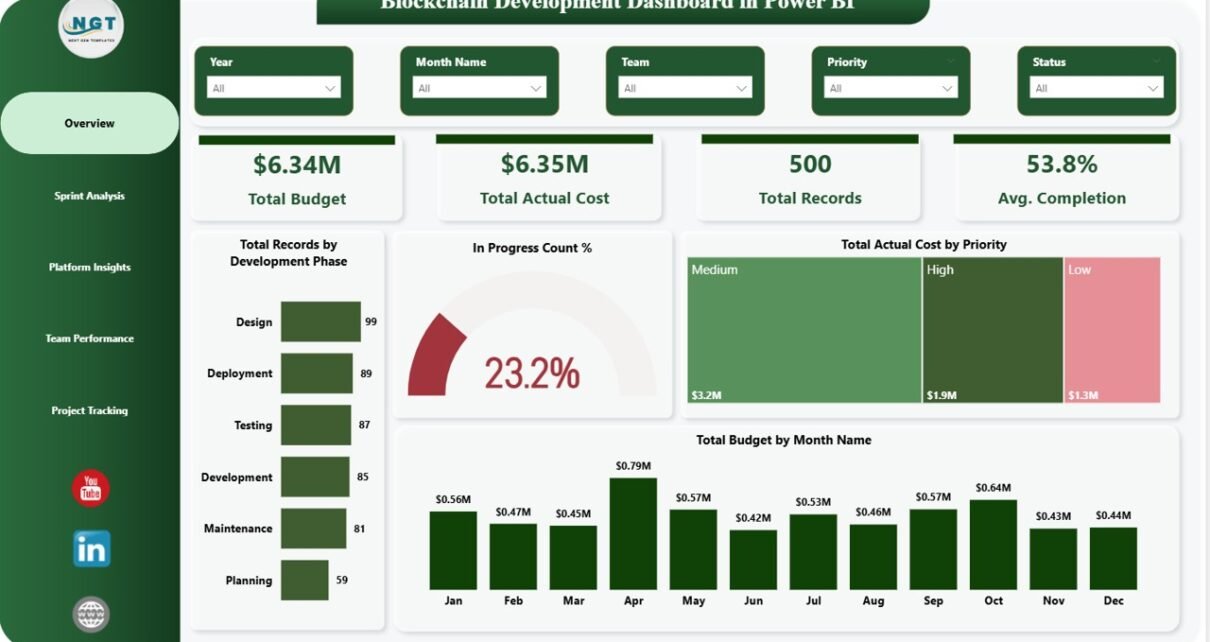
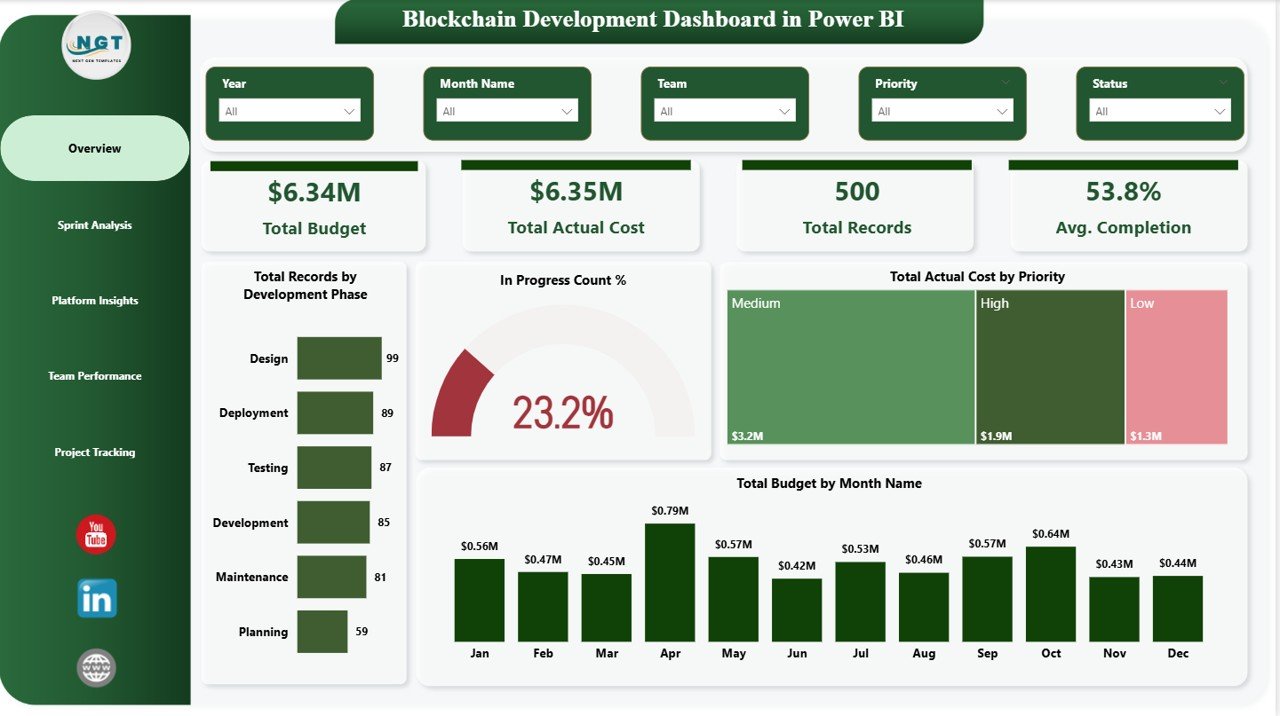
Page 1 — Overview
The Overview page is your command center. It presents high-level KPI cards at the top so you can immediately assess the state of your blockchain projects without scrolling or digging through data. Multiple slicers are placed strategically to let you filter the entire page in just one click.
Click to Purchases Blockchain Development Dashboard in Power BI
KPI Cards on the Overview Page
- Total Budget — Shows the total approved budget across all blockchain projects, giving stakeholders a quick view of financial scope.
- Total Actual Cost — Displays the total amount already spent, helping you compare planned versus actual expenditure at a glance.
- Total Records — Indicates the total number of tasks, issues, or development items being tracked in the system.
- Avg. Completion — Reflects the average completion percentage across all tracked projects or development phases, showing overall progress instantly.
Charts on the Overview Page
- Total Records by Development Phase — This chart breaks down the volume of development tasks across phases like Planning, In Progress, Testing, and Completion. It helps you instantly identify which phases are most active or overloaded.
- In Progress Count % — A donut or gauge chart showing what percentage of total records are currently in progress. It gives a quick pulse check on active development workload.
- Total Actual Cost by Priority — Visualizes spending distribution across High, Medium, and Low priority tasks. This helps project leads see where most of the budget is being consumed based on urgency.
- Total Budget by Month Name — A trend line or bar chart showing how budget is spread across months. It supports financial planning and helps identify months of high spending or project peaks.
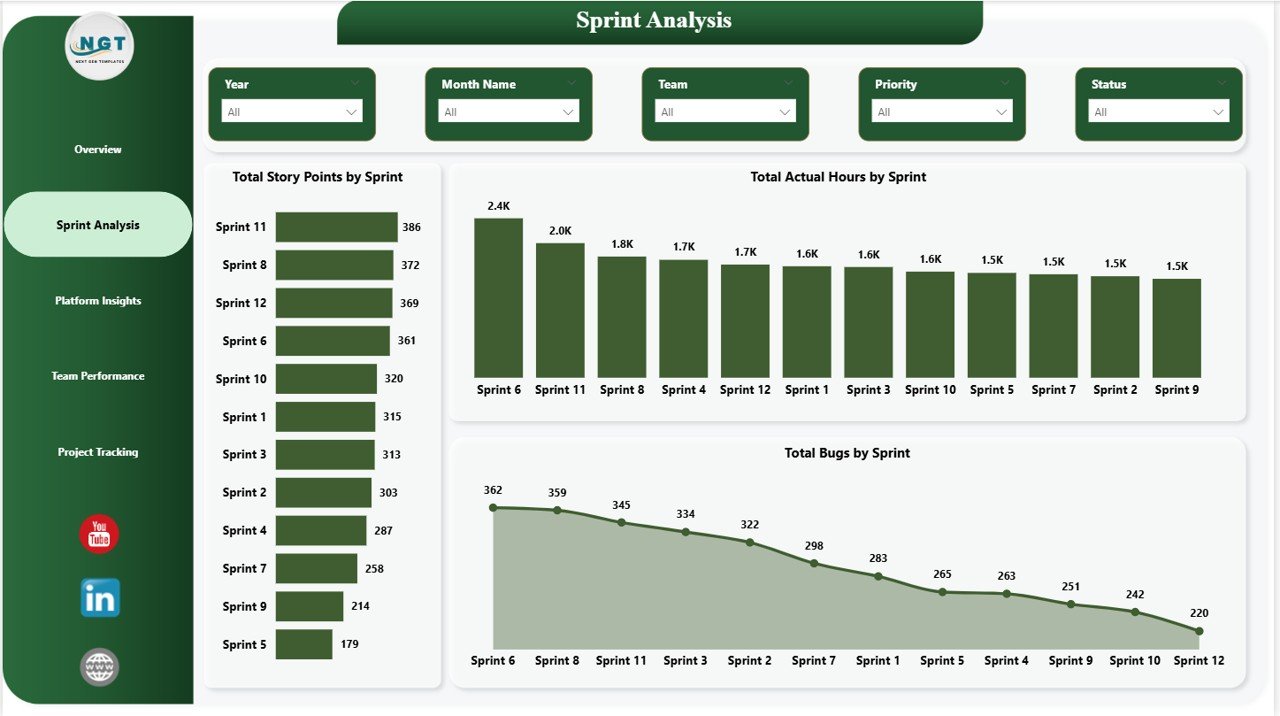
Page 2 — Sprint Analysis
The Sprint Analysis page is tailored for agile blockchain development teams. It dives deep into sprint-level performance, helping you understand how your team is progressing sprint over sprint and where delays or bottlenecks may be emerging.
- Total Story Points by Sprint — Tracks the total story points committed and completed across each sprint, giving you a clear velocity trend and helping forecast future sprint capacity.
- Total Actual Hours by Sprint — Compares planned versus actual hours worked per sprint, making it easy to spot overruns or underutilized sprints.
- Total Bugs by Sprint — Monitors how many bugs were reported in each sprint, helping QA and development teams identify quality trends and recurring issues across the development cycle.
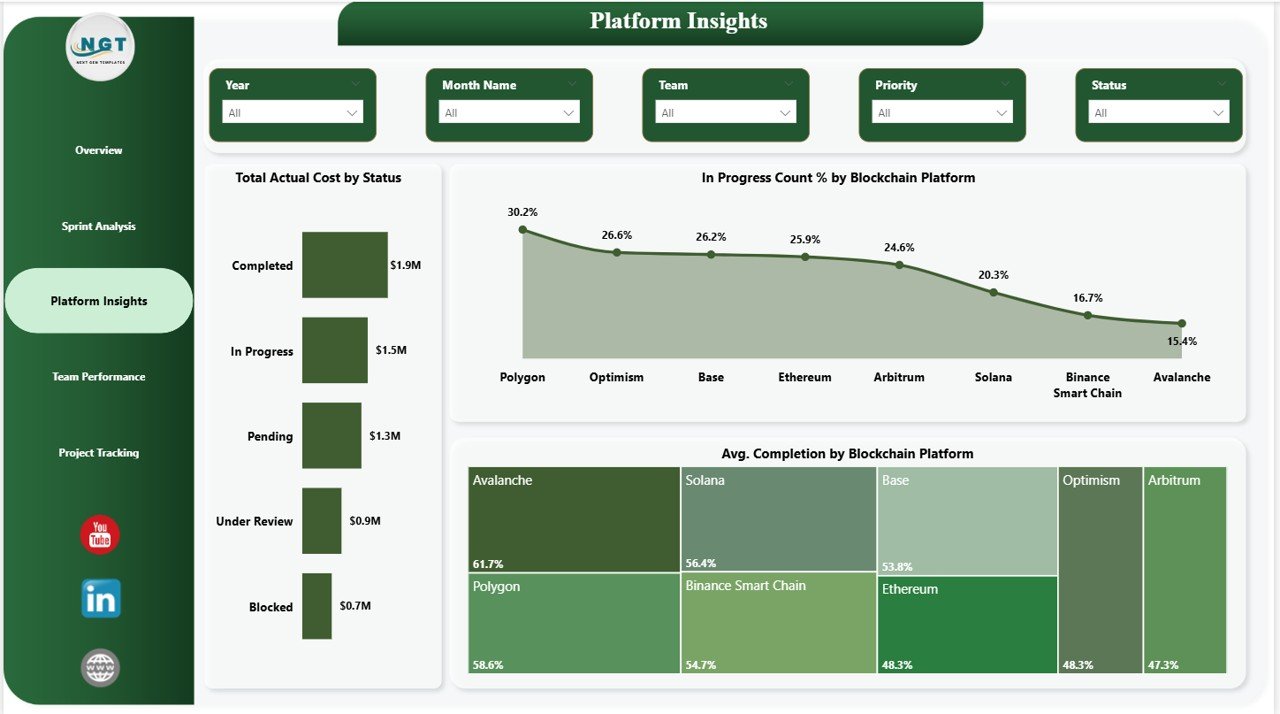
Page 3 — Platform Insights
The Platform Insights page lets you evaluate performance across different blockchain platforms — such as Ethereum, Hyperledger, Solana, or any custom platform in your data. This is especially useful for organizations running multi-platform blockchain initiatives.
- Total Actual Cost by Status — Breaks down cost by the status of tasks (e.g., Completed, In Progress, Pending), helping you see how much has been spent on work that’s done versus work still ongoing.
- In Progress Count % by Blockchain Platform — Shows what percentage of in-progress tasks belong to each platform, making it easy to identify which platform requires the most attention right now.
- Avg. Completion by Blockchain Platform — Compares the average project completion rate across blockchain platforms, highlighting which platforms are on track and which may need additional support.
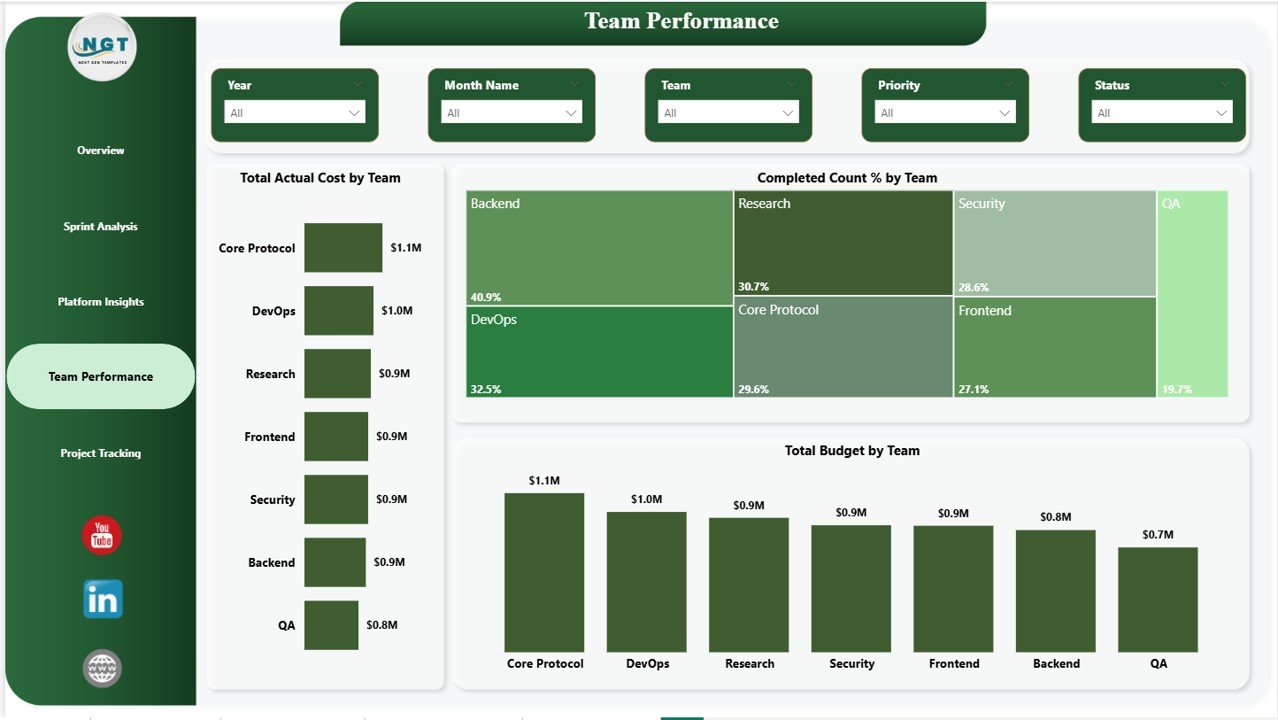
Page 4 — Team Performance
The Team Performance page puts your people at the center of the analysis. It helps managers understand how different teams are contributing to the project in terms of budget consumption, output, and delivery quality.
- Total Actual Cost by Team — Compares how much each team has spent in actual costs, making it easy to see which teams are within budget and which are running over.
- Completed Count % by Team — Shows the percentage of tasks completed by each team, giving a fair and measurable view of team productivity and delivery performance.
- Total Budget by Team — Displays the budget allocated to each team, making it simple to align resource distribution with project priorities.
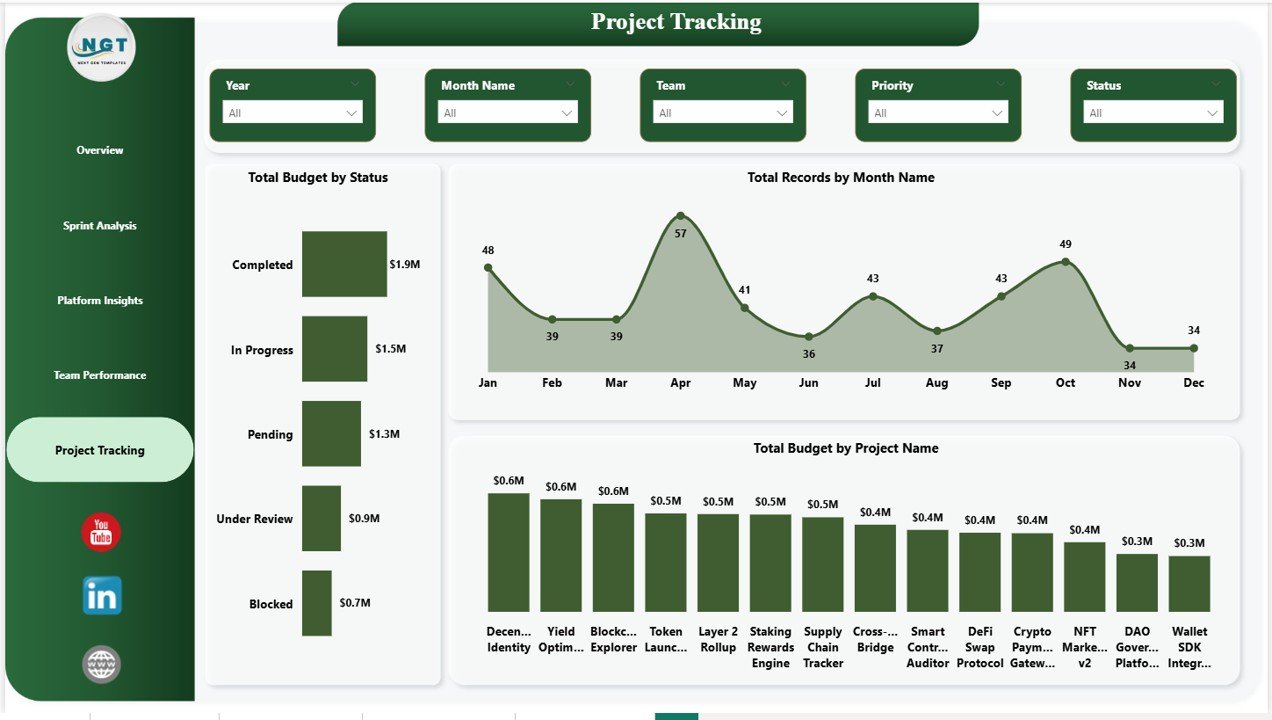
Page 5 — Project Tracking
The Project Tracking page gives you a comprehensive view of all blockchain projects in your portfolio — their budgets, statuses, monthly trends, and individual project performance. This is the page for portfolio-level decision-making.
- Total Budget by Status — Shows how your total budget is distributed across different project statuses (Completed, In Progress, On Hold, etc.), letting you immediately see where most of the money is tied up.
- Total Records by Month Name — Tracks the monthly volume of tasks or records, helping you identify peak development periods and plan resource allocation accordingly.
- Total Budget by Project Name — Compares the budget allocated to each blockchain project in your portfolio, making it easy to spot underfunded or overfunded projects.
Advantages of Blockchain Development Dashboard in Power BI
Using this Blockchain Development Dashboard in Power BI comes with several real-world advantages for your team and organization:
- Saves Hours of Manual Reporting — No more building reports from scratch. Just connect your data and the dashboard does the rest.
- Real-Time Decision Making — Interactive filters and charts let you make data-backed decisions on the spot, not days later.
- Better Budget Control — Seeing planned vs. actual costs across teams, platforms, and projects helps you stay on budget and prevent overspending.
- Improved Team Accountability — Team-level performance charts make it easy to identify high performers and those who may need support.
- Agile-Friendly — Sprint-level analytics align perfectly with agile development methodologies used by most blockchain teams today.
- Executive-Ready Reports — Clean visuals and professional layout make this dashboard perfect for management presentations and stakeholder reviews.
- Scalable — Whether you’re tracking 5 projects or 50, the dashboard scales seamlessly with your data.
Opportunities for Improvement
Even the best dashboards can evolve. Here are some ideas for taking this Blockchain Development Dashboard in Power BI to the next level:
- Add a Risk Tracking tab to monitor high-risk tasks, blockers, and dependencies across sprints.
- Integrate live data connections (e.g., Jira, Azure DevOps) to automate data refresh instead of manual imports.
- Include a Forecasting Page using Power BI’s built-in AI visuals to predict completion dates and budget overruns.
- Add drill-through reports for deeper project-level or developer-level analysis from summary pages.
- Incorporate custom alerts or Power BI service subscriptions to notify team leads when KPIs go below target.
Best Practices for Using This Dashboard
To get the most out of your Blockchain Development Dashboard in Power BI, keep these best practices in mind:
- Keep your data clean and consistent — Make sure naming conventions for teams, platforms, statuses, and phases are standardized before loading data.
- Update data regularly — Weekly or bi-weekly updates ensure the dashboard reflects the current state of your projects.
- Use slicers strategically — Train your team to use slicers to filter down to relevant views rather than building separate reports.
- Customize KPI targets — Add conditional formatting to cards and charts to highlight when actuals deviate from targets.
- Share via Power BI Service — Publish to Power BI Service for real-time access by all stakeholders from anywhere, on any device. Learn more from Microsoft’s official Power BI documentation.
- Review dashboard in sprint retrospectives — Use the Sprint Analysis page as a discussion tool during your agile ceremonies.
Explore Relevant Templates
If you found this dashboard useful, you may also want to check out these related templates available on our site:
- Blockchain Development Dashboard in Excel — Prefer working in Excel? This version covers the same KPIs and analytics built entirely in Excel with dynamic charts and slicers.
- Ceramic Manufacturing Dashboard in Power BI — A production-focused Power BI dashboard for manufacturing teams to monitor output, quality, and costs.
- Coding Bootcamps KPI Dashboard in Power BI — Track student progress, enrollment trends, and instructor performance for coding bootcamp programs.
Frequently Asked Questions (FAQs)
What is the Blockchain Development Dashboard in Power BI?
It is a multi-page Power BI dashboard template that helps blockchain development teams track budgets, sprint performance, platform insights, team productivity, and project timelines — all in one interactive report.
Do I need Power BI Desktop to use this dashboard?
Yes, you will need Microsoft Power BI Desktop (free to download) to open, customize, and connect your data to this dashboard template.
Can I customize this dashboard for my own blockchain project data?
Absolutely. The dashboard is fully editable. You can replace the sample data with your own dataset, adjust chart titles, modify DAX measures, and change color themes to match your brand or project requirements.
How many pages does this Power BI dashboard have?
This dashboard has 5 pages: Overview, Sprint Analysis, Platform Insights, Team Performance, and Project Tracking — each focused on a specific dimension of blockchain project management.
Is this dashboard suitable for agile blockchain teams?
Yes! The Sprint Analysis page is specifically designed for agile teams, tracking story points, hours, and bugs at the sprint level — perfectly aligned with Scrum and Kanban workflows.
What blockchain platforms does this dashboard support?
The dashboard supports any blockchain platform you include in your data — Ethereum, Hyperledger, Solana, Polygon, or custom enterprise platforms. It reads directly from your dataset and adapts accordingly.
Click Here to Purchase the Blockchain Development Dashboard in Power BI
Ready to bring clarity, control, and confidence to your blockchain development projects? Click here to purchase the Blockchain Development Dashboard in Power BI and start making smarter decisions with your project data today.
Conclusion
Managing a blockchain development project without the right analytics tools is like navigating without a map. The Blockchain Development Dashboard in Power BI gives you that map — detailed, interactive, and always up to date.
From high-level budget summaries to sprint-by-sprint velocity analysis, from platform performance comparisons to team-level accountability — this dashboard puts everything you need to manage your blockchain projects confidently in one place. Whether you’re a project manager, a CTO, or a developer lead, this tool is designed to make your work easier, faster, and more impactful.
Don’t let valuable project data sit unused in spreadsheets. Transform it into decisions. Grab your copy today and see the difference data-driven project management makes.
📺 Visit our YouTube channel to watch the demo: YouTube.com/@NextGenTemplates