Change Agents Office Dashboard in Power BI is a comprehensive, interactive analytics solution that empowers organizations to manage and monitor their change management initiatives with clarity, speed, and data-driven confidence. Whether you are a change management professional, an operations leader, or a C-suite executive, this dashboard gives you complete visibility into budgets, adoption rates, stakeholder engagement, initiative performance, and change agent effectiveness — all from one centralized Power BI report.
Click here to Purchase Change Agents Office Dashboard in Power BI
In most organizations, change management data is scattered across emails, spreadsheets, and disconnected reports. This creates blind spots, delays decision-making, and makes it nearly impossible to evaluate whether transformation initiatives are truly succeeding. The Change Agents Office Dashboard in Power BI eliminates this problem by bringing all your critical change metrics together into five interactive, sliceable dashboard pages that update instantly with a single data refresh.
If you are looking for a ready-to-use, professionally designed Power BI solution for tracking organizational transformation, this dashboard is exactly what you need.
Key Features of Change Agents Office Dashboard in Power BI
This dashboard is packed with powerful features that make change management tracking effortless and insightful:
- Dynamic KPI Cards — Monitor Total Budget, Total Actual Cost, Total Records, Total Stakeholders, and Total Training Sessions from one centralized overview page.
- 5 Interactive Dashboard Pages — Includes Overview, Department Analysis, Initiative Insights, Adoption Tracking, and Budget Analysis pages, each designed for a specific analytical purpose.
- Advanced Slicers and Filters — Filter data by department, initiative type, status, change agent, resistance level, priority, communication channel, and more for focused analysis.
- Real-Time Data Refresh — Connect your data source (Excel, SQL, CSV, or cloud) and refresh all visuals instantly with one click.
- Budget vs Actual Cost Comparison — Visual comparisons across departments and change agents help identify overspending and enable smarter resource allocation.
- Adoption and Resistance Tracking — Measure adoption scores, resistance levels, and communication effectiveness to understand if change is truly being embraced.
- Monthly Trend Analysis — Track budget utilization, adoption rates, and cost patterns over time for better forecasting and planning.
- Professional Design — Clean, modern visuals suitable for board presentations, executive reviews, and stakeholder reports.
- Fully Customizable — Modify KPIs, colors, chart types, and data connections to align with your organization’s specific change framework.
- Click here to Purchase Change Agents Office Dashboard in Power BI
Dashboard Pages Explained
The Change Agents Office Dashboard in Power BI includes five well-structured analytical pages. Each page is designed to provide focused insights into a different dimension of your change management operations.
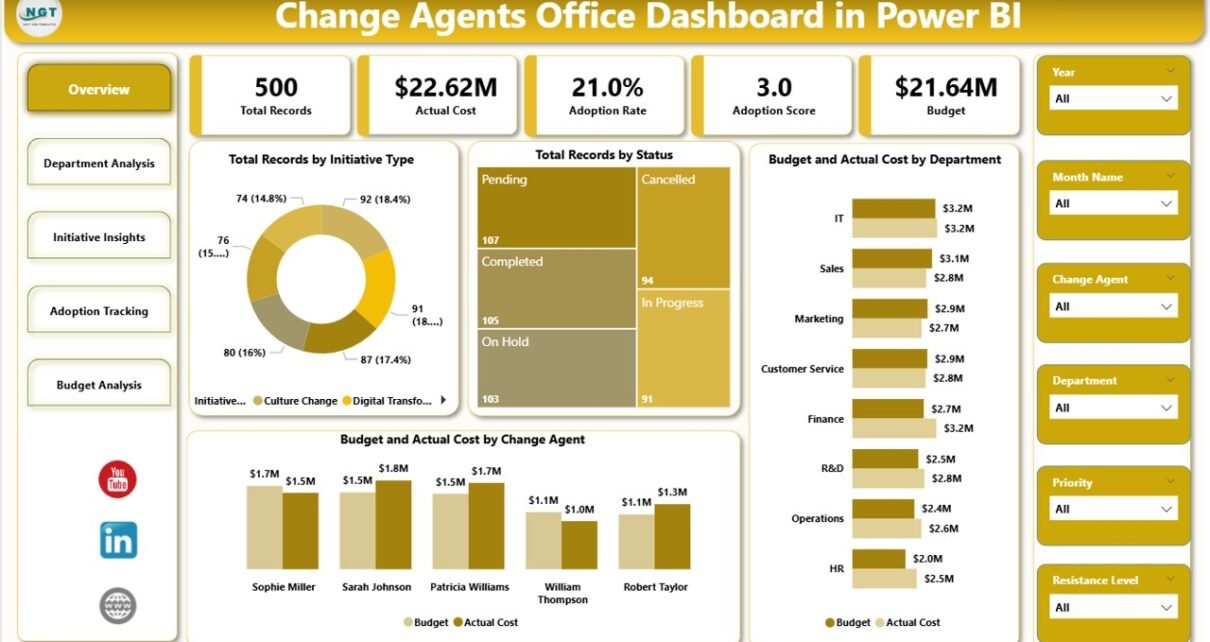
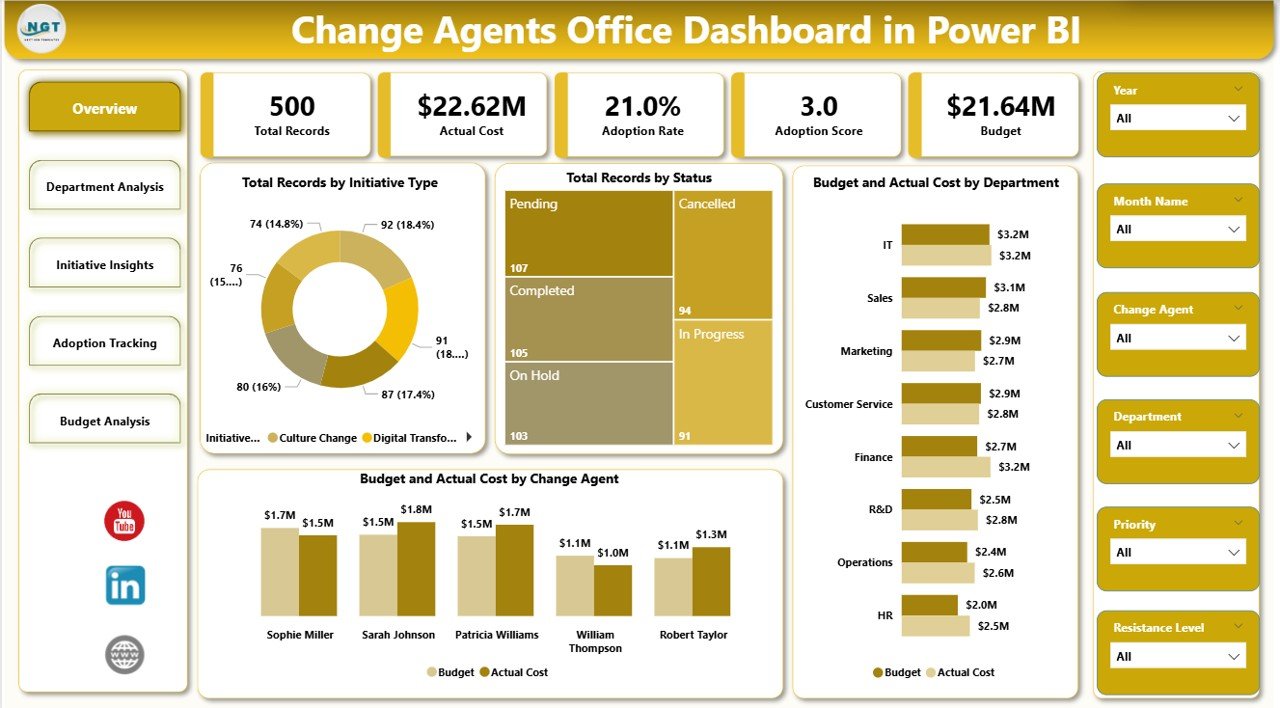
Page 1 — Overview Page
The Overview Page serves as your central command center for change management. At the top, KPI cards display Total Budget, Total Actual Cost, Total Records, Total Stakeholders, and Total Training Sessions. Below, interactive charts present:
- Total Budget vs Total Actual Cost by Department
- Total Records by Initiative Type
- Total Records by Status
- Total Budget vs Total Actual Cost by Change Agent
Interactive slicers allow you to instantly filter data by department, initiative type, status, and change agent. This page gives decision-makers a quick snapshot of overall change program health.
Overview Page
Page 2 — Department Analysis
This page lets you drill into department-level performance across all key change metrics. Charts on this page include:
- Total Stakeholders by Department
- Total Training Sessions by Department
- Avg. Adoption Score by Department
- Total Budget by Initiative Type
Leaders can use this page to quickly identify which departments are most engaged in the change process, which ones require additional training, and where budget resources are being directed. If you also work with Excel-based change reporting, explore the Change Agents Office Dashboard in Excel for a complementary solution.
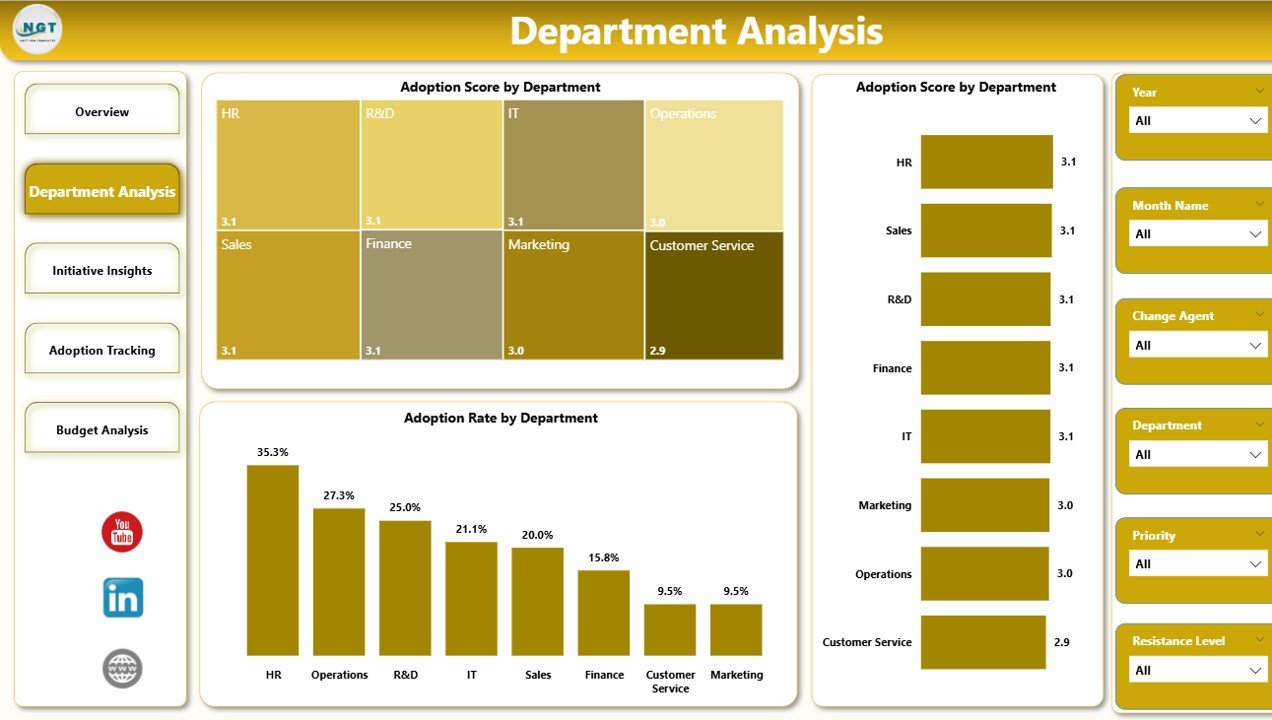
Department Analysis
Page 3 — Initiative Insights
The Initiative Insights page provides a comprehensive view of every change initiative’s health, priority, and adoption performance. Charts include:
- Total Records by Priority
- Avg. Adoption Score by Initiative Type
- Total Records by Stakeholder Group
- Adoption Rate % by Month
- Click here to Purchase Change Agents Office Dashboard in Power BI
Program managers can use this page to assess initiative momentum and track how adoption rates evolve over time. This is critical for identifying stalled initiatives before they become costly failures.
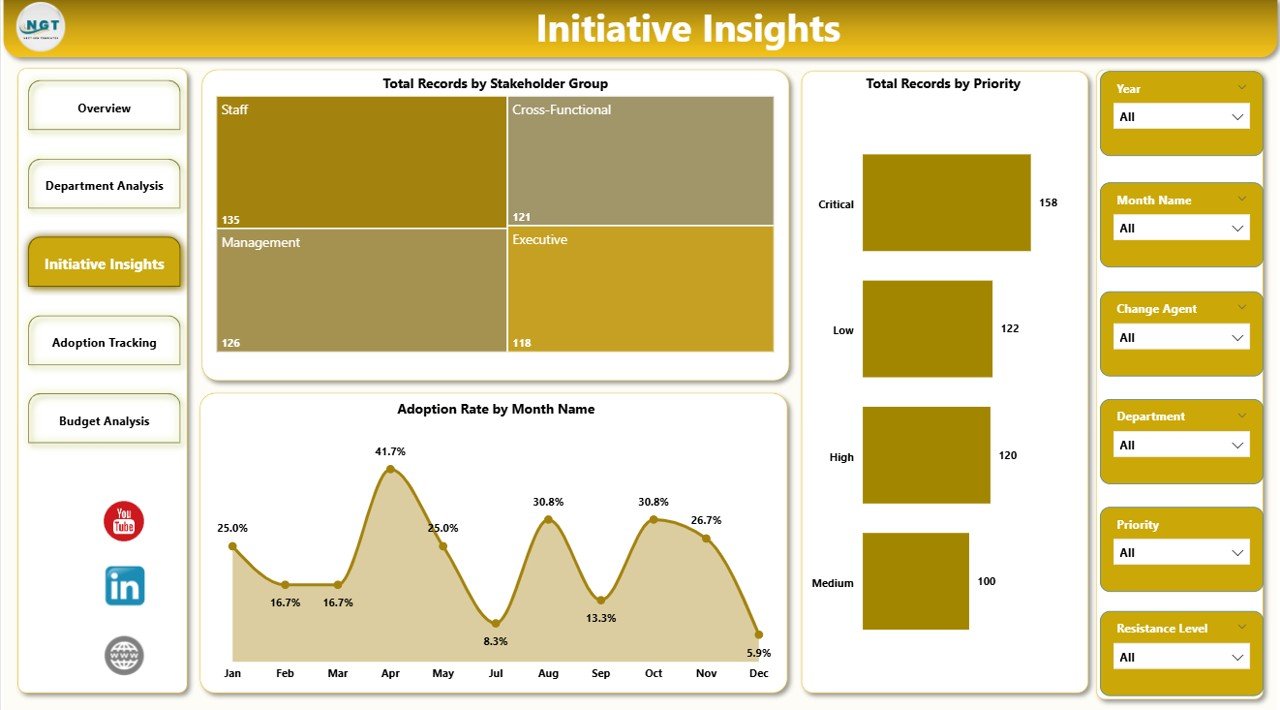
Initiative Insights
Page 4 — Adoption Tracking
This page measures the real impact of your change efforts on the ground. Charts include:
- Total Records by Resistance Level
- Total Records by Communication Channels
- Avg. Adoption Score by Impact Level
- Total Budget vs Total Actual Cost by Month
By analyzing resistance patterns, communication effectiveness, and cost trends over time, you can make data-backed adjustments to your change strategy. For organizations managing broader change management operations, this level of detail is invaluable.
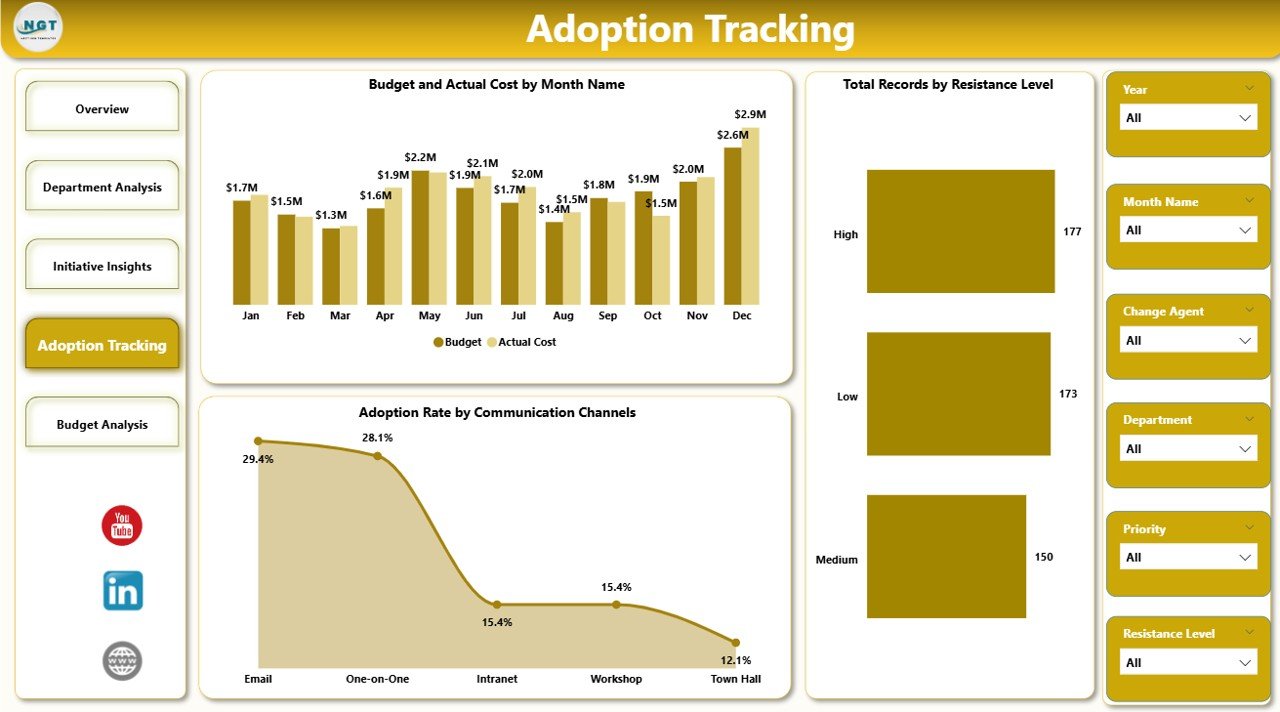
Adoption Tracking
Page 5 — Budget Analysis
The Budget Analysis page keeps financial oversight front and center. Charts include:
- Budget Utilization % by Department
- Budget Utilization % by Initiative Type
- Total Actual Cost by Change Agent
Finance teams and program directors can use this page to spot overspend, reallocate resources proactively, and ensure the entire change program stays within its approved budget envelope.
Click here to Purchase Change Agents Office Dashboard in Power BI
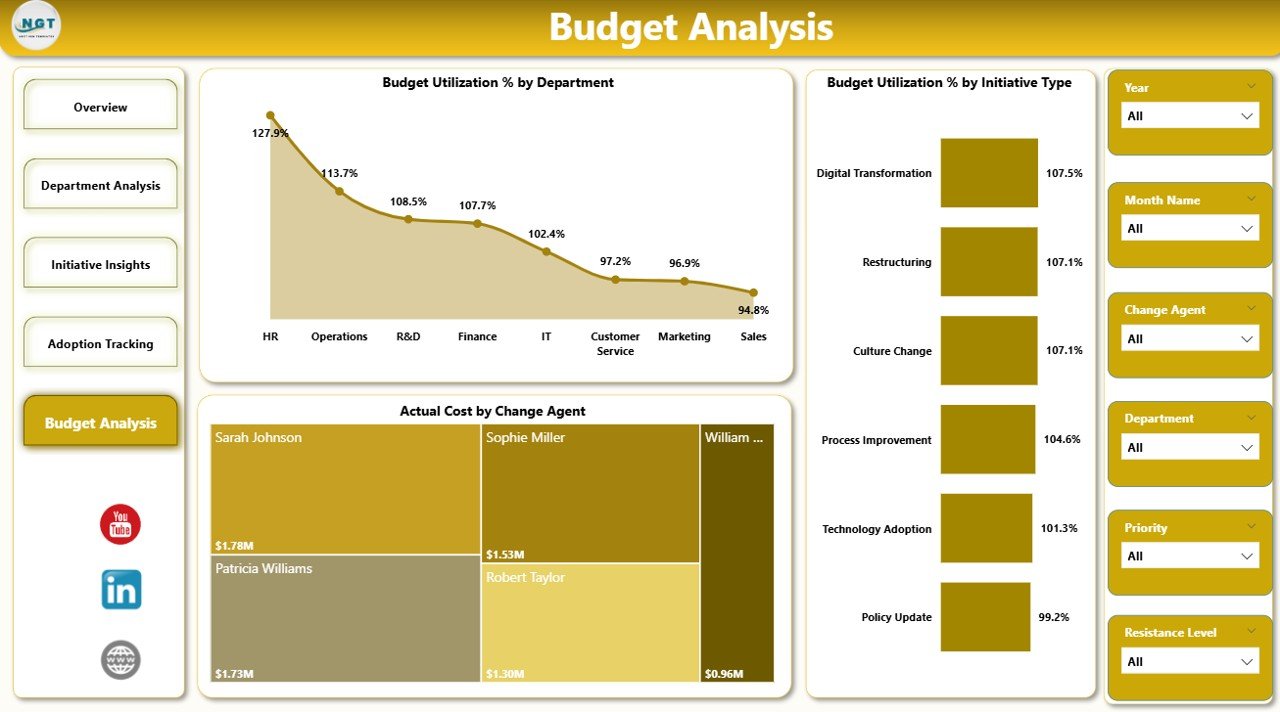
Budget Analysis
Advantages of Change Agents Office Dashboard in Power BI
- Centralized Visibility — All change management KPIs consolidated into one interactive report, eliminating data silos and scattered spreadsheets.
- Faster Decision-Making — Real-time insights through interactive slicers and filters enable leaders to act quickly on emerging trends and issues.
- Budget Accountability — Visual budget vs actual cost comparisons ensure financial discipline across the entire change program.
- Stakeholder Engagement Tracking — Monitor who is involved, where training gaps exist, and how effectively communication channels are being utilized.
- Scalable for Any Organization — Whether you manage 10 or 10,000 change records, the dashboard scales effortlessly with Power BI’s engine.
- No Advanced Technical Skills Required — Simply connect your data, refresh, and the dashboard is ready. Designed for business users, not just data analysts.
- Executive-Ready Presentations — Professional visual design makes it perfect for board meetings and leadership reviews without additional formatting.
Opportunities for Improvement
Click here to Purchase Change Agents Office Dashboard in Power BI
- Custom DAX Measures — Users with Power BI expertise can add custom DAX calculations for more advanced KPI computations.
- Row-Level Security — Implement department-level or role-based security to control who sees what data when publishing to Power BI Service.
- Automated Data Refresh — Schedule automated refreshes through Power BI Service or a gateway to keep the dashboard always current.
- Integration with Live Data Sources — Connect directly to SharePoint lists, SQL databases, or cloud APIs for real-time data streaming.
- Additional Pages — Add custom pages for risk analysis, timeline tracking, or executive summary views based on your organization’s needs.
Best Practices for Using the Change Agents Office Dashboard in Power BI
- Update Data Regularly — Refresh your data weekly or bi-weekly to ensure all KPIs and charts reflect the latest change program status.
- Use Slicers Strategically — Apply filters by department, initiative type, or change agent to focus on specific areas that need attention.
- Review Budget Pages Monthly — Regularly compare budget vs actual cost to catch overspend early and reallocate resources proactively.
- Monitor Adoption Trends — Watch adoption rate trends on a monthly basis to identify initiatives losing momentum before they stall completely.
- Share via Power BI Service — Publish your dashboard to Power BI Service so your entire team can access it from any device in real time.
- Customize KPIs — Adapt the dashboard’s metrics to match your organization’s specific change management framework for maximum relevance.
Explore Relevant Templates
If you found the Change Agents Office Dashboard in Power BI useful, explore these related templates from NextGenTemplates.com:
- Change Agents Office Dashboard in Excel — The Excel version with pivot tables and automatic refresh
- Change Management Dashboard in Power BI — Broader change management tracking across IT and operations
- Blockchain Development Dashboard in Power BI — Sprint, team, and budget analytics for tech projects
- Customer Service Dashboard in Power BI — Track tickets, satisfaction, and agent performance
Frequently Asked Questions
Q1: Do I need advanced Power BI skills to use this dashboard?
No. This dashboard is designed for business users. Simply connect your data, click Refresh, and start analyzing. No DAX or data modeling expertise is required.
Q2: Can I customize the KPIs and charts?
Yes. You can modify any visual, add new KPIs, change colors, and adjust data connections to match your organization’s specific change management framework.
Q3: What data format does this dashboard require?
The dashboard works best with structured tabular data containing fields like Department, Initiative Type, Status, Change Agent, Budget, Actual Cost, Adoption Score, Stakeholders, and Training Sessions. You can connect via Excel, CSV, SQL, or cloud data sources.
Q4: Can I publish this to Power BI Service for team access?
Yes. You can publish the .pbix file to Power BI Service for real-time collaboration, scheduled data refreshes, and access from any device.
Q5: Is there an Excel version of this dashboard?
Yes. We also offer the Change Agents Office Dashboard in Excel with pivot tables and automatic refresh functionality.
Q6: Is this a one-time purchase?
Yes. Pay once, download instantly, and use it forever. No subscriptions or recurring charges.
Conclusion
The Change Agents Office Dashboard in Power BI is the ultimate solution for organizations serious about managing transformation with precision and accountability. With five interactive pages covering overview KPIs, department analysis, initiative insights, adoption tracking, and budget analysis, this dashboard delivers everything you need to monitor, optimize, and communicate the progress of your change management programs.
Stop relying on disconnected spreadsheets and manual reports. Start making smarter, faster, data-driven decisions with this powerful Power BI template today.
Click here to Purchase Change Agents Office Dashboard in Power BI
Visit our YouTube channel for step-by-step video tutorials: Youtube.com/@PK-AnExcelExpert