Digital Marketing Campaign Dashboard in Excel is a comprehensive, interactive Excel analytics template designed to help marketing managers, digital marketing analysts, and campaign strategists track spend, revenue, impressions, clicks, conversions, leads, and ROI from one centralized workbook. This dashboard includes 5 dynamic analysis pages, a structured Data Sheet, and a Support Sheet with pivot tables that auto-refresh when you update your data.
Click here to Purchase Digital Marketing Campaign Dashboard in Excel
Whether you run social media campaigns, PPC advertising, email marketing, or multi-channel digital campaigns, this Excel dashboard template transforms raw marketing data into clear visual insights instantly. Instead of juggling multiple spreadsheets and scattered ad platform reports, you can now monitor your entire digital marketing operation from one centralized dashboard in Microsoft Excel.
Key Features of Digital Marketing Campaign Dashboard in Excel
The Digital Marketing Campaign Dashboard in Excel includes 5 interactive dashboard pages and tracks 5 key metrics: Total Spend, Total Revenue, Total Impressions, Total Clicks, and Total Conversions. Here are the features that make this template a must-have for marketing professionals:
- 5 Interactive Dashboard Pages — Overview, Platform Analysis, Campaign Performance, Lead Analysis, and ROI Analysis provide complete visibility into your marketing operations.
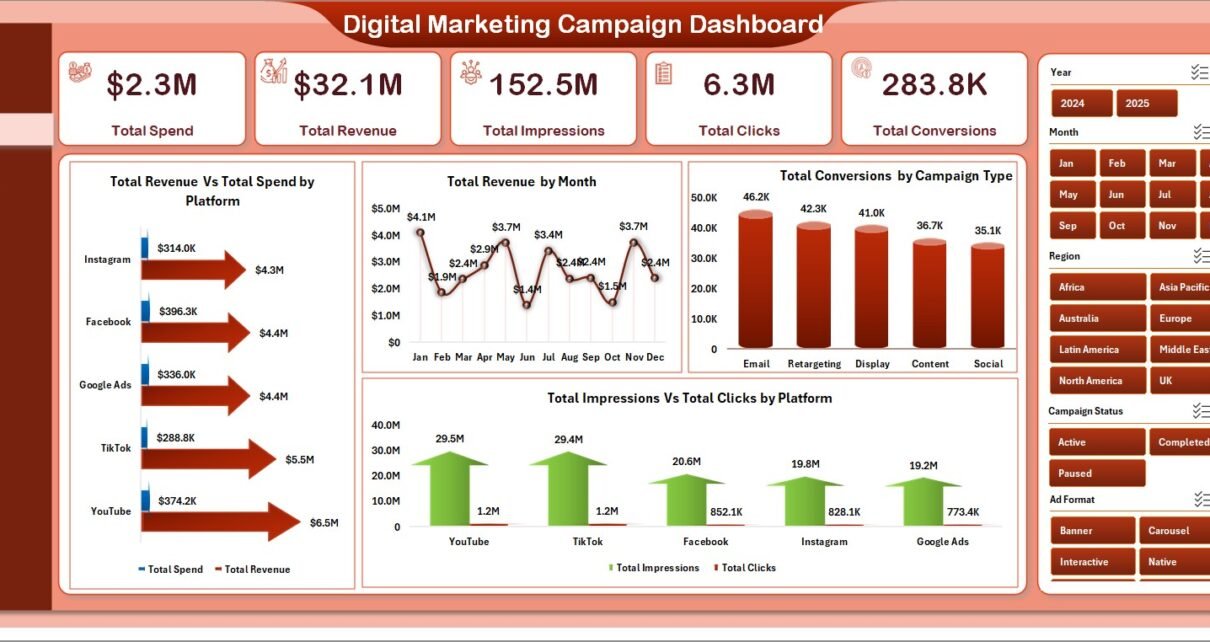
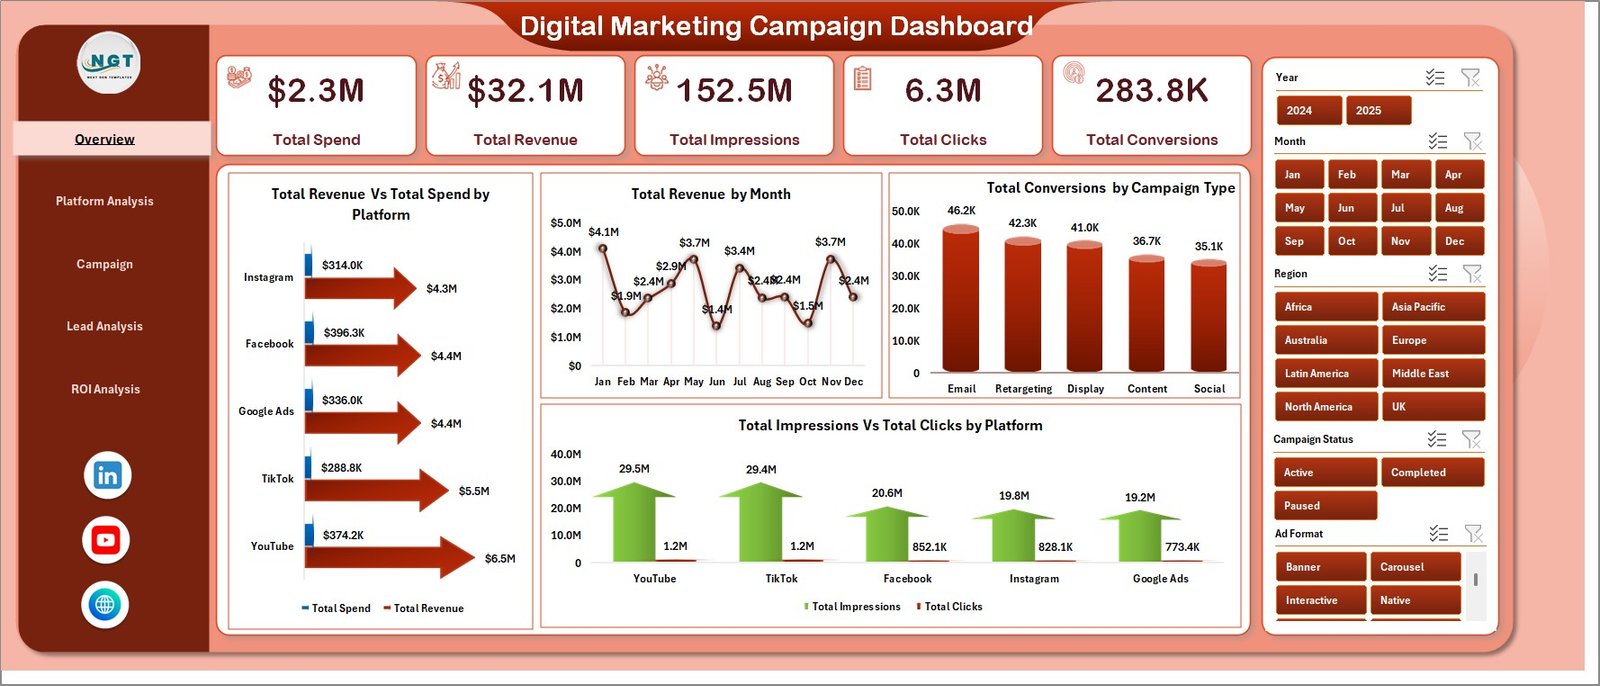
- Dynamic KPI Cards — Instantly view Total Spend, Total Revenue, Total Impressions, Total Clicks, and Total Conversions on the Overview page for a quick executive summary.
- Multiple Slicers — Apply filters across the dashboard to drill down into specific platforms, campaign types, ad formats, regions, and target audiences instantly.
- Revenue vs Spend Tracking — Compare financial performance across advertising channels and monitor monthly revenue trends with visual charts.
- Platform-Level Analytics — Analyze Total Revenue by Ad Format, Click-Through Rate % by Platform, and Spend vs Revenue by Region.
- Lead Funnel Analysis — Track Leads vs Conversions by Campaign Type, Return on Ad Spend by Platform, and regional conversion rates.
- ROI and Profitability Module — Monitor Total Revenue Vs Net Profit by Campaign Status, Net Profit by Manager, and Revenue Vs Spend by Year.
- Pivot-Powered Auto-Refresh — All charts connect to pivot tables. Update data and click Refresh All for instant updates across all 5 pages.
- No VBA or Macros Required — 100% formula and pivot-table based. Works in Excel 2016 and later.
Dashboard Pages Explained
1 — Overview Page
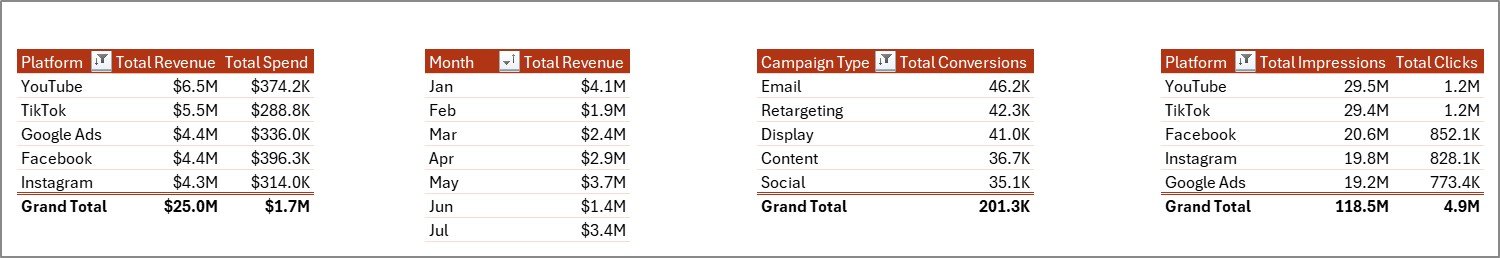
The Overview page displays 5 KPI cards (Total Spend, Total Revenue, Total Impressions, Total Clicks, Total Conversions) alongside visual charts showing Total Revenue Vs Total Spend by Platform comparing financial performance across advertising channels, Total Revenue by Month tracking monthly revenue trends, Total Conversions by Campaign Type showing which campaign strategies drive the most conversions, and Total Impressions Vs Total Clicks by Platform measuring engagement rates across channels. Multiple slicers allow instant filtering.
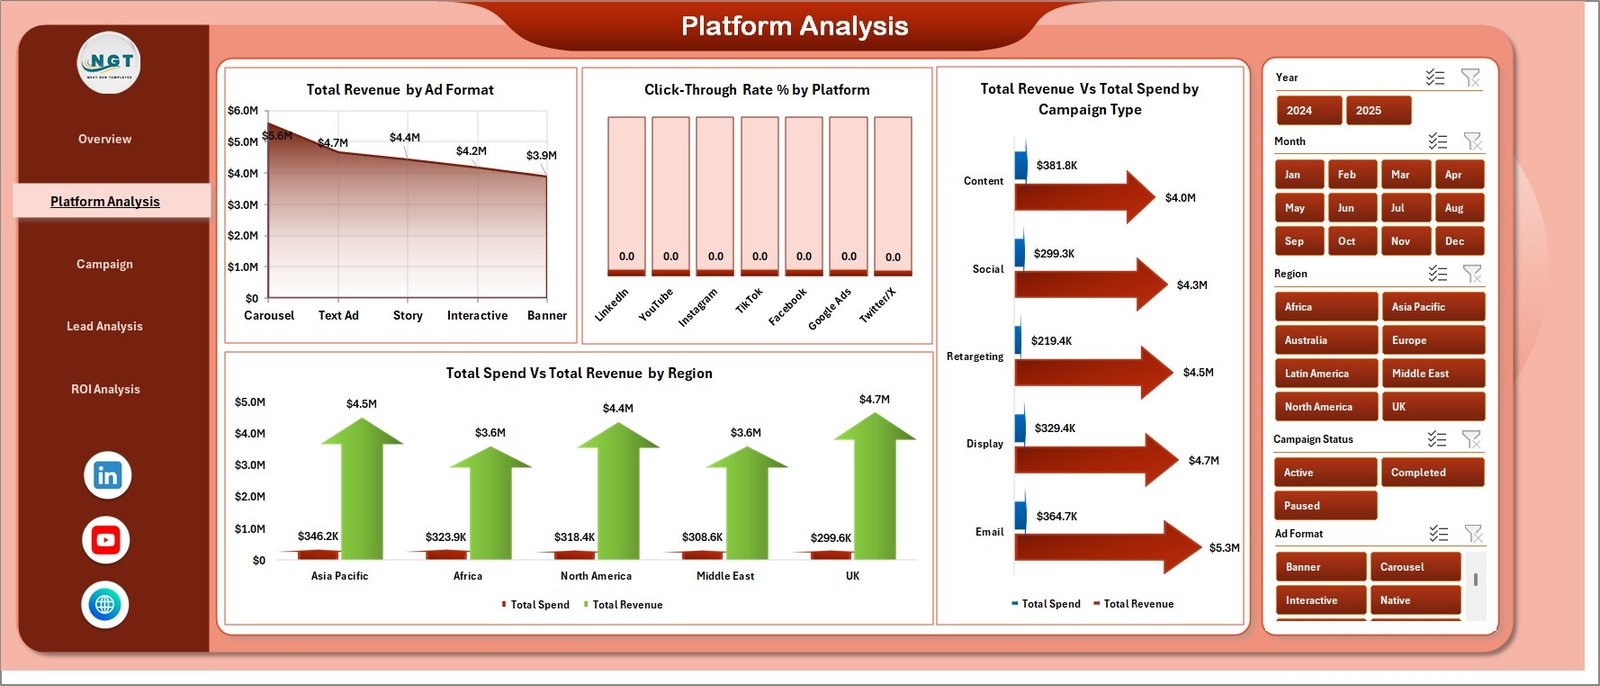
Digital Marketing Campaign Dashboard in Excel2 — Platform Analysis
This page provides deep-dive analysis featuring Total Revenue by Ad Format to identify top-performing ad formats, Click-Through Rate % by Platform comparing engagement effectiveness across channels, Total Revenue Vs Total Spend by Campaign Type analyzing cost-efficiency per campaign strategy, and Total Spend Vs Total Revenue by Region tracking geographic profitability across different markets.
 Platform Analysis
3 — Campaign Performance
The Campaign Performance page features team and campaign analytics showing Total Revenue by Manager to identify top-performing campaign managers, Total Conversions by Target Audience revealing which audiences convert best, Total Leads by Platform showing lead generation efficiency across channels, and Total Spend Vs Total Revenue by Month tracking monthly spending efficiency.
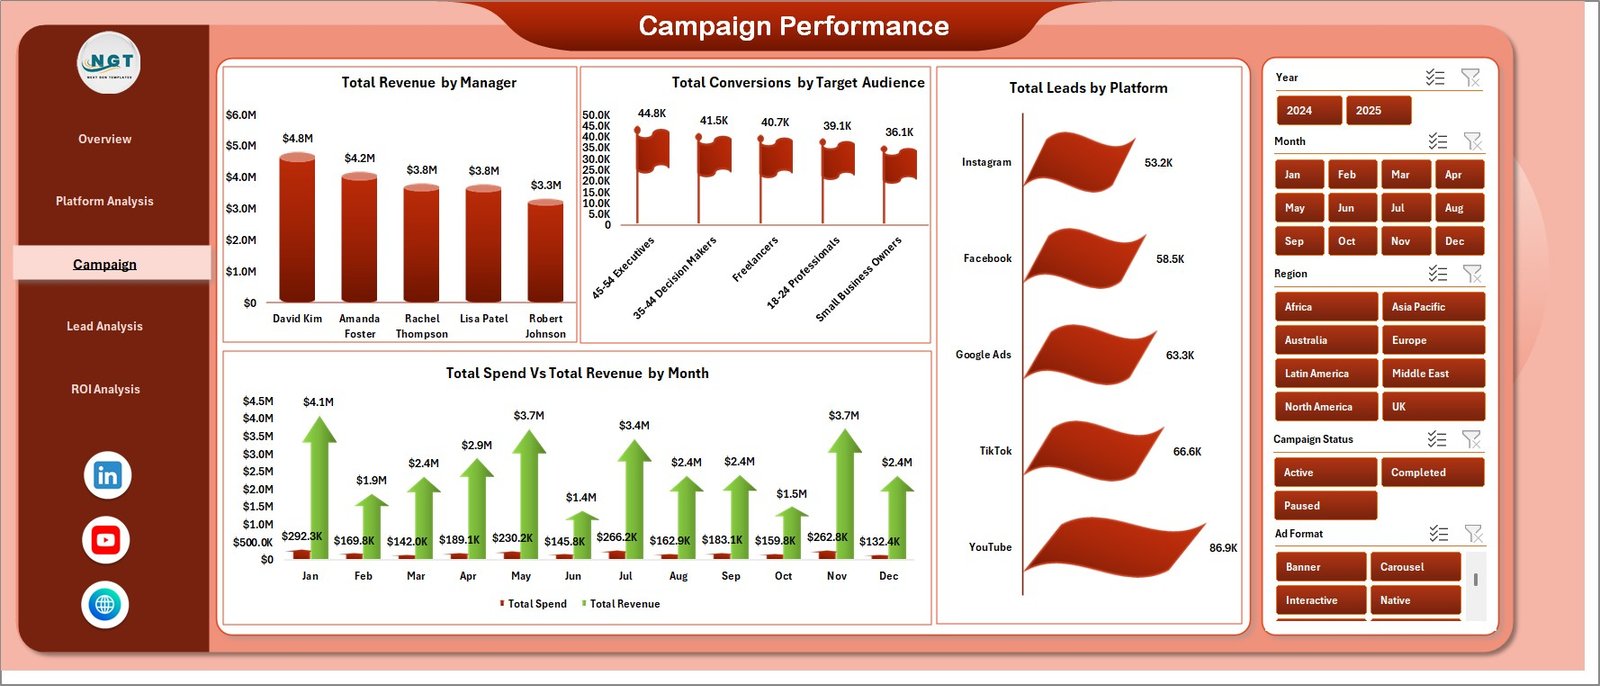 Campaign Performance
4 — Lead Analysis
Conversion funnel analytics showing Total Leads Vs Total Conversions by Campaign Type measuring funnel efficiency, Total Leads by Target Audience identifying highest-converting demographics, Return on Ad Spend by Platform calculating ROAS per channel, and Total Conversions Vs Total Leads by Region comparing regional conversion rates for geographic optimization.
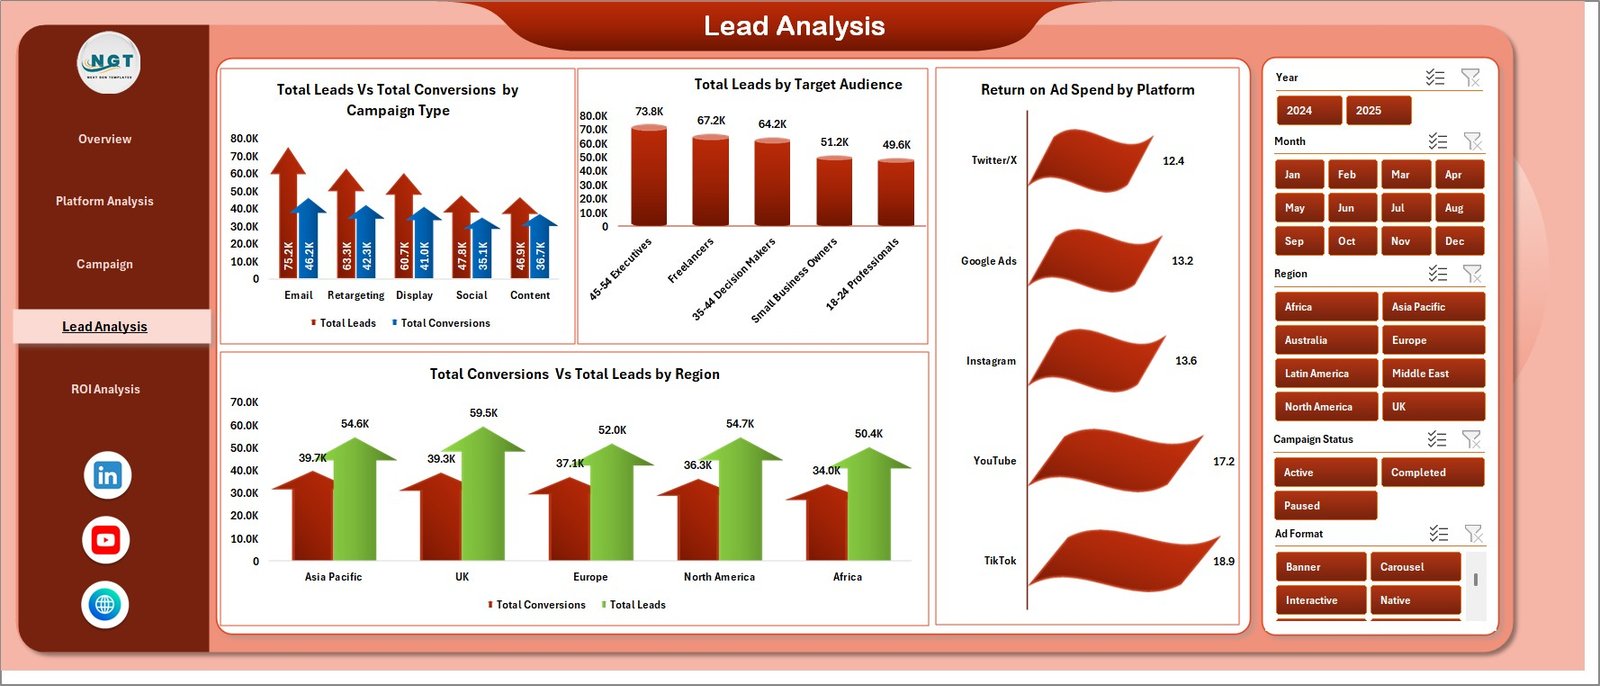 Lead Analysis
5 — ROI Analysis
Profitability tracking featuring Total Revenue Vs Net Profit by Campaign Status comparing completed and active campaign profitability, Net Profit by Manager evaluating individual contribution to the bottom line, and Total Revenue Vs Total Spend by Year tracking year-over-year financial performance for strategic budget allocation.
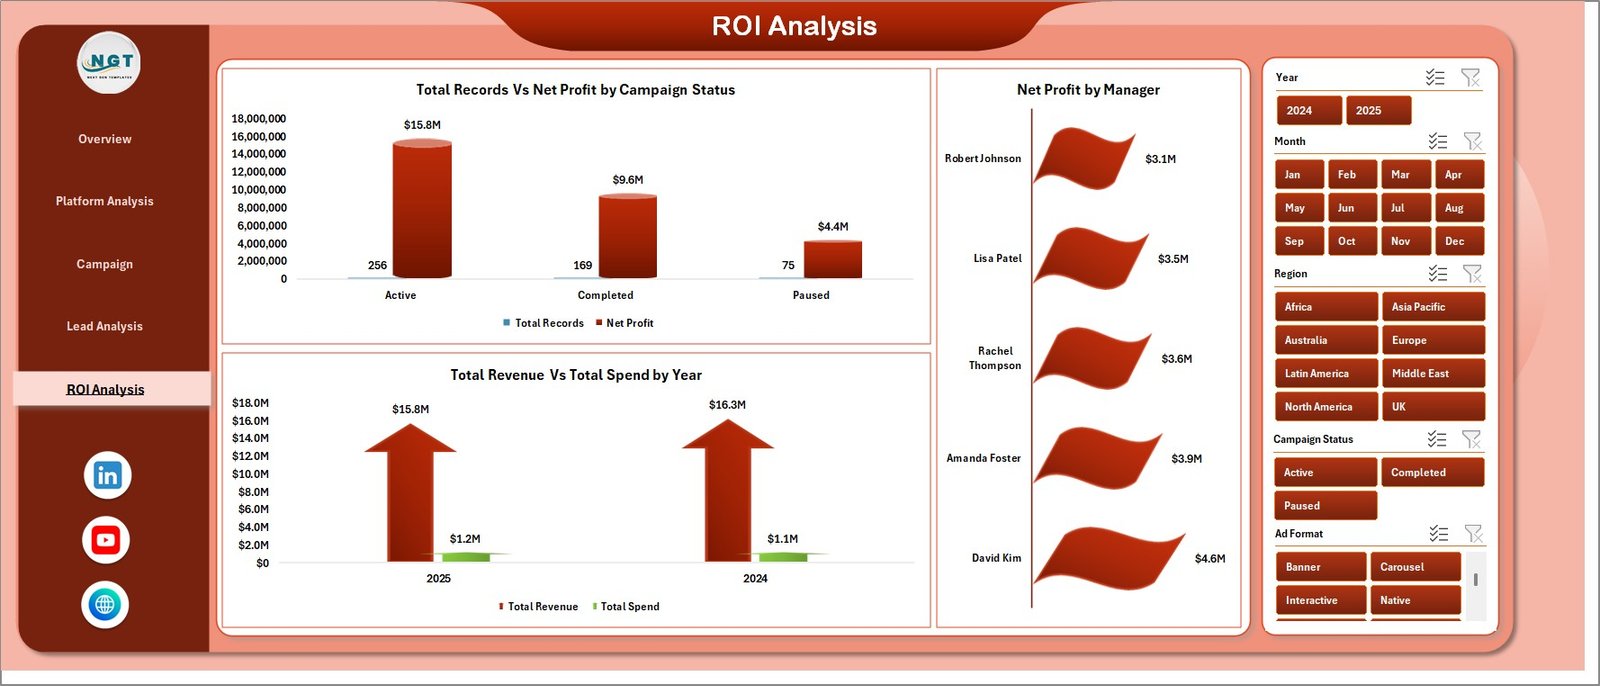 ROI Analysis
6 — Data Sheet
This is the Data Sheet where you add your campaign data in the same format. Replace the sample data with your own records and the entire dashboard auto-updates upon refresh.
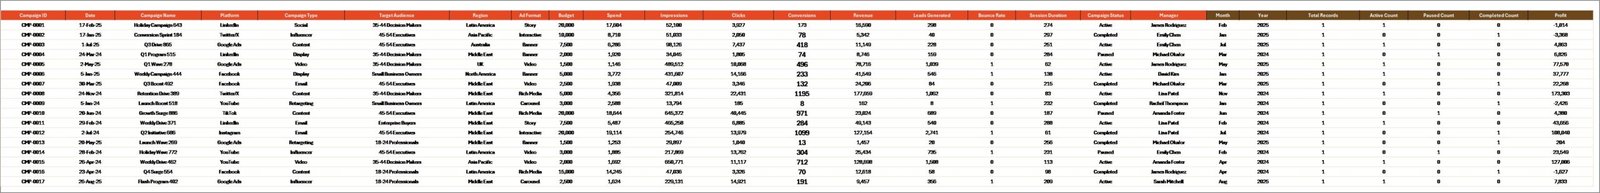 Data Sheet tab
7 — Support Sheet
Contains all pivot tables that power the dashboard charts. After updating data, go to the Data tab in the Excel Ribbon and click Refresh All. All pivots and charts update instantly. You can keep this sheet hidden during regular use.
 Support sheet tab
Advantages of Digital Marketing Campaign Dashboard in Excel
- Centralized Marketing Intelligence — Consolidate data from all your advertising platforms into one Excel workbook instead of switching between multiple tools and reports.
- Instant Executive Reporting — The KPI cards and visual charts enable you to present campaign performance to stakeholders within minutes, not hours.
- ROAS Optimization — Dedicated Return on Ad Spend analysis helps you identify which platforms and campaign types deliver the best return on your advertising investment.
- Team Performance Visibility — Track revenue and conversions by campaign manager to evaluate team effectiveness and allocate resources strategically.
- Zero Learning Curve — No VBA, macros, or coding required. Anyone familiar with basic Excel navigation can use this dashboard immediately.
- Cost-Effective Analytics — Get enterprise-grade marketing analytics without expensive BI tools or monthly subscription fees.
Opportunities for Improvement
Click here to Purchase Digital Marketing Campaign Dashboard in Excel
- Integration with live data feeds from advertising platforms (Google Ads, Meta Ads) would enable real-time dashboard updates.
- Adding a budget forecasting module could help marketing teams plan future campaign budgets based on historical performance trends.
- A/B testing analysis page could help compare creative performance across different ad variations.
- Adding automated email alerts for KPI thresholds (e.g., when ROAS drops below target) would enhance proactive campaign management.
Best Practices
- Update Data Regularly — For the most accurate insights, update your Data Sheet weekly or bi-weekly with the latest campaign metrics from all platforms.
- Use Slicers Strategically — Apply slicer filters to compare specific platforms, campaign types, or time periods for targeted optimization decisions.
- Monitor ROAS Trends — Use the Lead Analysis page to track Return on Ad Spend by Platform regularly and shift budget toward high-ROAS channels.
- Review Manager Performance Monthly — The Campaign Performance and ROI Analysis pages provide manager-level metrics that support data-driven team reviews.
- Keep the Support Sheet Hidden — Right-click the Support Sheet tab and select Hide during regular use to keep the workbook clean and professional for presentations.
- Learn from Microsoft Excel documentation — Refer to official resources for advanced pivot table techniques to customize the dashboard further.
Explore Relevant Templates
Click here to Purchase Digital Marketing Campaign Dashboard in Excel
- Brand Consulting Dashboard in Excel — Track brand consulting project fees, profitability, and consultant performance with pivot-powered charts and slicers.
- Brand Consulting Dashboard in Power BI — Advanced Power BI analytics for brand consulting with 5 interactive pages and instant refresh.
- Freelancer Business Dashboard in Excel — Track freelance revenue, client profitability, and project insights across 5 interactive pages.
- Excel Dashboard Templates — Browse the full collection of Excel dashboards for various industries and departments.
FAQs
What is the best Excel template for tracking digital marketing campaigns?
The Digital Marketing Campaign Dashboard in Excel from NextGen Templates is one of the best Excel templates for tracking digital marketing campaigns. It includes 5 interactive pages covering overview metrics, platform analysis, campaign performance, lead analysis, and ROI tracking with 5 KPI cards and multiple slicer filters.
Click here to Purchase Digital Marketing Campaign Dashboard in Excel
What KPIs does this digital marketing dashboard track?
This dashboard tracks 5 key metrics on the Overview page: Total Spend, Total Revenue, Total Impressions, Total Clicks, and Total Conversions. Additional analysis across 5 pages covers Click-Through Rate %, Return on Ad Spend, Net Profit by Manager, and Revenue Vs Spend comparisons by platform, campaign type, region, and month.
Do I need advanced Excel skills to use the Digital Marketing Campaign Dashboard?
No. Simply replace the sample data in the Data Sheet with your own campaign records and click Refresh All in the Data tab. All charts and KPIs update automatically through pivot tables. No VBA or macros are required.
Can I track multiple advertising platforms in this dashboard?
Yes. The dashboard supports multi-platform tracking with dedicated Platform Analysis views showing Revenue by Ad Format, CTR% by Platform, and Revenue Vs Spend by Region across all your advertising channels.
Does this template calculate Return on Ad Spend (ROAS)?
Yes. The Lead Analysis page includes a dedicated Return on Ad Spend by Platform chart that calculates and visualizes ROAS across all advertising platforms, helping you identify the most cost-effective channels for your campaigns.
How do I refresh the dashboard after updating my data?
Navigate to the Data tab in the Excel Ribbon and click Refresh All. All pivot tables in the Support Sheet will recalculate, and every chart across all 5 dashboard pages will update automatically with your new data.
Click here to Purchase Digital Marketing Campaign Dashboard in Excel
Conclusion
The Digital Marketing Campaign Dashboard in Excel is the ultimate analytics tool for marketing professionals who want to track campaign performance, optimize ad spend, and maximize ROI from a single Excel workbook. With 5 interactive pages, 5 KPI cards, slicer-based filtering, and pivot-powered auto-refresh, this template delivers enterprise-grade marketing analytics without the complexity of expensive BI tools.
Click here to Purchase Digital Marketing Campaign Dashboard in Excel
Visit our YouTube channel for step-by-step video tutorials: Youtube.com/@PK-AnExcelExpert