Salon and Spa Dashboard in Excel
Salon and Spa Dashboard in Excel is a ready-to-use analytics template designed for salon owners, spa managers, and beauty professionals who want to track revenue, monitor therapist performance, analyze client behavior, and spot service trends — all within a single Excel workbook. This professionally built dashboard includes 5 interactive analysis pages, a structured data sheet for easy data entry, and a hidden support sheet powered by pivot tables that keep every chart and KPI card fully dynamic.
Whether you manage a boutique day spa, a multi-location hair salon, or a full-service wellness center, this Excel Dashboard Template provides the visual insights you need to make smarter business decisions. Simply replace the sample data with your own records, click Refresh All, and watch the entire dashboard update in seconds.
Click here to Purchase the Salon and Spa Dashboard in Excel
Key Features of Salon and Spa Dashboard in Excel
The Salon and Spa Dashboard in Excel is packed with features that make it one of the most comprehensive salon analytics solutions available. It includes 5 dedicated dashboard pages that cover every angle of your beauty business — from high-level KPIs and service breakdowns to staff rankings, client demographics, and financial trends. The template tracks 5 core KPIs on the overview page including Total Records, Total Revenue, Total Completed, Total Tips, and Avg. Satisfaction, giving you an instant snapshot of your salon’s performance.
Interactive slicers on the overview page let you filter the entire dashboard by any dimension — location, service category, client type, or time period — making it easy to drill down into specific areas of your business. Every chart across all 5 pages is powered by pivot tables in the support sheet, so all visualizations refresh automatically when you update your data. No VBA, no macros, no advanced Excel skills required.
If you are looking for similar dashboards on other platforms, you might also explore the Beauty Salons Dashboard in Power BI or the Beauty Salons Dashboard in Excel for more specialized beauty salon analytics.
Dashboard Pages Explained
1. Overview Page
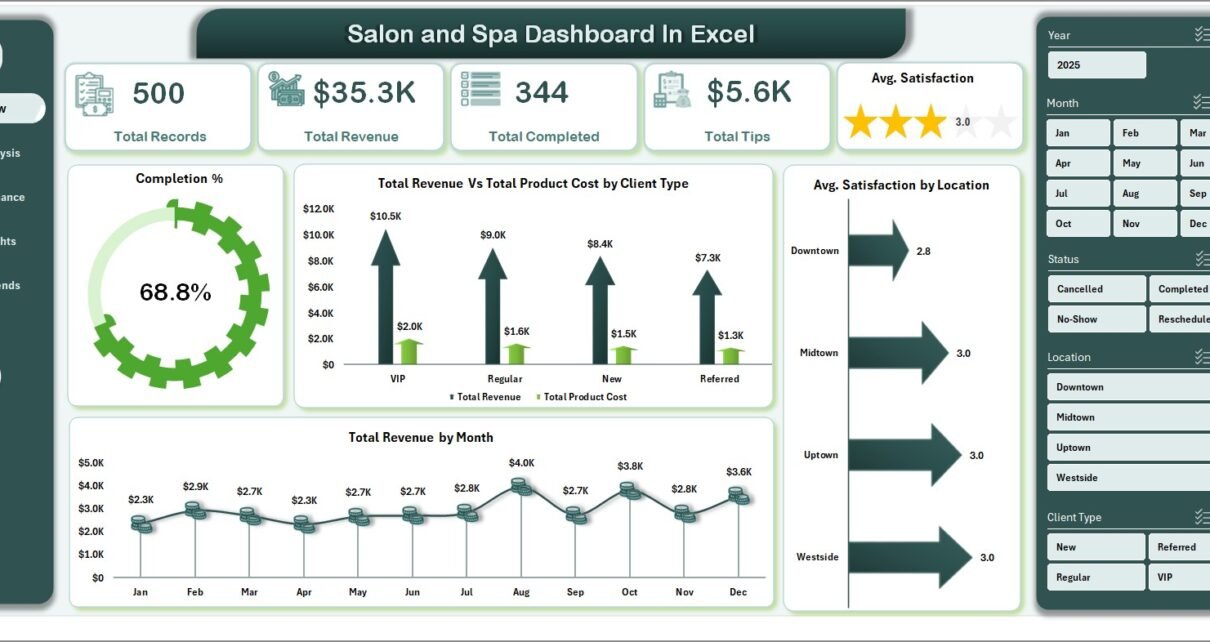
The Overview page serves as the command center for your salon and spa business. At the top, you will find 5 high-level KPI cards showing Total Records, Total Revenue, Total Completed appointments, Total Tips collected, and Avg. Satisfaction score. These cards give you an immediate pulse check on your business health without needing to navigate further.
Below the KPI cards, the page features several charts that provide deeper insight. The Completion % by Status chart shows how your appointments break down between completed, cancelled, and no-show categories. The Total Revenue Vs Total Product Cost by Client Type chart helps you understand which customer segments are most profitable. The Total Revenue by Month chart highlights seasonal trends and growth patterns. Finally, the Avg. Satisfaction by Location chart lets multi-branch operators compare client happiness across different salon locations.
Interactive slicers on this page allow you to filter all charts simultaneously, making it easy to analyze specific time periods, locations, or service types.
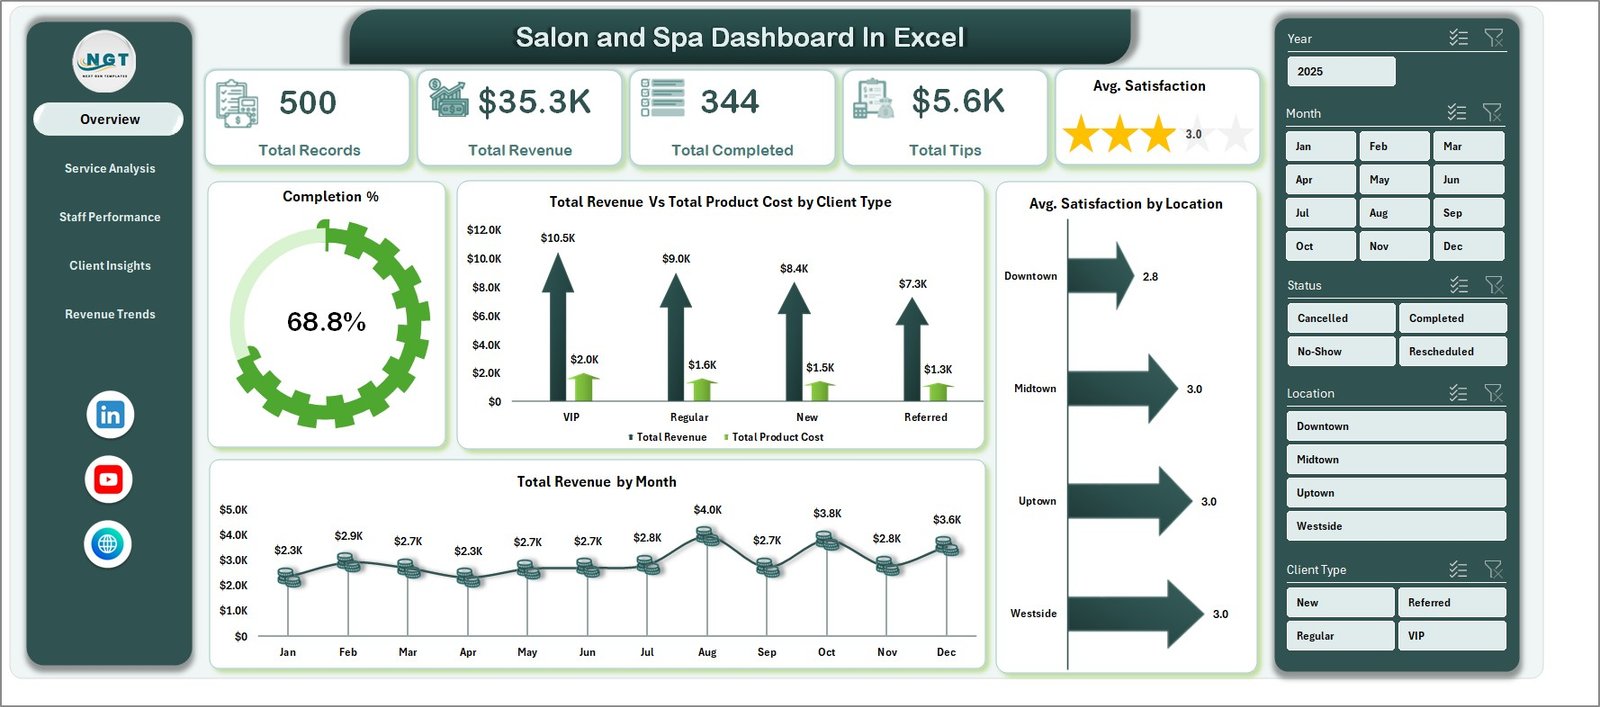
Salon and Spa Dashboard in Excel – Overview Page
2. Service Analysis
The Service Analysis page dives deep into your salon’s treatment offerings. This page helps you understand which services drive the most revenue and which ones deliver the highest client satisfaction.
The Total Revenue by Client Type chart segments your income by customer categories such as new clients, returning clients, and VIP members. The Total Records by Service Category chart shows you the volume of appointments across different treatment types — haircuts, facials, massages, manicures, and more. The Total Revenue Vs Total Product Cost by Service Category chart is particularly valuable as it reveals your profit margins for each service category. The Avg. Satisfaction by Service Category chart highlights which treatments your clients love most, helping you make informed decisions about expanding or discontinuing services.
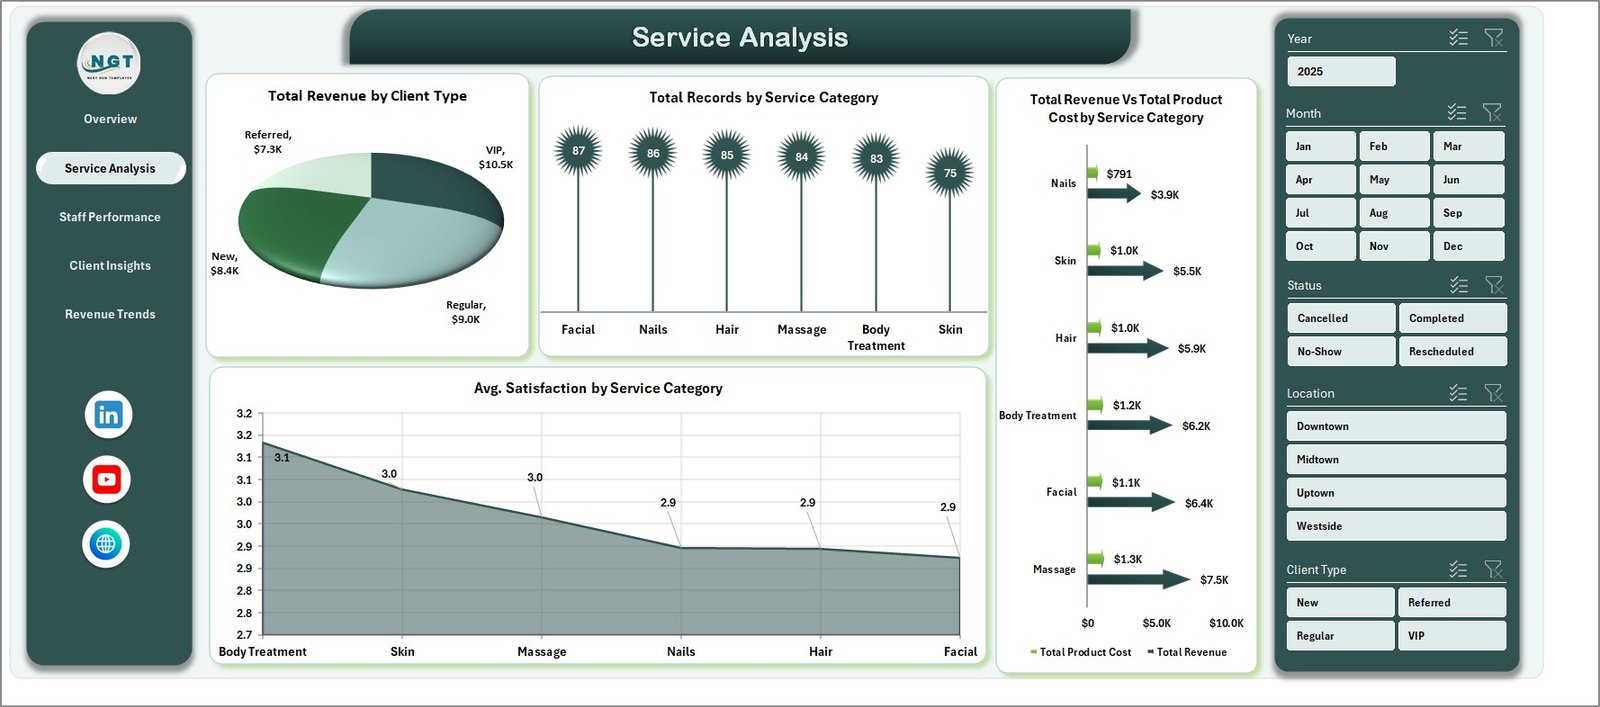
Service Analysis Page
3. Staff Performance
The Staff Performance page is designed to help salon managers evaluate and reward their team members based on real performance data. This page focuses on the top five therapists across multiple metrics.
The Total Revenue by Top Five Therapist chart ranks your highest-earning staff members. The Total Records by Top Five Therapist chart shows who handles the most appointments. The Total Tips by Top Five Therapist chart reveals which staff members deliver the kind of experience that earns client tips. The Avg. Satisfaction by Top Five Therapist chart measures quality of service from the client’s perspective. Together, these four charts give you a 360-degree view of your team’s contribution to the business.
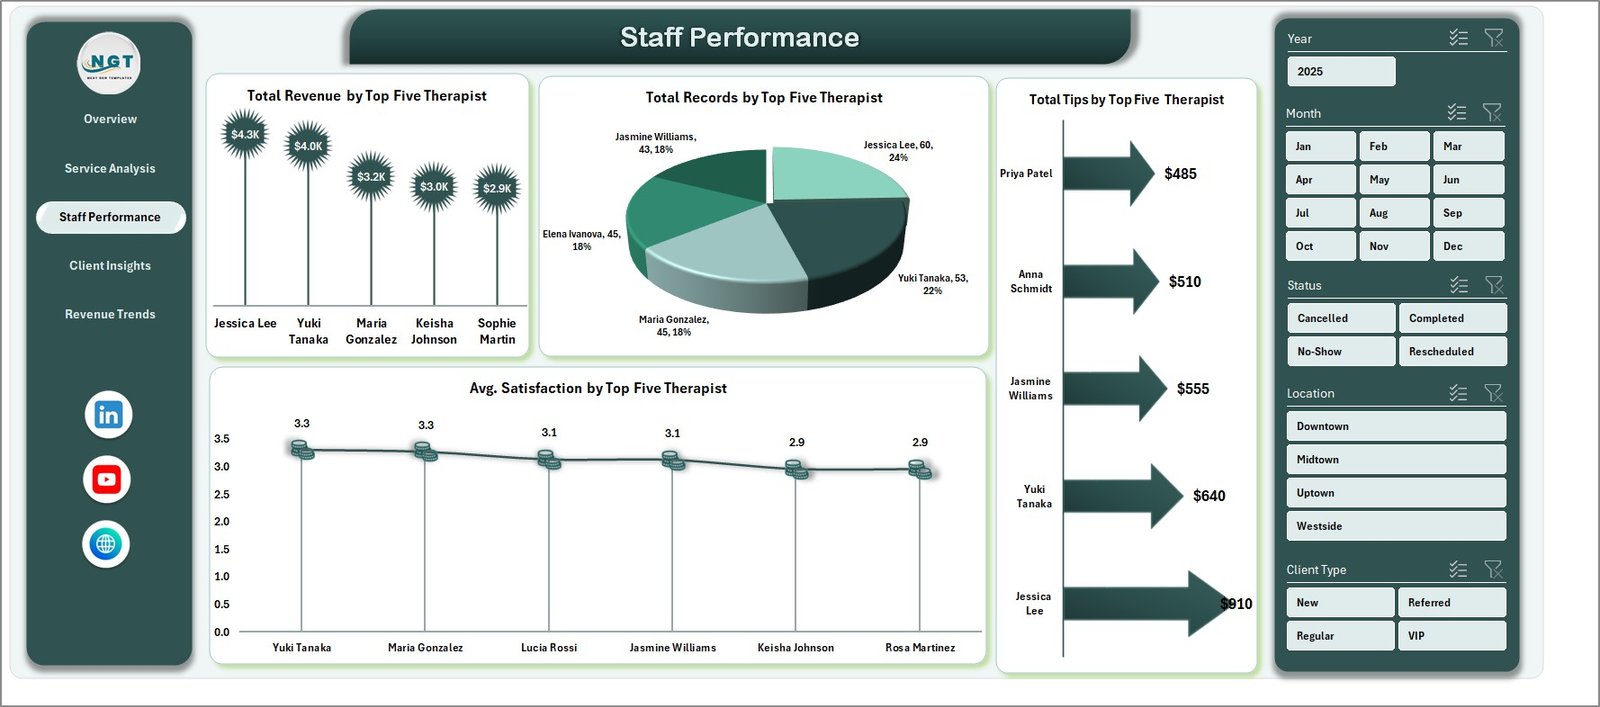
Staff Performance Page
4. Client Insights
The Client Insights page helps you understand your customer base and discover where your most valuable clients come from. This information is critical for marketing decisions and customer retention strategies.
The Avg. Satisfaction by Client Type chart shows how happy different client segments are with your services. The Total Records by Client Type chart reveals the size of each segment. The Total Records by Booking Source chart shows whether clients prefer booking online, by phone, walk-in, or through social media referrals. The Total Revenue by Booking Source chart goes a step further and reveals which channels generate the most revenue — not just volume. This helps you allocate your marketing budget more effectively.
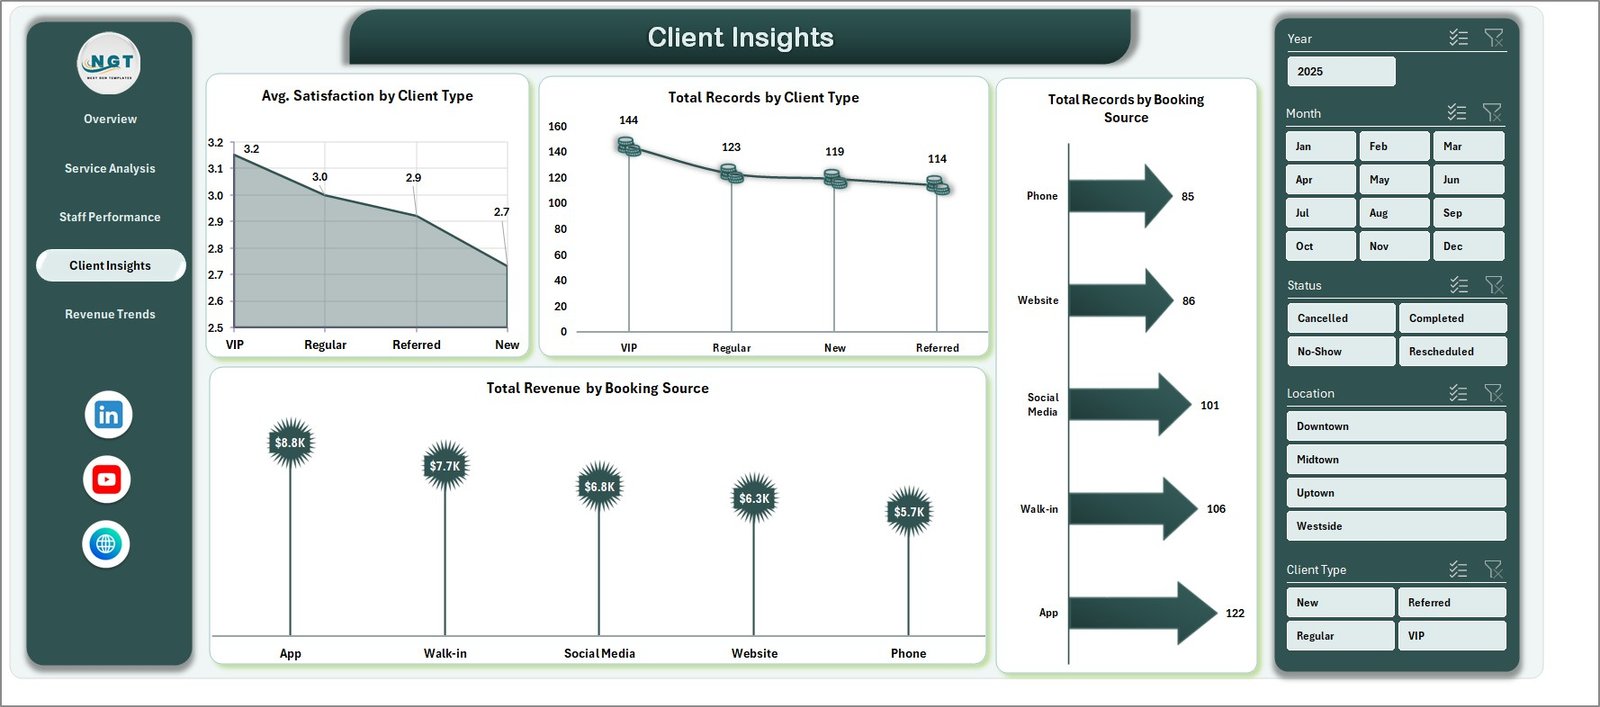
Client Insights Page
5. Revenue Trends
The Revenue Trends page provides a financial overview of your salon or spa business over time. This page is essential for strategic planning and identifying growth opportunities.
The Total Revenue by Status chart breaks down your earnings by appointment outcomes — completed, cancelled, and refunded. The Total Revenue by Payment Method chart shows how clients prefer to pay, whether cash, card, digital wallets, or other methods. The Total Revenue Vs Total Product Cost by Month chart is particularly powerful, showing your monthly revenue alongside costs so you can track profitability trends. The Total Revenue by Location chart lets multi-branch salons compare financial performance across different sites.
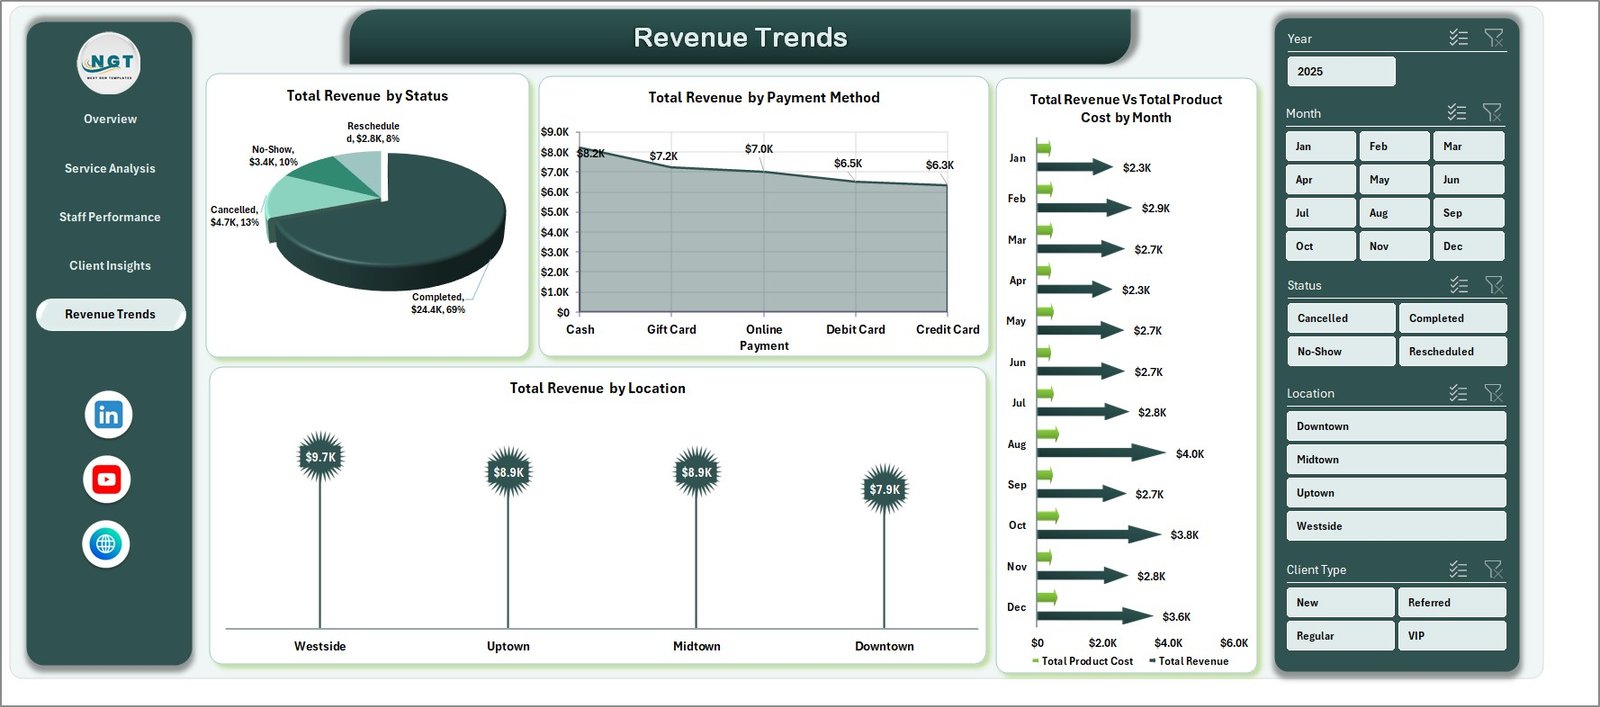
Revenue Trends Page
6. Data Sheet
The Data Sheet is where all your salon records live. It follows a structured format with predefined columns for appointment details, service information, client data, revenue figures, tips, satisfaction scores, and more. Simply paste your data into this sheet in the same format, and all the dashboard pages will update automatically when you refresh the pivot tables.
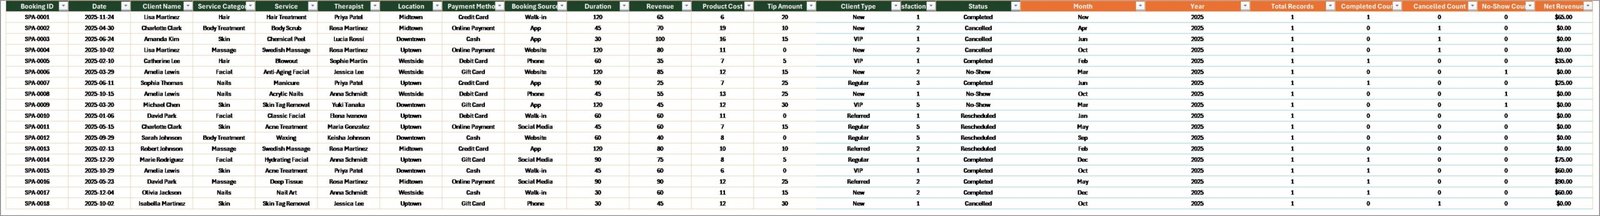
Data Sheet Tab
7. Support Sheet
The Support Sheet contains multiple pivot tables that power the entire dashboard dynamically. You do not need to modify anything on this sheet — it works behind the scenes. After updating data in the Data Sheet, go to the Data tab in the Excel Ribbon and click Refresh All. All the pivots will refresh and every chart across all 5 dashboard pages will update. You can keep this sheet hidden during presentations or client reviews for a cleaner look.
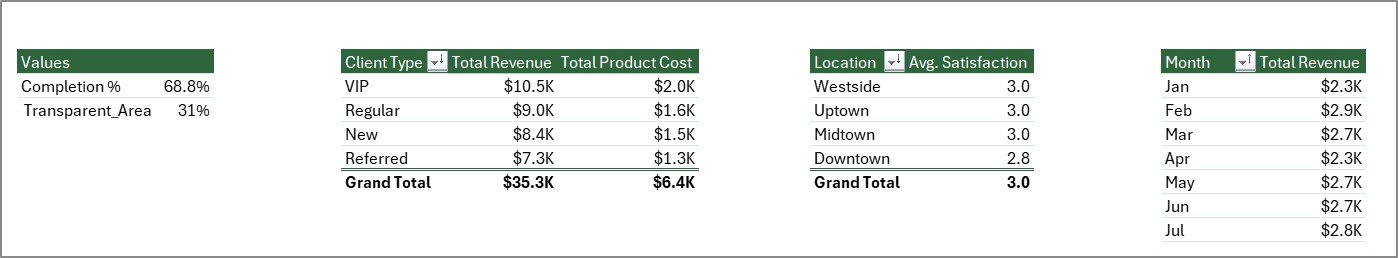
Support Sheet Tab
Advantages of Salon and Spa Dashboard in Excel
- Complete Business Visibility — Track revenue, services, staff, clients, and trends from a single workbook without switching between multiple tools or reports.
- Fully Dynamic — All charts and KPI cards are powered by pivot tables. Update your data and refresh — the entire dashboard reflects real-time performance instantly.
- Multi-Location Support — Built-in location analysis lets salon chains compare performance across branches and identify top-performing and underperforming locations.
- Staff Accountability — The Staff Performance page provides clear, data-driven metrics for evaluating therapists based on revenue, volume, tips, and client satisfaction.
- Client Retention Insights — Understand which booking sources and client types generate the most value, allowing you to optimize your marketing and loyalty programs.
- Zero Learning Curve — No macros, no VBA, no complex formulas. Just paste your data and click Refresh All.
Opportunities for Improvement
- Adding a calendar view or appointment scheduling visualization would help salon managers plan daily staffing and resource allocation more effectively.
- A dedicated product inventory tracking section would benefit spas that sell retail beauty products alongside services.
- Including a client loyalty or membership tracking module could help salons monitor repeat visit rates and membership renewals over time.
- A year-over-year comparison feature would make it easier to measure long-term business growth and seasonal patterns.
Best Practices for Using This Dashboard
- Update Data Weekly — For the most accurate insights, add new salon records to the Data Sheet at least once a week and refresh the pivot tables.
- Use Slicers Strategically — Combine multiple slicer filters to analyze specific segments, such as revenue from VIP clients at a particular location during a specific month.
- Share the Overview Page — When presenting to stakeholders or partners, use the Overview page as a one-page summary of business health. Hide the Support Sheet for a clean presentation.
- Compare Staff Monthly — Use the Staff Performance page during monthly team meetings to recognize top performers and identify training opportunities.
- Track Booking Source ROI — Use the Client Insights page to compare revenue by booking source. If online bookings generate more revenue per client, consider increasing your digital marketing spend.
Explore Relevant Templates
If you found this Salon and Spa Dashboard helpful, you may also want to explore these related templates from NextGenTemplates:
- Beauty Salons Dashboard in Excel — A specialized analytics dashboard focused specifically on beauty salon operations including appointment tracking, service analysis, and revenue metrics.
- Beauty Salons Dashboard in Power BI — An advanced interactive dashboard for beauty salons built in Microsoft Power BI with drill-through capabilities and AI-powered visuals.
- Alternative Medicine Dashboard in Excel — Track alternative health treatments, therapist performance, and client satisfaction in a similar dashboard format designed for wellness practices.
- Pet Care Services KPI Dashboard in Excel — A service-based KPI dashboard template that tracks similar metrics like customer satisfaction, revenue, and staff performance for pet care businesses.
Frequently Asked Questions
What KPIs does the Salon and Spa Dashboard in Excel track?
The Salon and Spa Dashboard in Excel tracks 5 key performance indicators on the overview page: Total Records, Total Revenue, Total Completed appointments, Total Tips earned, and Average Satisfaction score. Beyond the overview, it provides detailed metrics across service categories, staff performance rankings, client demographics, booking source analysis, and monthly revenue trends.
Click here to Purchase the Salon and Spa Dashboard in Excel
Do I need advanced Excel skills to use this dashboard?
No. The Salon and Spa Dashboard in Excel is designed for users of all skill levels. Simply replace the sample data in the Data Sheet with your own salon records and click Refresh All in the Data tab. All charts, KPI cards, and pivot tables update automatically without any manual formula work.
Can I use this dashboard for multiple salon or spa locations?
Yes. The dashboard includes location-based analysis on the Overview page (Avg. Satisfaction by Location) and the Revenue Trends page (Total Revenue by Location). Add records for all your branches in the Data Sheet and use the interactive slicers to filter by specific locations or view combined performance.
What is the best Excel dashboard template for tracking salon and spa performance?
The Salon and Spa Dashboard in Excel from NextGenTemplates is one of the best options for beauty businesses. It provides 5 interactive pages covering service analysis, staff performance, client insights, and revenue trends — all powered by dynamic pivot tables that require zero manual formula editing.
How do I refresh the dashboard after adding new data?
After adding or updating records in the Data Sheet, navigate to the Data tab in the Excel Ribbon and click Refresh All. This refreshes all pivot tables in the hidden Support Sheet and updates every chart across all 5 dashboard pages automatically.
Can I customize the charts or add new metrics to this dashboard?
Yes. Since the dashboard is built entirely with Excel pivot tables and standard charts, you can modify existing charts, add new pivot tables, or create additional analysis pages. Users with intermediate Excel skills can easily extend the template to include custom metrics specific to their salon or spa operations.
Conclusion
The Salon and Spa Dashboard in Excel is a must-have analytics tool for any beauty business looking to make data-driven decisions. With 5 interactive dashboard pages, 5 core KPI cards, dynamic pivot tables, and interactive slicers, this template transforms raw salon data into actionable visual insights. Whether you are tracking therapist performance, analyzing booking sources, or monitoring revenue trends across multiple locations, this dashboard gives you everything you need in one clean Excel workbook.
Click here to Purchase the Salon and Spa Dashboard in Excel
For more Excel dashboard tutorials and walkthroughs, visit our YouTube channel:
👉 Youtube.com/@PK-AnExcelExpert