The Property Management Dashboard in Power BI tracks 5 headline KPIs and 15+ visuals across 5 interactive report pages — Overview, Financial, Property, Maintenance, and Lease. The .pbix file takes under 10 minutes to set up and costs $17.99 one-time, compared with $3,000–$12,000+ per year for SaaS platforms like Buildium or AppFolio.
If you manage rental properties, run a boutique real-estate firm, or analyse a multifamily portfolio for investors, this Power BI dashboard gives you instant visibility into rent collection, occupancy, maintenance cost, and lease status — without the subscription, per-unit fees, or vendor lock-in of traditional property management software.
Key Features of the Property Management Dashboard in Power BI
- 5 dedicated report pages — Overview, Financial, Property, Maintenance, and Lease, each answering a different landlord or manager question.
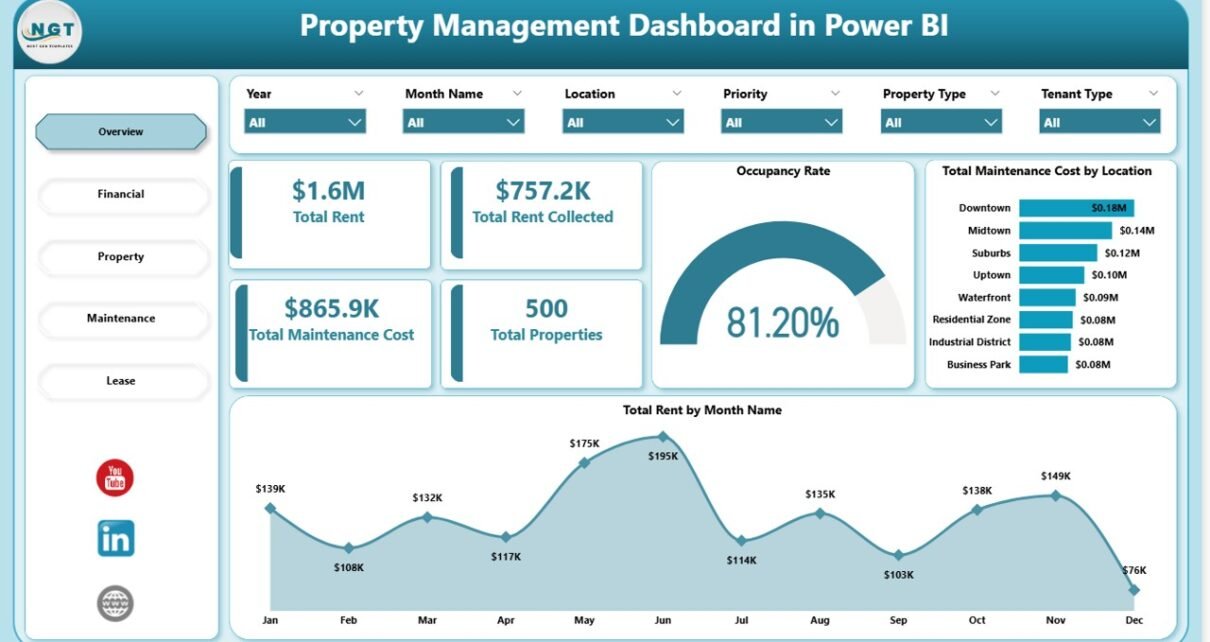
- 5 executive KPI cards on the Overview page — Total Rent, Total Rent Collected, Total Maintenance Cost, Total Properties, and Occupancy Rate.
- DAX-powered data model — every visual is driven by DAX measures, so swapping the source data refreshes every chart automatically.
- Rent collection analysis — compare Total Rent vs Total Rent Collected by Building, Tenant Type, and Property Manager.
- Maintenance cost control — break down spend by Priority, Maintenance Type, and Property Manager.
- Cross-page slicers — filter every page by Location, Property Manager, or Tenant Type with synced selections.
- Offline usage — runs in free Power BI Desktop, no Power BI Pro license required for local use.
For the data connection and DAX fundamentals used in this dashboard, see the Microsoft Power BI fundamentals documentation.
Dashboard Pages Explanation
Page 1 — Overview
The Overview page is the executive summary. Five KPI cards at the top of the page show Total Rent, Total Rent Collected, Total Maintenance Cost, Total Properties, and Occupancy Rate at a glance. Below the cards, two charts provide context: Total Maintenance Cost by Location reveals which cities or regions are driving repair budgets, and Total Rent by Month Name shows seasonal revenue patterns across the year. Slicers at the top let you filter the entire page by Location, Property Manager, or Tenant Type.
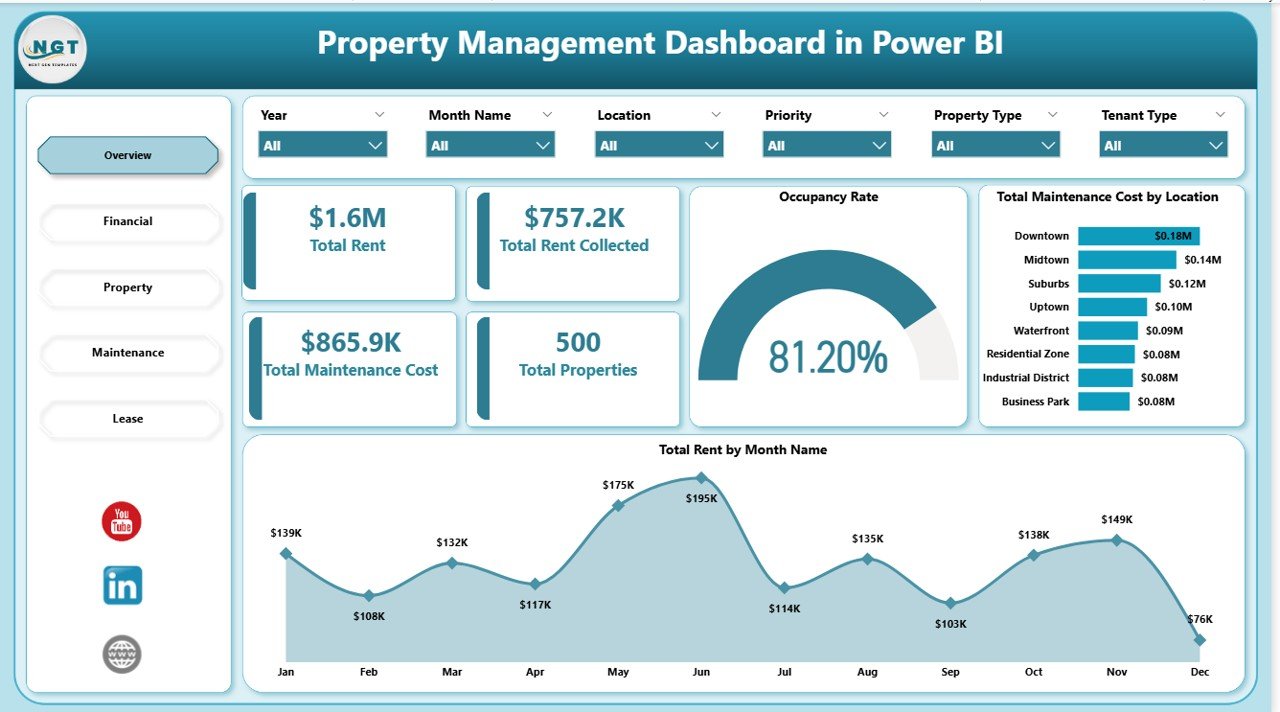
Overview Page — Property Management Dashboard in Power BI
Page 2 — Financial
The Financial page is where rent collection performance becomes visible. Total Rent by Tenant Type breaks revenue down between residential, commercial, and short-term tenants so you can see which segment drives the portfolio. Total Rent and Total Rent Collected by Building compares the two values side by side — the gap between them is your collection problem. Total Rent by Property Manager shows which managers are hitting targets and which need leasing support or renegotiated units.
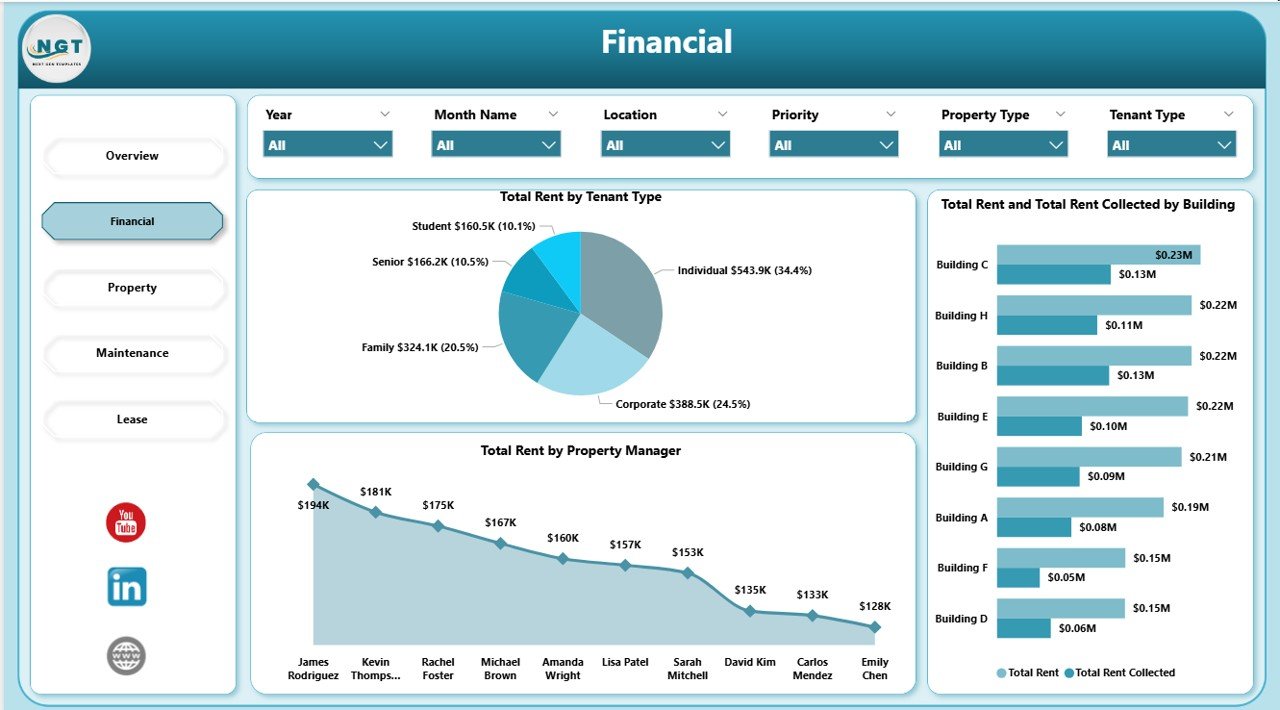
Financial Page — Rent & Collection Analysis
Page 3 — Property
The Property page is the portfolio breakdown. Total Properties by Property Type tells you the mix between apartments, houses, commercial units, and short-term rentals. Occupied Properties and Total Properties by Location shows which cities are full and which have vacancies to fill. Vacant Properties by Property Manager lets you assign leasing priorities — if one manager is sitting on 8 vacant units while another has zero, that’s an immediate action item.
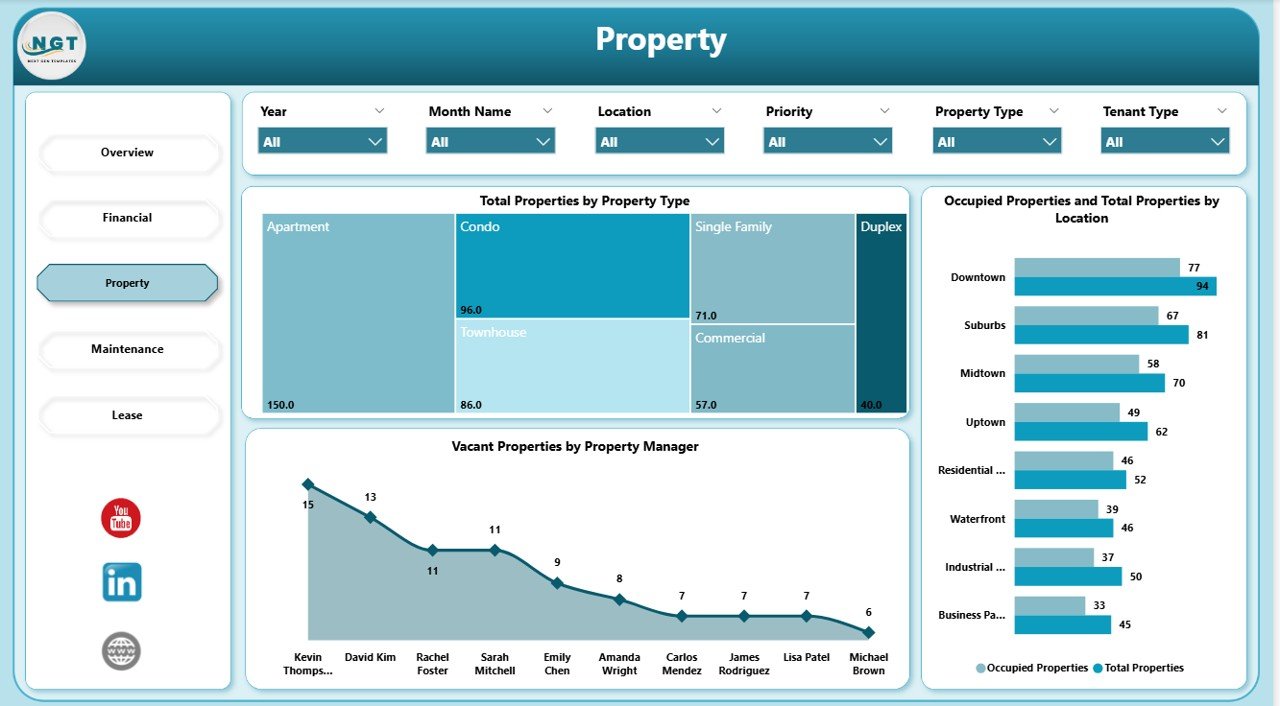
Property Page — Portfolio Breakdown
Page 4 — Maintenance
The Maintenance page is the cost-control layer. Total Maintenance Cost by Priority shows how much you are spending on emergency vs scheduled work — a high emergency ratio is a leading indicator of deferred maintenance. Total Maintenance Cost by Property Manager exposes which managers run lean operations and which may be over-approving contractor invoices. Total Maintenance Cost by Maintenance Type reveals whether plumbing, HVAC, or structural work is driving the budget.
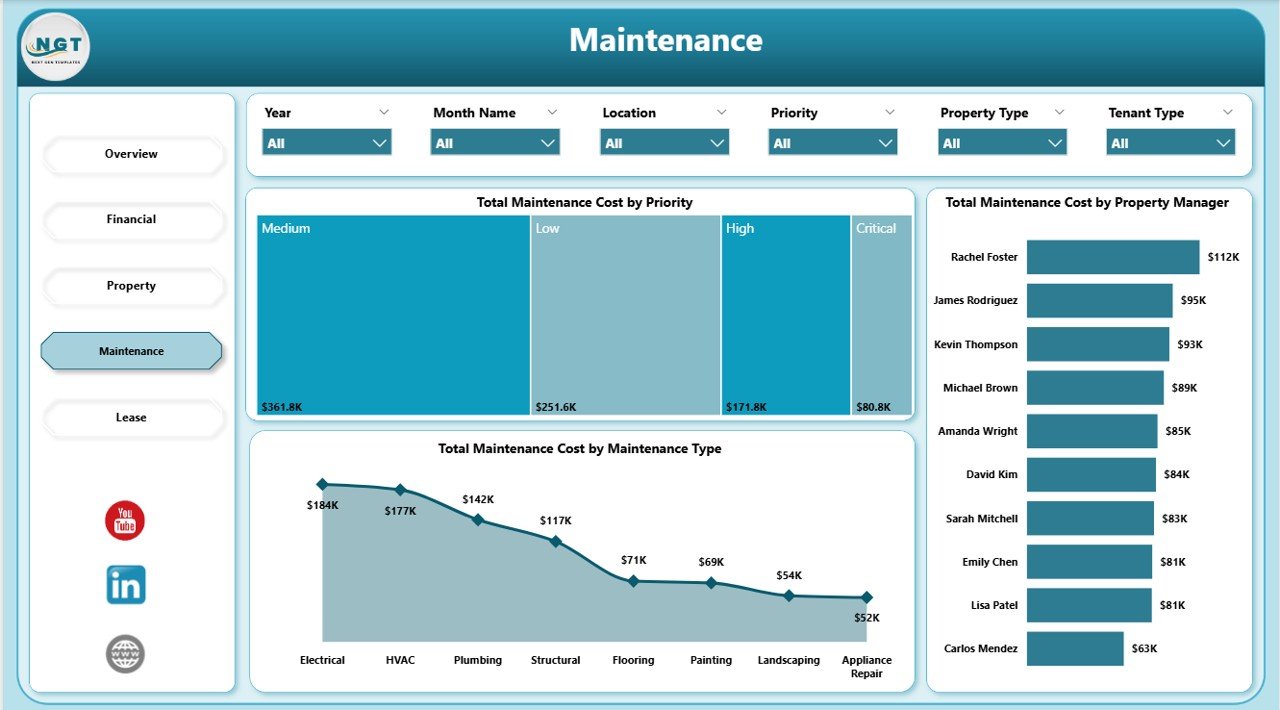
Maintenance Page — Cost Analysis
Page 5 — Lease
The Lease page is the renewal and churn planning layer. Total Properties by Lease Status shows the split between Active, Expired, Pending Renewal, and Terminated leases — the Pending Renewal bucket is your priority list. Total Rent by Month Name layered with lease status shows seasonal renewal patterns. Vacant Properties by Tenant Type highlights whether commercial or residential vacancies are driving loss, so you can focus marketing dollars accordingly.
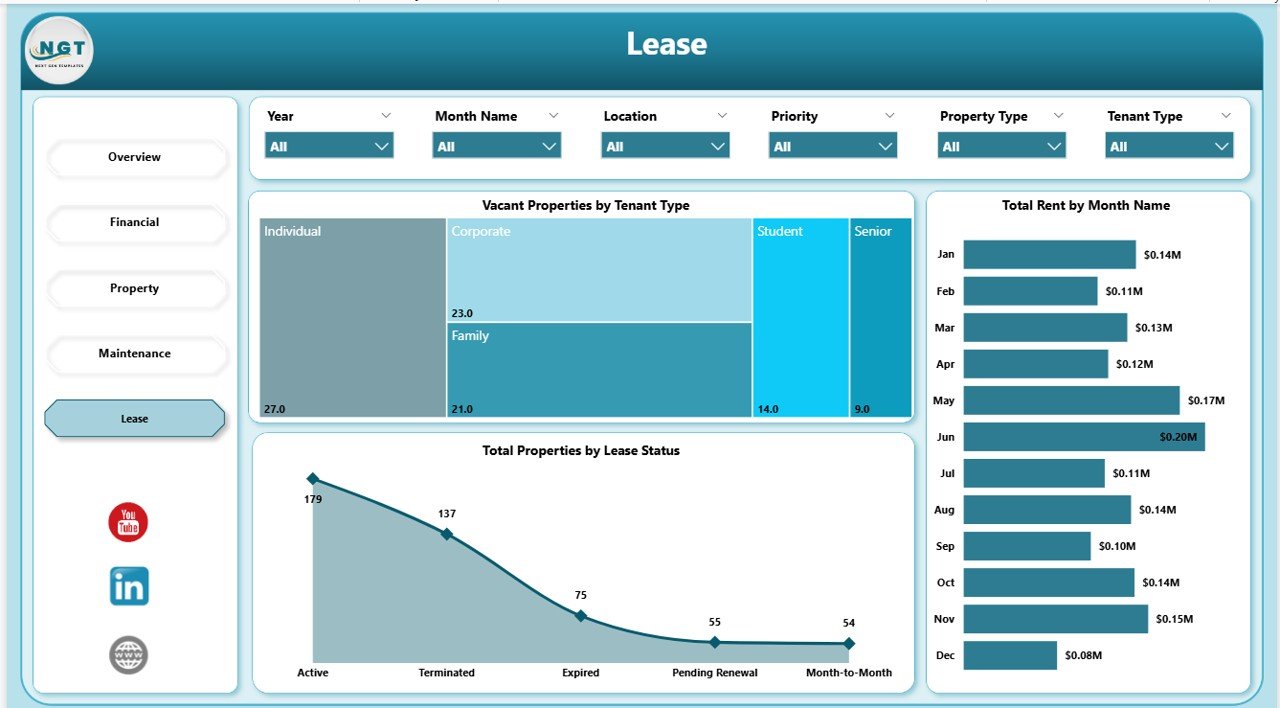
Lease Page — Status & Renewal Planning
Who Should Use This Template
Perfect for:
- Independent landlords and property owners managing 5–500 rental units
- Small-to-mid property management firms reporting to investors or REITs
- Real estate analysts and accountants already using Power BI
- Property managers replacing manual Excel exports with live analytics
Not a fit if:
- You are an enterprise REIT needing SOC 2, SSO, and ERP integrations
- You need lease accounting under ASC 842 or IFRS 16 (this is analytics, not accounting)
- Your source data is not in Excel, CSV, or SQL tabular format
Real-World Use Cases
David runs a 60-unit rental portfolio across three cities. Every Monday morning he opens the Property Management Dashboard in Power BI, checks the Overview page for occupancy rate, flips to Financial to see which buildings are behind on collections, and sends his leasing manager the Vacant Properties by Location visual. The entire weekly review takes 15 minutes instead of the two hours it used to take in Excel — and he does not pay the $450/month AppFolio subscription he cancelled six months ago.
Priya is a real estate analyst at a boutique investment firm. Her team is evaluating three multifamily acquisition targets. She loads the rent roll and maintenance log for each portfolio into the dashboard one at a time, uses the Maintenance page to benchmark cost-per-unit by Property Manager, and builds a side-by-side comparison deck that becomes the core of the quarterly investor review.
Marcus manages commercial leases for a family-office real estate fund. He relies on the Lease page to track Total Properties by Lease Status and flag upcoming renewals by Tenant Type three months before expiration. That lead time has cut his churn by 18% because his team now proactively renegotiates instead of scrambling after the fact — all for a one-time $17.99 purchase.
Advantages of the Property Management Dashboard in Power BI
- $17.99 one-time vs $55–$450/month SaaS — you save $3,000–$12,000+ in year 1.
- Under 10-minute setup — no consultants, no training, no onboarding fees.
- Full data ownership — the .pbix file lives on your computer, not a vendor’s cloud.
- Unlimited users — one license, entire team access via Power BI Desktop.
- Fully customisable — open DAX, open visuals, open slicers. Change anything.
- Integrates with your stack — connect to Excel, CSV, SQL, SharePoint, or SaaS exports.
Opportunities for Improvement
This dashboard is purpose-built for analytics, not operations. It does not handle tenant communication, online rent collection, maintenance ticketing, or lease accounting under ASC 842. If you need a tenant portal or want to issue work orders directly from the dashboard, you will still need a transactional system — this template sits above that system as the analytics layer. Users with very large portfolios (5,000+ units) may also need to move the data model to Power BI Service with a gateway for scheduled refresh, which requires a Power BI Pro license.
Best Practices
- Standardise your source data monthly — same columns, same data types, same property IDs. Inconsistency breaks the data model.
- Use the Location and Property Manager slicers as your primary review lens — drill into one segment at a time for cleaner conversations.
- Export the Overview page to PDF as your monthly investor or board report — the layout is already presentation-ready.
- Watch the Maintenance Cost by Priority chart — a rising emergency-to-scheduled ratio is the earliest warning of deferred maintenance.
- Review Pending Renewals 90 days out on the Lease page to lock in renewals before tenants shop the market.
Explore Relevant Templates
- Property Management Dashboard in Excel — the same analytics in a pure Excel workbook, ideal if your team does not use Power BI.
- Property Management Dashboard in HTML — a browser-based version that runs without any installation.
- Real Estate Agent Dashboard in Excel — for the agent/listing side of the business rather than landlord-side.
- Rental Property Investment Dashboard in Google Sheets — investor-focused with ROI, cash-on-cash, and cap-rate analysis.
- Hotel and Hospitality Revenue Dashboard in Power BI — adjacent vertical for short-term rental and hospitality portfolios.
- Browse more Power BI Dashboard Templates.
Frequently Asked Questions
What KPIs does the Property Management Dashboard in Power BI track?
The Property Management Dashboard in Power BI tracks 5 headline KPIs on the Overview page — Total Rent, Total Rent Collected, Total Maintenance Cost, Total Properties, and Occupancy Rate — plus 10+ secondary visuals across Financial, Property, Maintenance, and Lease pages. All metrics update automatically when you replace sample data with your own rent roll and maintenance log.
Do I need Power BI Pro or a paid Microsoft license?
No. The Property Management Dashboard in Power BI runs in Power BI Desktop, which is free from Microsoft. You only need Power BI Pro if you want to publish reports to the Power BI Service for team sharing. Local use, PDF export, and all 5 report pages work fully in the free Desktop version.
How does this compare to Buildium or AppFolio?
Buildium and AppFolio are full SaaS property management platforms with tenant portals, accounting, and per-unit fees ranging from $55 to $450+ per month. The Property Management Dashboard in Power BI is a one-time $17.99 analytics layer you own and customize — no subscription, no per-unit fees, no vendor lock-in, and fully editable DAX measures.
How long does setup take?
Setup takes under 10 minutes. Open the .pbix in Power BI Desktop, point the data source at your property list and rent roll (Excel, CSV, or SQL), and click Refresh. All 5 pages, KPI cards, and visuals rebuild automatically against your live data — no visual editing required.
Can I add new cities, buildings, or tenant types?
Yes. The Property Management Dashboard in Power BI uses a flexible star-schema data model. Add rows to your source table for new buildings, locations, or tenant types, refresh the model, and all slicers and visuals automatically include the new values. You do not need to edit any visual manually.
Is this a subscription or a one-time payment?
One-time payment of $17.99. You get instant download, full .pbix file ownership, lifetime access, and no per-user fees. There is no subscription, no recurring charges, and no expiration date on the Property Management Dashboard in Power BI.
About the Author
Built by PK — Microsoft Certified Professional with 15+ years of Excel, Google Sheets, and Power BI experience. Founder of NextGenTemplates, reaching 300K+ subscribers across YouTube channels. Every template is hand-built and tested before release.
Conclusion
The Property Management Dashboard in Power BI gives landlords, property managers, and real-estate analysts a production-ready portfolio analytics layer for a one-time $17.99 — a fraction of what Buildium, AppFolio, or custom Tableau builds would cost in year one. Five report pages, 5 KPIs, 15+ visuals, and cross-page slicers, all running in free Power BI Desktop.
👉 Click here to Purchase the Property Management Dashboard in Power BI
✅ Instant download · One-time payment · No subscription · Lifetime access
🎥 For Power BI video tutorials, visit Youtube.com/@PK-AnExcelExpert.