The Crowdfunding Platforms KPI Dashboard in Excel tracks campaign performance across 7 structured worksheets, covering MTD and YTD actuals against targets and previous-year benchmarks. With conditional formatting arrows, 12-month trend charts, and a month-selector dropdown, this template gives platform managers and startup founders a single workbook to monitor pledge conversion, backer retention, funding velocity, and every other crowdfunding metric — without building formulas from scratch.
According to Microsoft’s Excel documentation, Excel remains the most widely used analytics tool in finance and startup teams globally. This ready-to-use Crowdfunding Platforms KPI Dashboard in Excel lets you define your own KPIs, enter data in three separate input sheets, and get a visual performance report instantly. Setup takes under 10 minutes.
Key Features of Crowdfunding Platforms KPI Dashboard in Excel
👉 Click here to Purchase Crowdfunding Platforms KPI Dashboard in Excel
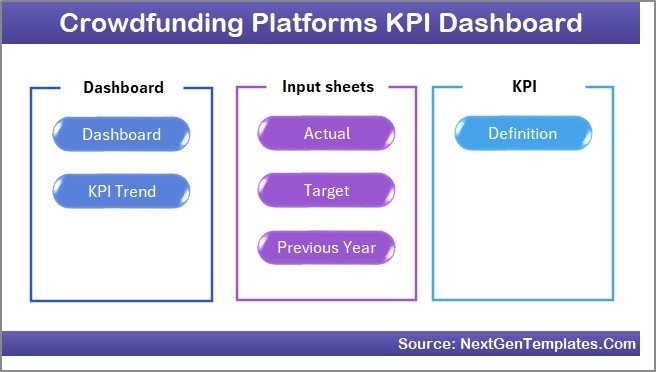
The Crowdfunding Platforms KPI Dashboard in Excel includes 7 worksheets: Home, Dashboard, KPI Trend, Actual Numbers Input, Target Number Input, Previous Year Numbers, and KPI Definition. Each worksheet serves a specific function in the KPI tracking workflow.
The Dashboard sheet displays MTD Actual, Target, and Previous Year values alongside YTD equivalents with conditional formatting arrows that flag whether each metric is on track, behind, or ahead of the prior year. The KPI Trend sheet plots 12-month trend charts for any selected KPI, comparing Actual vs. Target vs. Previous Year. Three dedicated input sheets keep raw data organized — one for actuals, one for targets, and one for previous-year numbers — while the KPI Definition sheet documents every metric’s name, group, unit, formula, definition, and type (Lower the Better or Upper the Better).
The template uses standard Excel formulas and conditional formatting with no VBA macros, so it runs on both Windows and Mac without compatibility issues.
Dashboard Pages Explanation
👉 Click here to Purchase Crowdfunding Platforms KPI Dashboard in Excel
1. Home Sheet
The Home sheet is an index page with 6 navigation buttons. Each button jumps directly to a specific worksheet — Dashboard, KPI Trend, Actual Numbers, Target Numbers, Previous Year Numbers, or KPI Definition. No scrolling through tabs required.
 Home Page
2. Dashboard Sheet
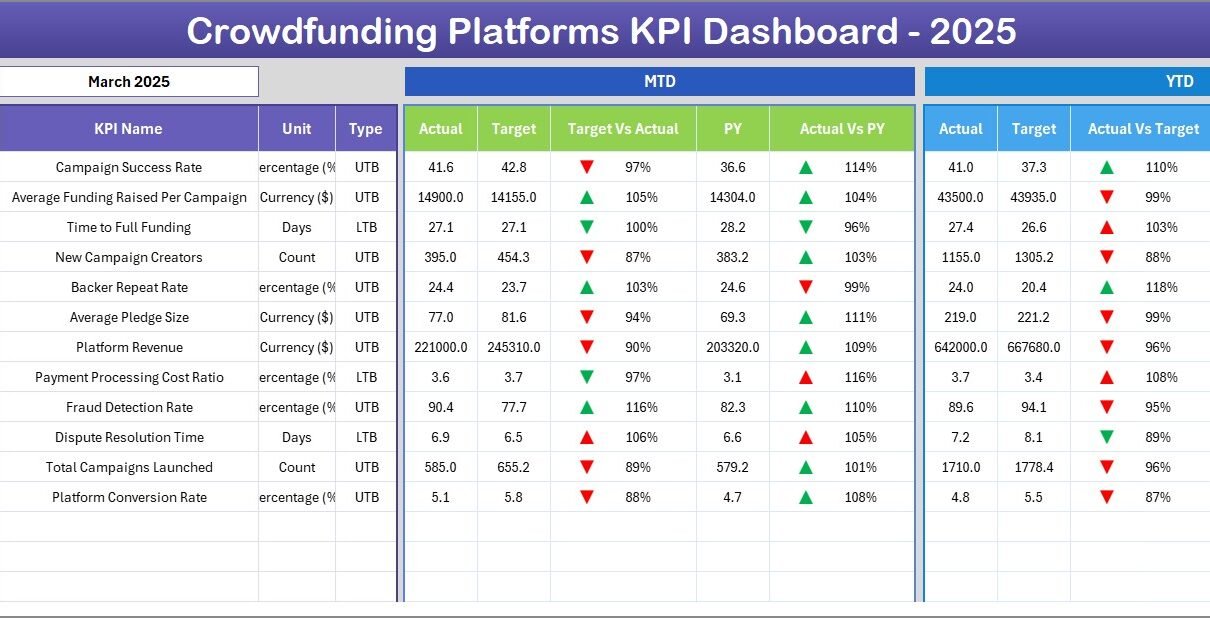
This is the main reporting view of the Crowdfunding Platforms KPI Dashboard in Excel. Select a month from the dropdown on cell D3 and every number on the sheet recalculates. The sheet is divided into MTD and YTD sections, each showing Actual, Target, and Previous Year data. Two variance columns — Target vs. Actual and PY vs. Actual — use conditional formatting with up/down arrows so you can see at a glance which KPIs are meeting targets and which need attention.
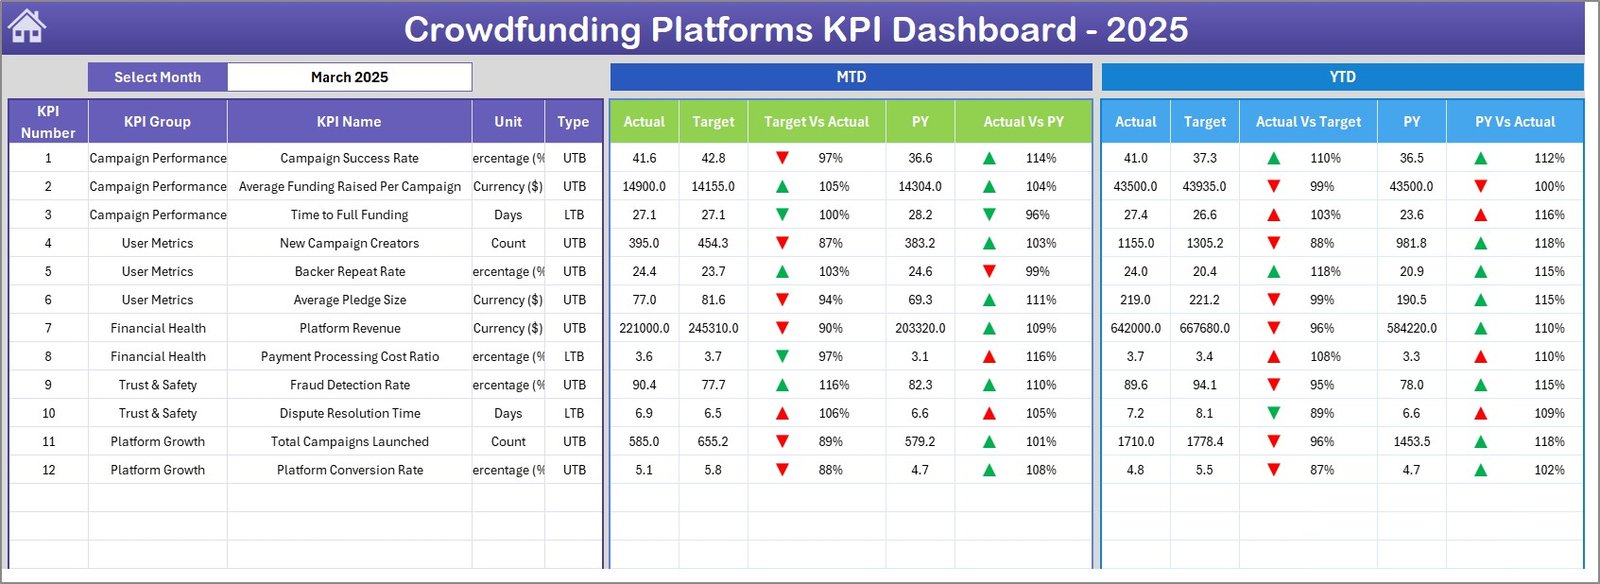 Crowdfunding Platforms KPI Dashboard
3. KPI Trend Sheet
Select any KPI from the dropdown on cell C3 to see its detailed trend analysis. At the top, the sheet displays KPI Group, Unit of measurement, KPI Type (LTB or UTB), Formula, and Definition. Below that, two trend charts plot the 12-month MTD and YTD lines for Actual, Target, and Previous Year — making it easy to spot seasonal patterns or sustained declines.
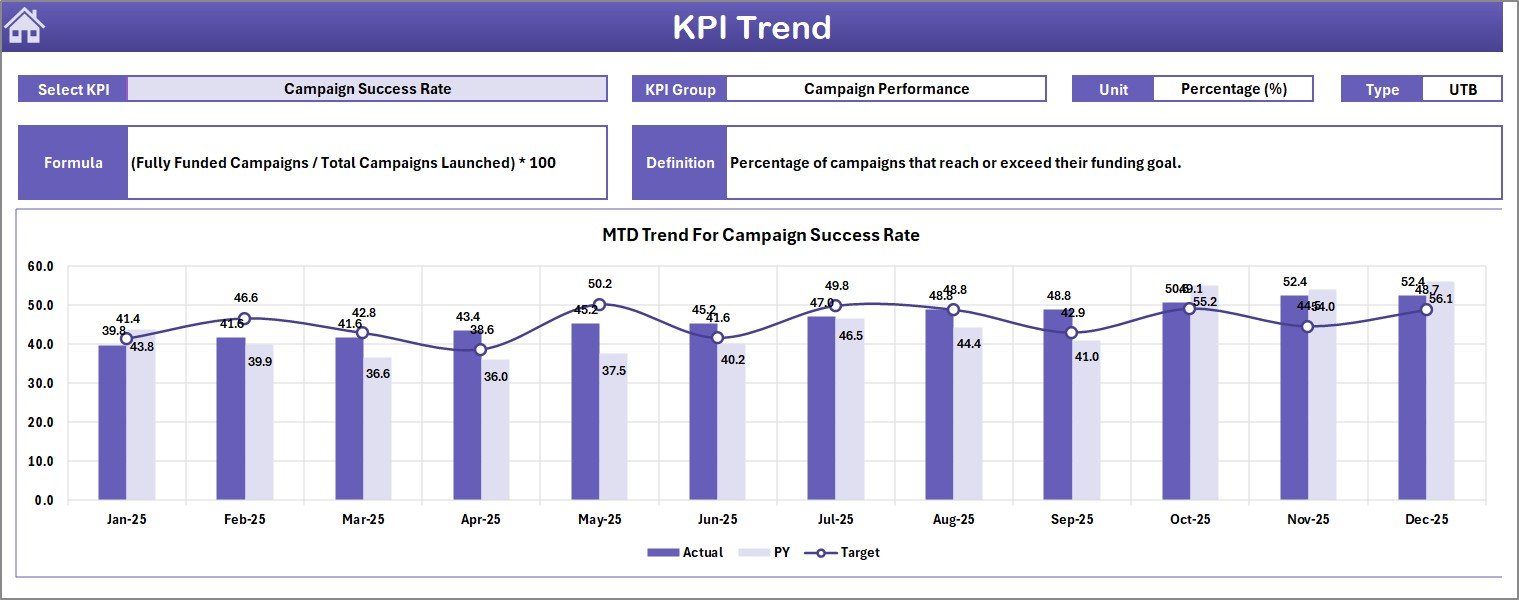 KPI Trend Sheet
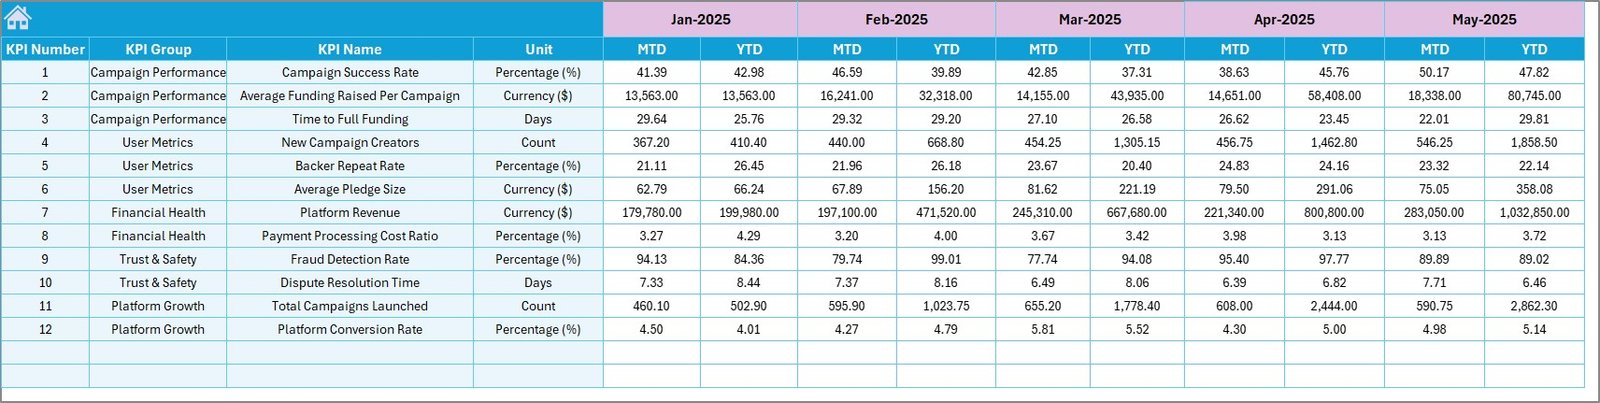
4. Actual Numbers Input Sheet
Enter your MTD and YTD actual numbers for each KPI per month here. Cell E1 sets the first month of your fiscal year — change it once and the entire column header sequence adjusts. This sheet feeds the Dashboard and KPI Trend sheets automatically.
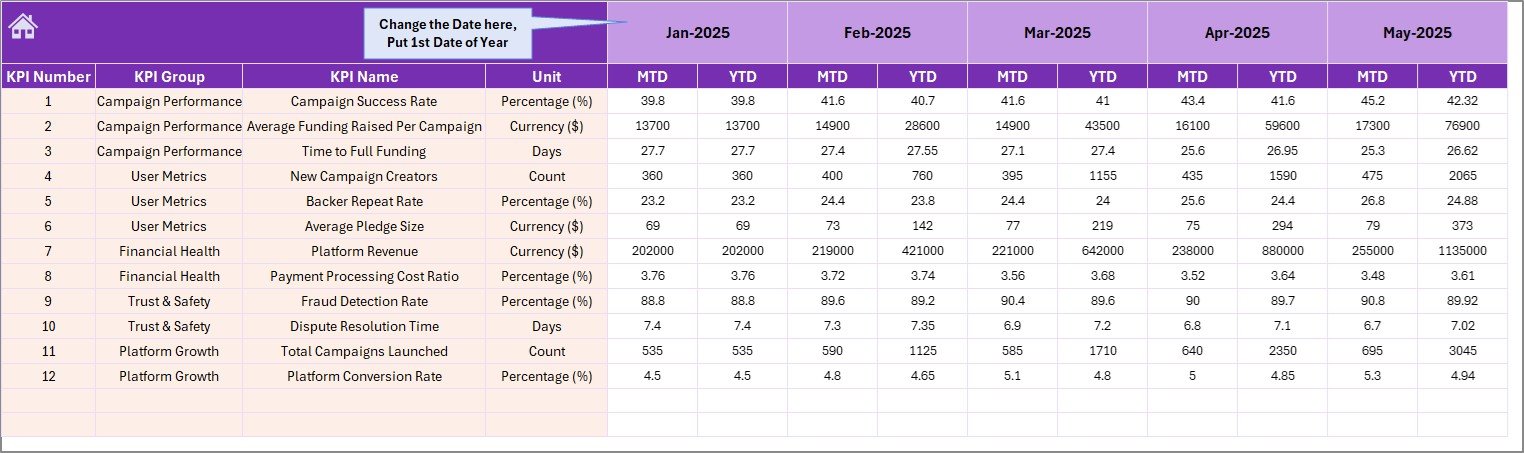 Actual Numbers Input Sheet
5. Target Number Input Sheet
Enter monthly MTD and YTD targets for each KPI. These targets drive the variance calculations on the Dashboard sheet — whenever you change a target, the conditional formatting arrows update in real time.
 Target Number Input Sheet
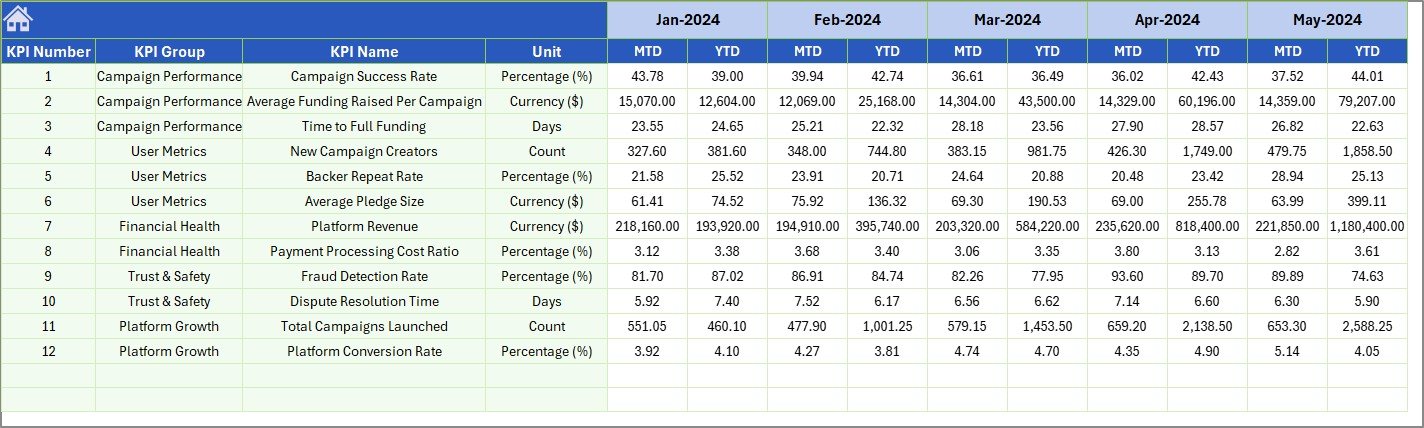
6. Previous Year Number Sheet
Enter previous-year data in the same format as the current-year actuals. This enables year-over-year comparisons on both the Dashboard and KPI Trend sheets, giving you a historical baseline for every metric.
 Previous Year Number Input Sheet
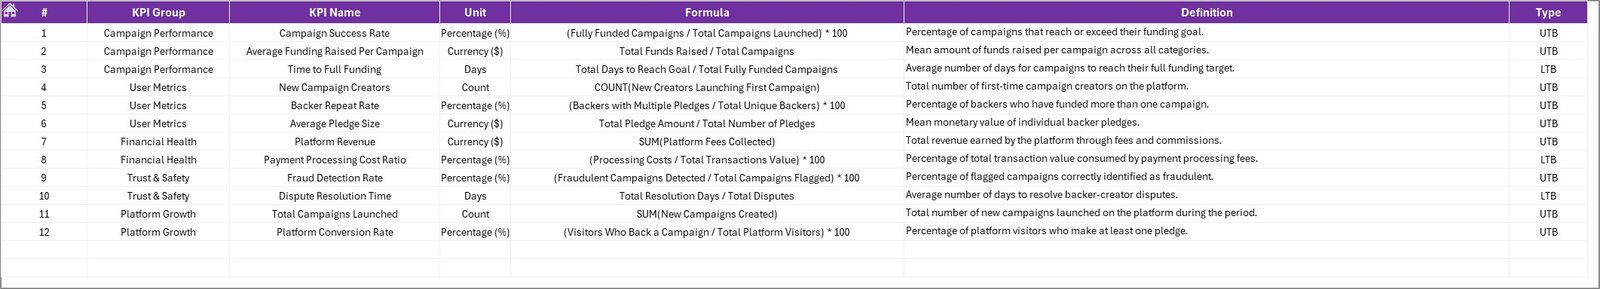
7. KPI Definition Sheet
Define each KPI’s Name, Group, Unit, Formula, Definition, and Type (LTB or UTB). This sheet serves as the single source of truth for all metrics — the KPI Trend sheet pulls its metadata display from here, and new team members can look up any metric’s meaning instantly.
 KPI Definition Sheet
Crowdfunding Platforms KPI Dashboard vs. Google Sheets Equivalent vs. BackerKit Analytics — Feature Comparison
| Feature | Crowdfunding Platforms KPI Dashboard (Excel) | Google Sheets KPI Template | BackerKit Analytics / Fundly Pro |
|---|---|---|---|
| Cost | $14.99 one-time | Free–$15 (limited) | $29–$99/month |
| Platform | Microsoft Excel (desktop + web) | Google Sheets (browser) | Cloud SaaS |
| Setup Time | Under 10 minutes | 30–60 minutes | 1–3 hours + onboarding |
| MTD + YTD Tracking | ✅ Built-in with PY comparison | Manual formulas | ✅ Automated |
| Conditional Formatting Arrows | ✅ Pre-built | Requires custom rules | ✅ Built-in |
| KPI Trend Charts | ✅ Auto-generated per KPI | Manual chart creation | ✅ Built-in |
| Offline Access | ✅ Full offline capability | ❌ Requires internet | ❌ Requires internet |
| Customizable KPI Definitions | ✅ Dedicated definition sheet | Varies by template | Limited customization |
| Year-1 Cost (5 Users) | $14.99 total | $0–$15 | $1,740–$5,940 |
For crowdfunding teams that want structured KPI tracking without monthly SaaS fees, the Crowdfunding Platforms KPI Dashboard in Excel sits in the sweet spot between free-but-manual spreadsheets and expensive analytics platforms.
Who Should Use This Template
Perfect for:
- Crowdfunding platform managers tracking campaign performance across multiple projects
- Startup founders monitoring pledge conversion, backer growth, and funding velocity month by month
- Finance teams at crowdfunding companies comparing actuals against targets and previous-year benchmarks
- Consultants reporting crowdfunding KPIs to clients without licensing per-seat SaaS tools
Not a fit if:
- You need real-time API integrations pulling live data from Kickstarter, Indiegogo, or GoFundMe
- Your team requires simultaneous multi-user editing in the same file — Excel is best with one editor at a time (share via OneDrive for sequential access)
Real-World Use Cases
👉 Click here to Purchase Crowdfunding Platforms KPI Dashboard in Excel
Amit manages platform analytics at a mid-size equity crowdfunding company. He uses the Crowdfunding Platforms KPI Dashboard in Excel to track 15 KPIs — including campaign success rate, average pledge size, backer churn, and platform fee revenue — across monthly board reports. Before switching to this template, his team spent 6 hours per month manually assembling charts in PowerPoint. Now the dashboard auto-updates in under 10 minutes.
Lisa runs a rewards-based crowdfunding consultancy. She customizes a copy of this dashboard for each client campaign, entering actual pledge data weekly and comparing it against the funding target. The KPI Trend sheet lets her show clients exactly where pledge momentum slowed — and the PY comparison proves whether the current campaign outperforms last year’s launch.
Carlos is the CFO of a donation-based crowdfunding platform. He tracks platform-level KPIs — total campaigns hosted, average funding percentage, donor retention rate, and processing fee revenue — and presents the Dashboard sheet directly in monthly leadership meetings. The conditional formatting arrows make it easy for non-technical board members to see which metrics need attention.
Advantages of Crowdfunding Platforms KPI Dashboard in Excel
The main advantage is cost: a $14.99 one-time purchase replaces ongoing SaaS subscriptions that can run $29–$99/month per user. For a 5-person team, that is a saving of $1,700+ in the first year alone.
The template is fully offline-capable — useful for teams in areas with unreliable internet or organizations that restrict cloud tool access for data privacy reasons. Since it uses standard Excel formulas with no VBA macros, it works identically on Windows and Mac without compatibility prompts.
Every KPI is user-defined on the KPI Definition sheet, so the template adapts to equity crowdfunding, rewards-based, donation-based, or debt-based models without structural changes. The separate input sheets keep actuals, targets, and previous-year data cleanly organized, reducing the chance of formula errors from mixed data entry.
Opportunities for Improvement
👉 Click here to Purchase Crowdfunding Platforms KPI Dashboard in Excel
The dashboard does not pull data automatically from crowdfunding platforms — all data entry is manual. Teams tracking high-frequency metrics (daily pledge counts, real-time backer activity) may find the monthly input cadence too slow for their workflow.
The template is designed for single-editor use. While you can share the file via OneDrive or email, simultaneous editing by multiple team members is not supported. Organizations with large analytics teams may prefer a cloud-based alternative that supports concurrent access.
Visual customization is limited to what Excel conditional formatting and standard charts support — teams wanting branded, presentation-grade visualizations may need to export data into Power BI or a dedicated reporting tool.
Best Practices
Fill in the KPI Definition sheet first before entering any numbers. Defining KPI names, groups, units, formulas, and types upfront ensures the Dashboard and KPI Trend sheets display accurate metadata from the start.
Set the fiscal year start month in cell E1 of the Actual Numbers Input sheet before entering data. Changing it later will shift column alignment and may require re-entering numbers.
Update actuals within the first week of each new month while the data is fresh. Consistent monthly entry keeps trend charts meaningful and avoids end-of-quarter data backfills.
Use the PY comparison to set realistic targets. If last year’s pledge conversion rate was 4.2%, setting a target of 15% without a specific growth strategy will produce misleading red arrows across the dashboard.
Back up the file monthly. Save a dated copy (e.g., Crowdfunding_KPI_Dashboard_Apr2026.xlsx) so you always have a clean historical snapshot if formulas are accidentally overwritten.
Explore Relevant Templates
📌 Crowdfunding KPI Scorecard in Excel — A traffic-light scorecard format for tracking crowdfunding KPIs with Actual vs. Target status indicators.
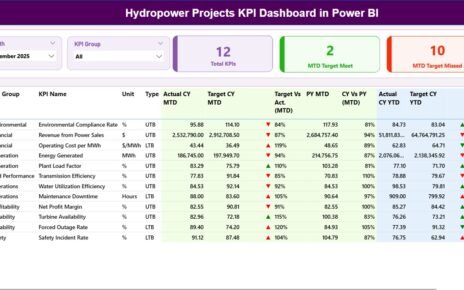
📌 Crowdfunding Platforms Dashboard in Power BI — The Power BI version with interactive slicers and drill-through pages for deeper crowdfunding analytics.
📌 Business Angel Networks KPI Dashboard in Excel — Track angel investment KPIs including deal flow, portfolio returns, and syndication metrics.
📌 Investor Relations Dashboard in Excel — Monitor shareholder communications, earnings metrics, and investor engagement KPIs.
📌 Also available as: Power BI version | KPI Scorecard version
Browse all KPI Dashboard templates on NextGenTemplates.
Frequently Asked Questions
👉 Click here to Purchase Crowdfunding Platforms KPI Dashboard in Excel
What KPIs does the Crowdfunding Platforms KPI Dashboard track?
The Crowdfunding Platforms KPI Dashboard in Excel tracks any crowdfunding metric you define — pledge conversion rate, average pledge amount, backer retention, funding velocity, campaign success rate, and more. You configure all KPIs on the KPI Definition sheet.
How long does setup take?
Setup takes under 10 minutes. Open the file in Excel, fill in your KPI definitions, enter target and actual numbers, and the dashboard generates all charts and variance calculations automatically.
Can I customize the KPIs for my specific crowdfunding platform?
Yes. The KPI Definition sheet lets you add, rename, or remove any KPI. Enter the KPI name, group, unit, formula, definition, and type (LTB or UTB). The dashboard adapts to whatever metrics you define.
How does this compare to BackerKit Analytics or Fundly Pro?
BackerKit Analytics costs $29–$99 per month with per-seat pricing. The Crowdfunding Platforms KPI Dashboard in Excel is a $14.99 one-time purchase with no recurring fees, no user limits, and full offline access. It lacks real-time API integrations but handles manual KPI tracking effectively.
Does this work on Mac?
Yes. The Crowdfunding Platforms KPI Dashboard works in Microsoft Excel for Mac 2016 or later. It uses standard Excel formulas, conditional formatting, and charts — no VBA macros required.
Can I track month-over-month and year-over-year trends?
Yes. The KPI Trend sheet plots 12-month trends for Actual, Target, and Previous Year data. The Dashboard sheet shows both MTD and YTD variances against targets and prior-year figures with conditional formatting arrows.
Is this template suitable for equity crowdfunding, rewards-based, or donation-based platforms?
Yes. Since you define your own KPIs on the KPI Definition sheet, the Crowdfunding Platforms KPI Dashboard in Excel works for any crowdfunding model — equity, rewards, donation, or debt-based. Just enter the metrics relevant to your platform.
About the Author
Built by PK — Microsoft Certified Professional with 15+ years of Excel, Google Sheets, and Power BI experience. Founder of NextGenTemplates, reaching 300K+ subscribers across YouTube channels (@PK-AnExcelExpert, @NextGenTemplates, @NeoTechNavigators). Every template is hand-built and tested before release.
Conclusion
The Crowdfunding Platforms KPI Dashboard in Excel gives crowdfunding teams a structured, offline-capable KPI tracking system for $14.99 — replacing monthly SaaS subscriptions that cost 10x more. With 7 worksheets covering data entry, dashboard visualization, and trend analysis, it is ready to use in under 10 minutes.
👉 Click here to Purchase Crowdfunding Platforms KPI Dashboard in Excel
✅ Instant download · One-time payment · No subscription
🎥 Visit our YouTube channel for step-by-step video tutorials: Youtube.com/@PK-AnExcelExpert
📅 Last updated: April 2026